A complete guide for crypto asset traders on trading strategies with long-wick candlesticks. Discover how to identify bullish and bearish patterns, understand the psychology of John Wick candles, implement practical entry and exit strategies on Gate, and master risk management techniques. Read reversal signals through technical analysis and maximize potential profit opportunities.
Key Points
The "John Wick Candle" (long wick) is one of the most straightforward and powerful price action indicators, providing highly reliable signals for sharp market trend reversals. This candlestick pattern delivers crucial buy and sell signals to traders, and when leveraged effectively, it can significantly expand profit opportunities.
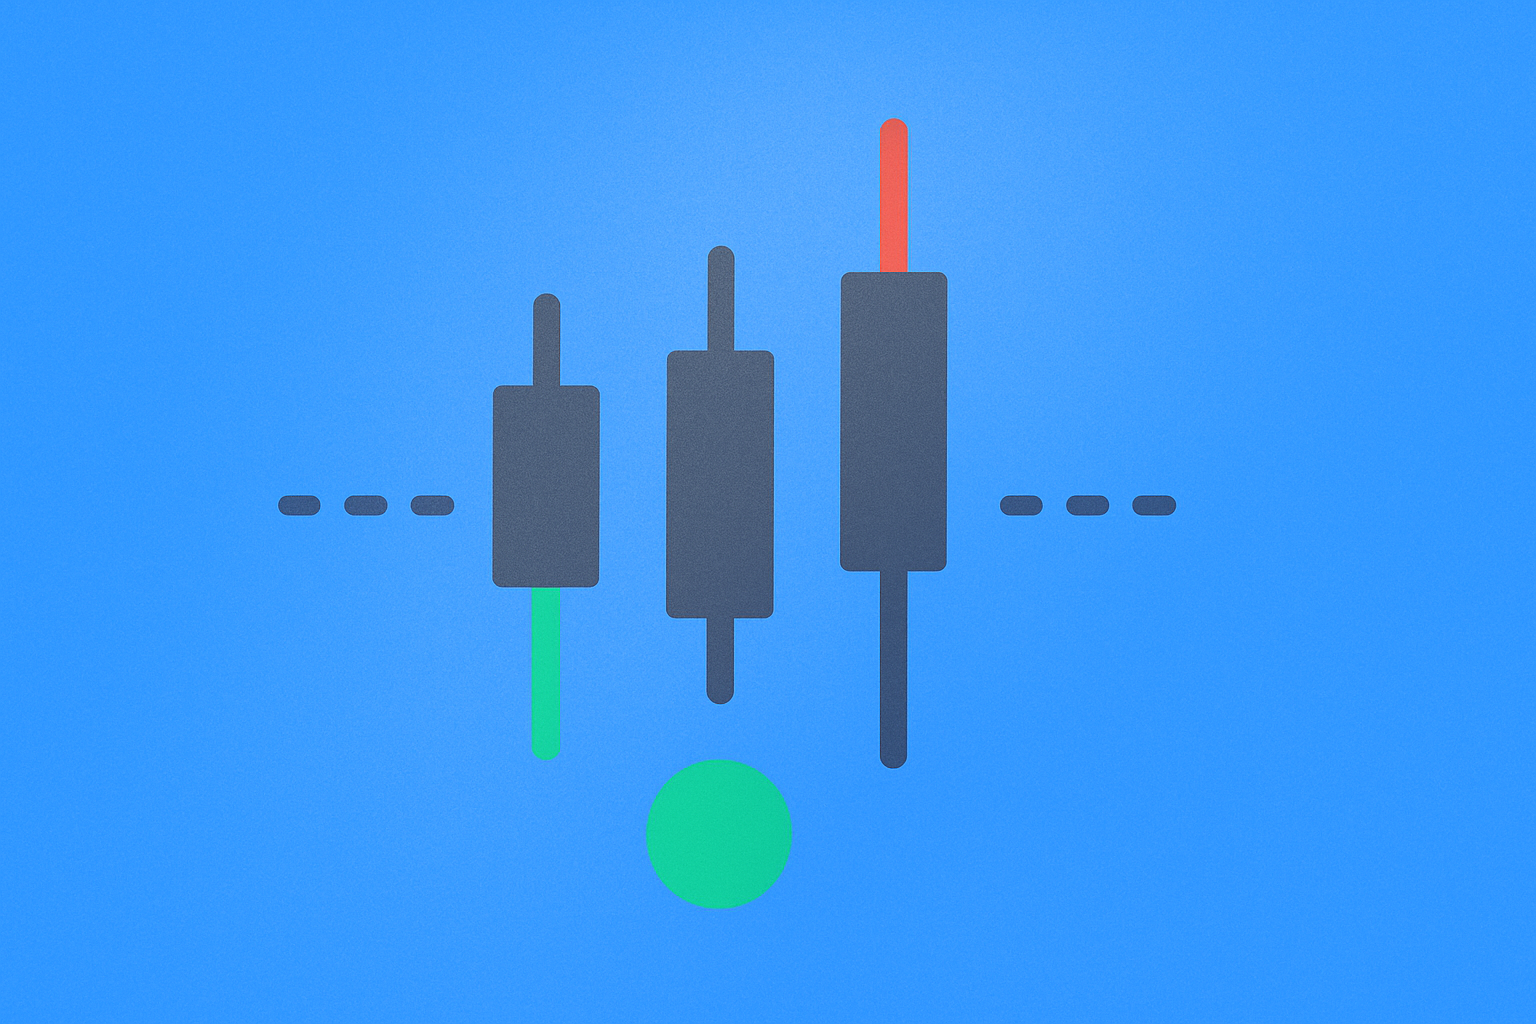
- Definition of Long Wick: Characterized by a wick exceeding 2–3 times the length of the candlestick body, this pattern serves as a visible signal of strong rejection from either buyers or sellers—a direct reflection of market psychology. The wick's length reveals intense competition among market participants.
- Bullish vs. Bearish Types: A bullish (lower wick) pattern at the end of a downtrend indicates a potential rebound, while a bearish (upper wick) pattern at the top of an uptrend warns of reversal risk. Each plays a vital role depending on market conditions.
- Importance of Confirmation: Standalone signals are frequently misinterpreted, so long wicks should be used alongside trend context, volume, subsequent price movement, and other technical indicators. Combining multiple signals results in more precise decision-making.
- Risk Management: Set stop-loss and take-profit levels carefully at the wick's tip or at key support/resistance zones. Robust risk management is critical for long-term success.
What Is a Long Wick Candle?
The long wick candlestick pattern is prized by traders as a reliable signal for trend reversals. Its defining feature is a distinctly long wick (shadow) extending from the candlestick body. Both the length and direction of the wick vividly highlight market sentiment and the balance of power.
Bullish Reversal Signal: Typically observed at the end of a downtrend, this candlestick—also known as a hammer—features a small body positioned near the top, minimal or no upper wick, and a pronounced lower wick. This structure indicates that while selling pressure pushed the price down sharply, buyers forcefully rallied, closing the session at a higher level. In essence, buyers repelled the sellers' final offensive, strongly signaling a potential trend reversal.
Bearish Reversal Signal: In contrast, the long wick pattern at the end of an uptrend—called a shooting star—has the body near the bottom, little or no lower wick, and a long upper wick. Buyers initially drive prices higher, but sellers seize control and push prices down by the close. This represents sellers' decisive rejection of buyers' upward attempt, signaling a likely shift to a downtrend.
Accurate identification and understanding of long wick candles help traders detect market turning points early and secure advantageous positions.
Why Is It Called the "John Wick Candle"?
Technical analysis is filled with complex terms like "Stochastic Oscillator" and "Bollinger Bands." In contrast, "John Wick Candle" is modern, memorable, and sparks curiosity. But it's more than a catchy moniker—it's a powerful metaphor for decisive, dramatic market action.
In the film series, Keanu Reeves portrays John Wick, the ultimate legendary assassin—known for unmatched efficiency, relentless resolve, and the ability to shift the tide instantly. These traits closely parallel the impact of the long wick candle in financial markets, explaining the nickname's popularity among traders.
1. Long Wick = Instrument of Rejection
The candle's most distinctive trait is its long wick—not just a line, but a "scar" from fierce market battles. Just as John Wick dispatches adversaries in a single strike, the wick represents one side's overwhelming victory over the other.
- Uptrend (Bearish John Wick/Shooting Star): The long upper wick shows bulls (buyers) aggressively pushing prices upward, only to be abruptly overpowered by strong selling (bears) that erases all bullish gains. This sudden reversal is reminiscent of John Wick's decisive action.
- Downtrend (Bullish John Wick/Hammer): The long lower wick tells the opposite story. Bears (sellers) dominate and trigger panic selling, until a powerful influx of buyers (bulls) reverses the price dramatically. This comeback echoes John Wick's ability to turn the tables in dire circumstances.
2. Small Body = Professional Efficiency
A typical John Wick Candle has a relatively small body compared to its wick. Despite wide price swings, the open-to-close range remains minimal—symbolizing professional precision.
This reflects not a drawn-out battle, but a swift, targeted "hit"—an assassin's work executed with maximum effect and minimal effort. The small body stands for the efficiency and accuracy of the reversal, mirroring both John Wick's style and the core of the long wick candlestick pattern.
3. Result = Decisive, High-Impact Reversal
After John Wick's intervention, the outcome is never in doubt—just like with this candle. It's a high-probability reversal signal. As John Wick's entrance in the film heralds dramatic shifts, the appearance of this candle signals a major market turning point.
Such events trigger powerful psychological shifts:
- Traders riding the trend are suddenly caught off guard, facing losses as prior confidence collapses instantly.
- Sideline traders see a clear sign of a turning tide—an opportune entry signal.
- The market witnesses overwhelming strength from the opposing side, with this shift shaping future trends.
Thus, "John Wick Candle" is more than a whimsical nickname—it's a metaphor that perfectly describes the pattern's essence: decisive, efficient market reversals.
Long Wick Candle Psychology
A single long wick candle reveals complex market psychology. Understanding this pattern goes beyond recognizing chart shapes—it's about interpreting the sentiment driving investor behavior.
- Bullish Long Wick (Long Lower Wick): Occurs during downtrends when sellers push prices sharply lower, only for buyers to recognize value and drive prices back up by the close—a clear sign of price rejection. This move embodies buyers' conviction that "prices won't fall further," and reflects calculated accumulation during panic selling.
- Bearish Long Wick (Long Upper Wick): In uptrends, buyers push prices higher but can't sustain momentum; sellers take control by the close. This reflects sellers' belief that "prices won't rise further," and often marks profit-taking or new short positions that sap buying strength.
- Spinning Top (Long Wicks on Both Sides): With long upper and lower wicks and a small body, this pattern signals market indecision—seen near turning points or periods of uncertainty. Buyers and sellers are evenly matched, with no clear leader.
Understanding these psychological dynamics enables traders to move beyond surface-level chart analysis and better anticipate collective market behavior.
Candlesticks with Long Upper and Lower Wicks
Spinning Top
Some candlesticks feature very long wicks at both ends. Unlike single long wicks, this pattern is called a "spinning top," typically marked by a small body and equal-length wicks. Its name derives from its resemblance to a spinning top toy.
The spinning top signals hesitation between buyers and sellers: long wicks on both sides mean volatility without directional conviction. Prices swing widely during the session but ultimately close near the open, showing that the market has not reached a consensus.
Usually, spinning tops point to market turning points or the start of range-bound conditions. After strong trends, a spinning top may indicate waning momentum, warning of reversal or sideways movement. Traders should wait for the next candle to clarify the trend or use additional indicators for careful judgment.
How to Identify Long Wick Candlesticks
Long wick candles are easy to spot due to their prominent wicks, but their presence alone doesn't guarantee reversal. Accurate identification and contextual analysis are essential for successful trading.
Bullish Long Wick Candlestick
After a downtrend (price drops from $37,000 to $29,500), a long wick candle appears—signaling a possible rebound and bottom. A long wick below the body shows sellers drove prices down, but buyers recovered them.
This pattern is effective because exhausted sellers at the end of the downtrend are fully countered by new buyers. Afterwards, price rebounds to $33,500, clearly indicating sentiment shifting from "sell" to "buy."
When identifying a bullish long wick, check:
- Was there a clear preceding downtrend?
- Is the lower wick more than 2–3 times the body length?
- Is volume increasing (suggesting buyer entry)?
- Did it occur near an important support level?
Bearish Long Wick Candlestick
After an uptrend (price rises from $31,700 to $32,900), a bearish long wick appears—signaling a potential top and reversal. A long wick above the body shows buyers pushed up but were defeated by sellers.
This pattern indicates profit-taking by buyers and new short positions opening. Afterwards, price drops to $31,100, showing sentiment shifting from "buy" to "sell."
When spotting a bearish long wick, check:
- Was there a clear preceding uptrend?
- Is the upper wick more than 2–3 times the body length?
- Is volume increasing (suggesting seller entry)?
- Did it occur near an important resistance level?
What Is "Long Enough"? Reference Rules
Many traders are unsure how to define a long wick. As a general guideline, a wick longer than 2–3 times the body is considered "noticeable." This ratio is a key gauge of rejection strength.
- Strong Signal: A wick longer than three times the body signals powerful rejection and a very high probability of reversal—the dominant side clearly overwhelms the other.
- Moderate Signal: A wick two to three times the body is a standard long wick; combine with other indicators for confirmation.
- Weak Signal: A wick only slightly longer than the body is less reliable—wait for additional confirmation.
The longer the wick, the more dramatic the price rejection and the greater the reversal potential. However, extremely long wicks may signal liquidity issues or abnormal market events such as flash crashes, so always consider the broader context.
Trading with the "John Wick (Long Wick)" Candle Strategy
Once you can identify the long wick pattern, consider entry/exit timing and set stop-loss and take-profit levels wisely. Crypto markets are volatile, so stops or take-profits placed too close to entry may be triggered prematurely. Proper placement is key to lasting success.
For long wick candles, stops are commonly placed near the closing price, which reflects the session's market consensus. Take-profit settings are more nuanced, varying for bullish/bearish types and based on resistance/support zones.
- Resistance: A price zone where uptrends typically stall—areas of strong selling pressure. For bullish long wicks, set take-profit near resistance, as reaching it often triggers profit-taking and a pullback.
- Support: Where downtrends typically stall—zones of strong buying pressure. For bearish long wicks, set take-profit near support, as reaching it often sparks buying and a rebound.
When to Enter After Spotting a Long Wick?
Don't enter immediately after spotting a long wick—premature entry increases the risk of false signals. Confirm the reversal with other technical indicators or oscillators before placing orders to reduce unnecessary losses.
Confirm using:
- Next Candle: For bullish, wait for the next candle to close green; for bearish, wait for a red close.
- Moving Average Cross: Confirm a golden cross (short-term MA crossing above long-term) or death cross (downward cross).
- RSI/MACD: Look for reversal signals from oscillators.
- Volume Increase: Confirm rising volume in the reversal direction.
Multi-timeframe analysis is also helpful—day traders may use 5- or 15-minute charts, but 1-hour or longer is typical. Confirm the trend on a higher timeframe, and time entries on a lower one for best results.
Beginners should start with simulations or small positions before moving to live trading. Practice and backtesting are essential before risking real capital.
Example Entry for Bullish Long Wick Trade
Follow these steps:
- Identify the Pattern: Spot a bullish long wick with a long lower wick at the end of a bear trend, confirming the wick is more than three times the body and near a key support level.
- Entry: Set a buy order near the closing price (around $29,500). Wait for the next candle to confirm as bullish before entering for higher certainty.
- Stop-Loss: Place a stop-loss at the wick's lowest point (around $28,900) to limit losses—if price drops below this, the reversal signal is invalid.
- Take-Profit: Set take-profit at the next resistance or recent swing high (e.g., $31,350), targeting a risk-reward ratio of at least 1:2.
This strategy aims for a $1,850 (6.3%) profit at a $600 (2%) risk, delivering approximately a 1:3 risk-reward ratio.
Example Exit for Bearish Long Wick Trade
Follow these steps:
- Identify the Pattern: Spot a bearish long wick (close around $32,950, long upper wick), confirming the wick is more than three times the body and near a key resistance level.
- Entry: Set a sell order near the closing price. Wait for the next candle to confirm as bearish before entering for higher certainty.
- Stop-Loss: Place a stop-loss at the wick's highest point (around $33,180) to limit losses—if price rises above this, the reversal signal is invalid.
- Take-Profit: Set take-profit at the support level (e.g., $31,350), aiming for a risk-reward ratio of at least 1:2.
This strategy aims for a $1,600 (4.9%) profit at a $230 (0.7%) risk, yielding approximately a 1:7 risk-reward ratio.
Limitations of the Long Wick Candle Strategy
Long wick candles offer valuable signals but aren't infallible. Be alert to these scenarios and always use additional analysis for prudent trading.
-
Low Liquidity & Irregular Markets: In thinly traded assets or during off-hours, large trades can create misleading long wicks. Be cautious in low-volume environments—especially late nights, early mornings, or with minor cryptocurrencies. Such signals may not reflect true market sentiment. Always check volume and liquidity.
-
Lack of Trend Context: Long wicks in range-bound or consolidating markets have much lower credibility. Prioritize them only after clear trends. Long wicks signal reversals, so they’re ineffective if there’s no trend to reverse. In sideways markets, they're likely just noise.
-
No Confirmation: Relying solely on long wicks is risky—wait for confirmation, such as higher highs/lows in the next candle. Entering without confirmation increases the risk of false signals. Waiting for one to two confirmation candles can greatly improve accuracy.
-
Major News Events: Long wicks around significant announcements may be noise—use caution. Economic releases, central bank decisions, or earnings can cause overreactions and reduce technical analysis reliability. In fundamentally driven markets, wick signals are less trustworthy.
-
Ignoring Other Indicators: Never rely solely on wick signals. If other indicators contradict the wick, act cautiously. For example, a bullish long wick with an overbought RSI or bearish MACD should prompt you to skip entry. Only trade when multiple signals point in the same direction.
-
Extreme Volatility: In highly volatile markets, frequent long wicks in both directions reduce reversal reliability. In unstable conditions, distinguishing genuine reversals is challenging—consider abstaining or apply stricter risk controls.
-
No Guarantee of Reversal: Long wicks indicate "potential" reversals, not certainty. Strong trends can persist despite a long wick. Sometimes, long wicks signal only brief corrections, not actual reversals.
Understanding and addressing these limitations will help you maximize the long wick candle strategy's effectiveness.
Conclusion
Accurate identification and disciplined application of long wick patterns can yield significant profits. Putting these concepts into practice will greatly enhance your trading skills.
Bullish long wicks typically appear at the end of downtrends, while bearish long wicks emerge at the top of uptrends. By mastering hammer and shooting star patterns and understanding the bull-bear dynamic, you can anticipate reversals more reliably. Decoding market psychology and executing timely entries and exits are crucial for success.
However, no strategy is risk-free. Long wicks merely "suggest a potential reversal," not a certainty. Markets are unpredictable, and surprises can occur at any time. Therefore, always implement rigorous risk management and cap your losses.
Practice with other trading tools and train thoroughly before committing real capital. Combining moving averages, RSI, MACD, Bollinger Bands, and other technical indicators will improve signal accuracy. Use demo accounts or small trades to develop your winning strategy before full-scale deployment.
Master the long wick candle strategy through ongoing learning and practice, and seize your opportunity for success in the market.
FAQ
What Are Long Candlestick Wicks? What's the Difference Between Upper and Lower Wicks?
Long candlestick wicks are thin lines representing price highs and lows. A long upper wick signals waning bullish momentum, while a long lower wick signals weakening bearish pressure. Upper wicks reflect selling force; lower wicks reflect buying force.
What Is the Trading Strategy for Long Wicks? How Do You Distinguish Buy and Sell Signals?
A lower wick (bullish type) signals a buying opportunity at the end of a downtrend; an upper wick (bearish type) signals a selling opportunity at the top of an uptrend. Use in conjunction with trend, volume, and other technical indicators, and set stop-losses near wick tips. Avoid relying on single signals—comprehensive analysis is key.
How Should You Manage Risk When Trading Long Wicks?
For long wick trades, place stop orders just above the upper wick for sells and just below the lower wick for buys. Combine with indicators like RSI and analyze across multiple timeframes. Always practice strict capital management and adjust position sizes appropriately.
What Are the Features of the John Wick Long Wick Analysis Method?
The John Wick long wick method analyzes candlestick wicks that indicate trend reversals. A long lower wick suggests a bullish reversal; a long upper wick indicates a potential bearish reversal. The pattern visualizes intense competition between buyers and sellers.
Are There Particular Market Conditions or Times When Long Wicks Appear More Frequently?
Long wicks tend to appear at the end of trends—lower wicks (bullish) during late downtrends, upper wicks (bearish) at the top of uptrends. They are most prominent during periods of high trading volume.
Is It Risky to Trade Solely on Long Wicks? How Should You Combine Them with Other Technical Indicators?
Relying only on long wicks is risky. While wicks indicate price fluctuation, they don't fully represent market trends. Combine with moving averages, RSI, and other indicators for more reliable signals. Always use several indicators for best results.
* The information is not intended to be and does not constitute financial advice or any other recommendation of any sort offered or endorsed by Gate.