This comprehensive analysis compares CoW Protocol (COW) and Solana (SOL) across critical investment dimensions, examining two distinctly positioned blockchain assets. COW, ranked 304th with $134.87M market cap, focuses on decentralized exchange optimization through batch auctions and MEV protection, while SOL, ranked 6th with $80.94B market cap, provides high-performance infrastructure supporting diverse ecosystem applications. The article evaluates historical price volatility, tokenomics mechanisms, institutional adoption patterns, and technical development trajectories to help investors understand their different characteristics. Through detailed price forecasts extending to 2031, investment strategy recommendations tailored to conservative and aggressive profiles, and comprehensive risk analysis, readers gain actionable insights for portfolio allocation decisions. Whether seeking DeFi trading protocol exposure or broad blockchain infrastructure participation, this comparison provides essential frameworks f
Introduction: Investment Comparison Between COW and SOL
In the cryptocurrency market, the comparison between CoW Protocol (COW) and Solana (SOL) represents a crucial topic for investors. These two assets exhibit significant differences in market capitalization ranking, application scenarios, and price performance, representing distinct positioning within the crypto asset landscape.
CoW Protocol (COW): Launched as a DeFi-focused protocol, it has gained recognition through its user-protective product suite including CoW Swap and CoW AMM, designed to enhance security and minimize concerns related to impermanent loss and front-running in decentralized finance transactions.
Solana (SOL): Founded in late 2017 by former engineers from Qualcomm, Intel, and Dropbox, it has established itself as a high-performance blockchain protocol, emphasizing scalability without compromising decentralization or security, becoming one of the widely-traded cryptocurrencies globally.
This article will provide a comprehensive analysis comparing COW vs SOL around historical price trends, supply mechanisms, institutional adoption, technical ecosystems, and future projections, attempting to address the question investors care about most:
"Which asset presents different investment characteristics in the current market?"
As of January 16, 2026, COW ranks 304th with a market capitalization of approximately $134.87 million and a circulating supply of 553.90 million tokens, while SOL ranks 6th with a market capitalization of approximately $80.94 billion and a circulating supply of 565.32 million tokens, demonstrating vastly different scales of market presence.
I. Historical Price Comparison and Current Market Status
Historical Price Trends of COW and SOL
-
2024: CoW Protocol (COW) experienced significant price volatility, reaching an all-time high of $1.2279 on December 25, 2024, driven by increased interest in DeFi user-protective products and batch auction mechanisms.
-
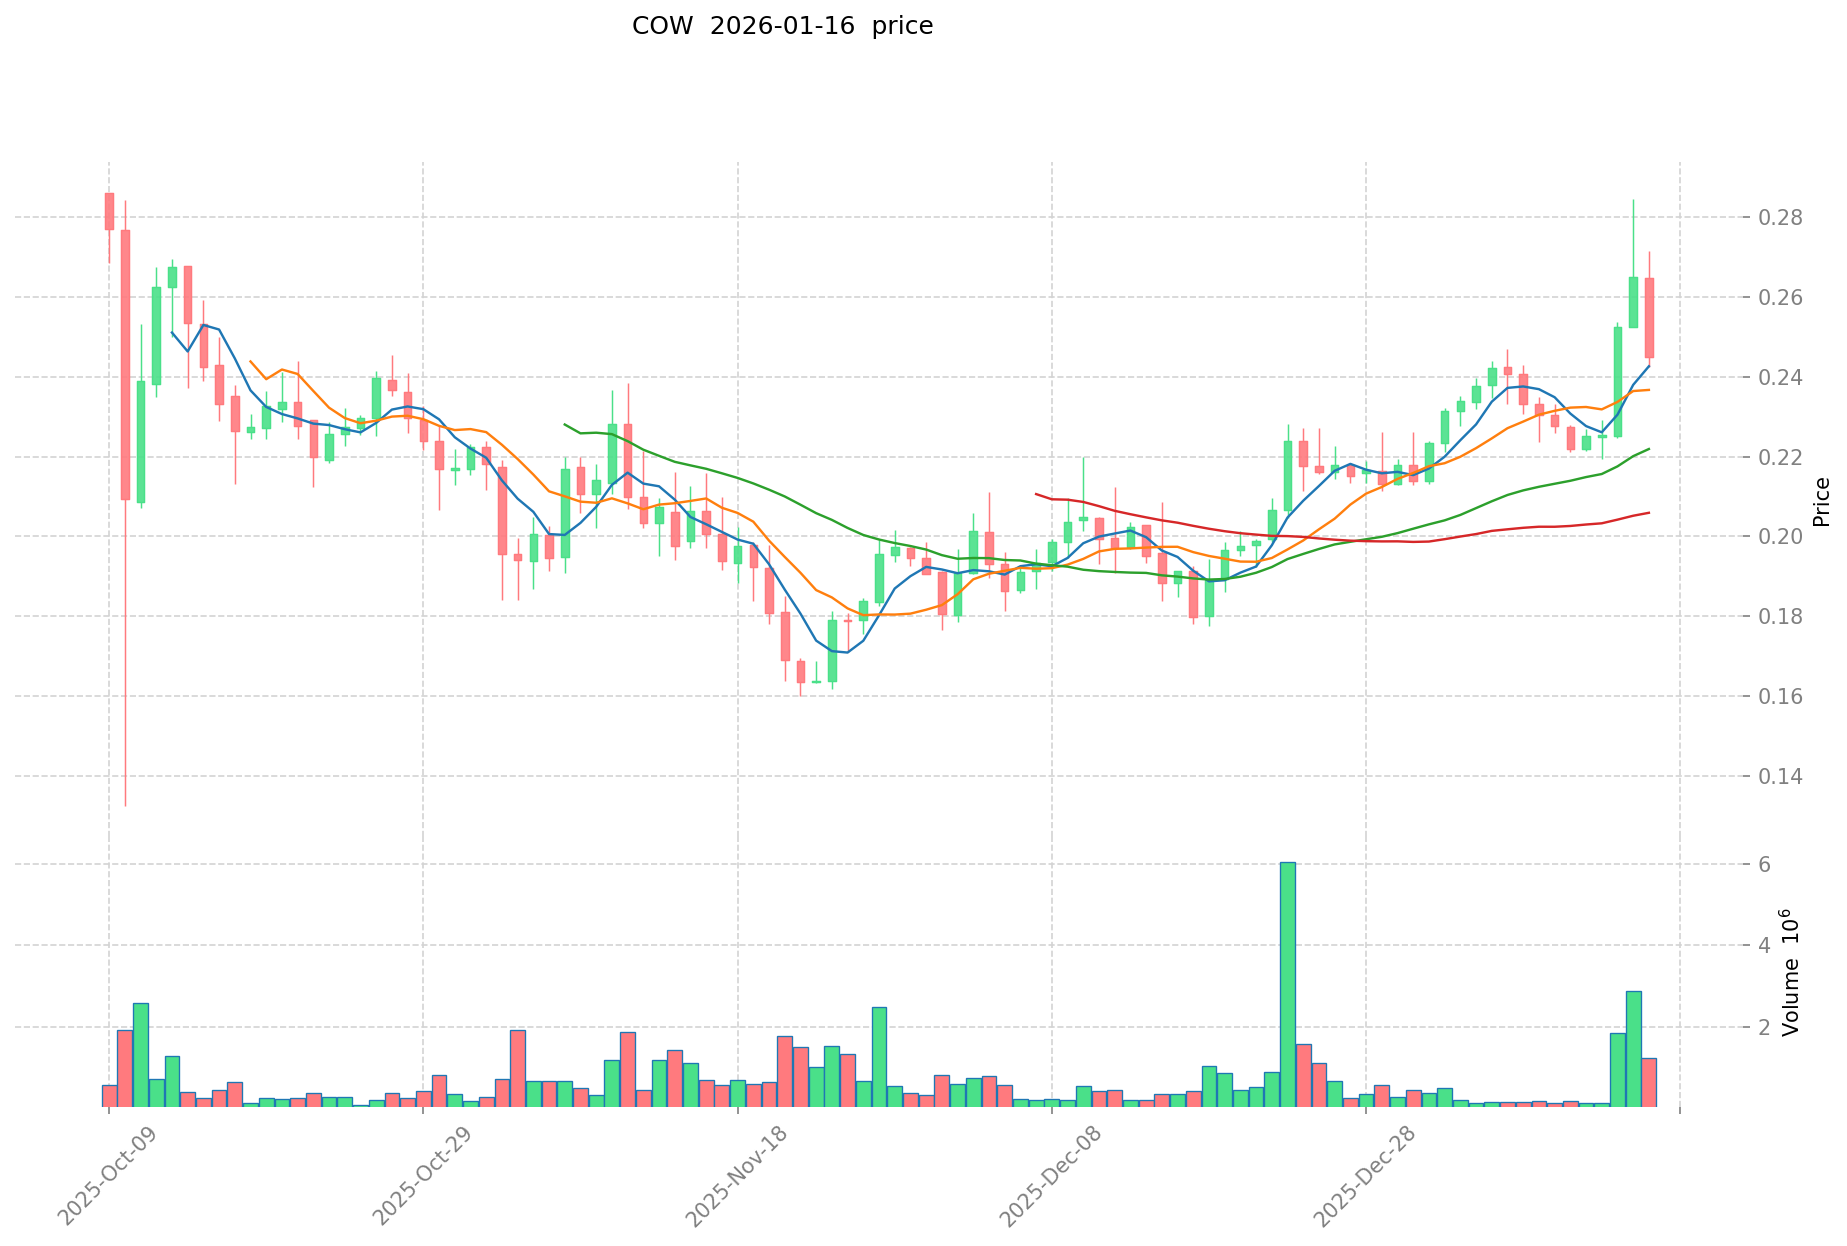
2025: Following its peak, COW entered a correction phase, declining to an all-time low of $0.1323 on October 10, 2025, reflecting broader market adjustments and reduced trading activity in the DeFi sector.
-
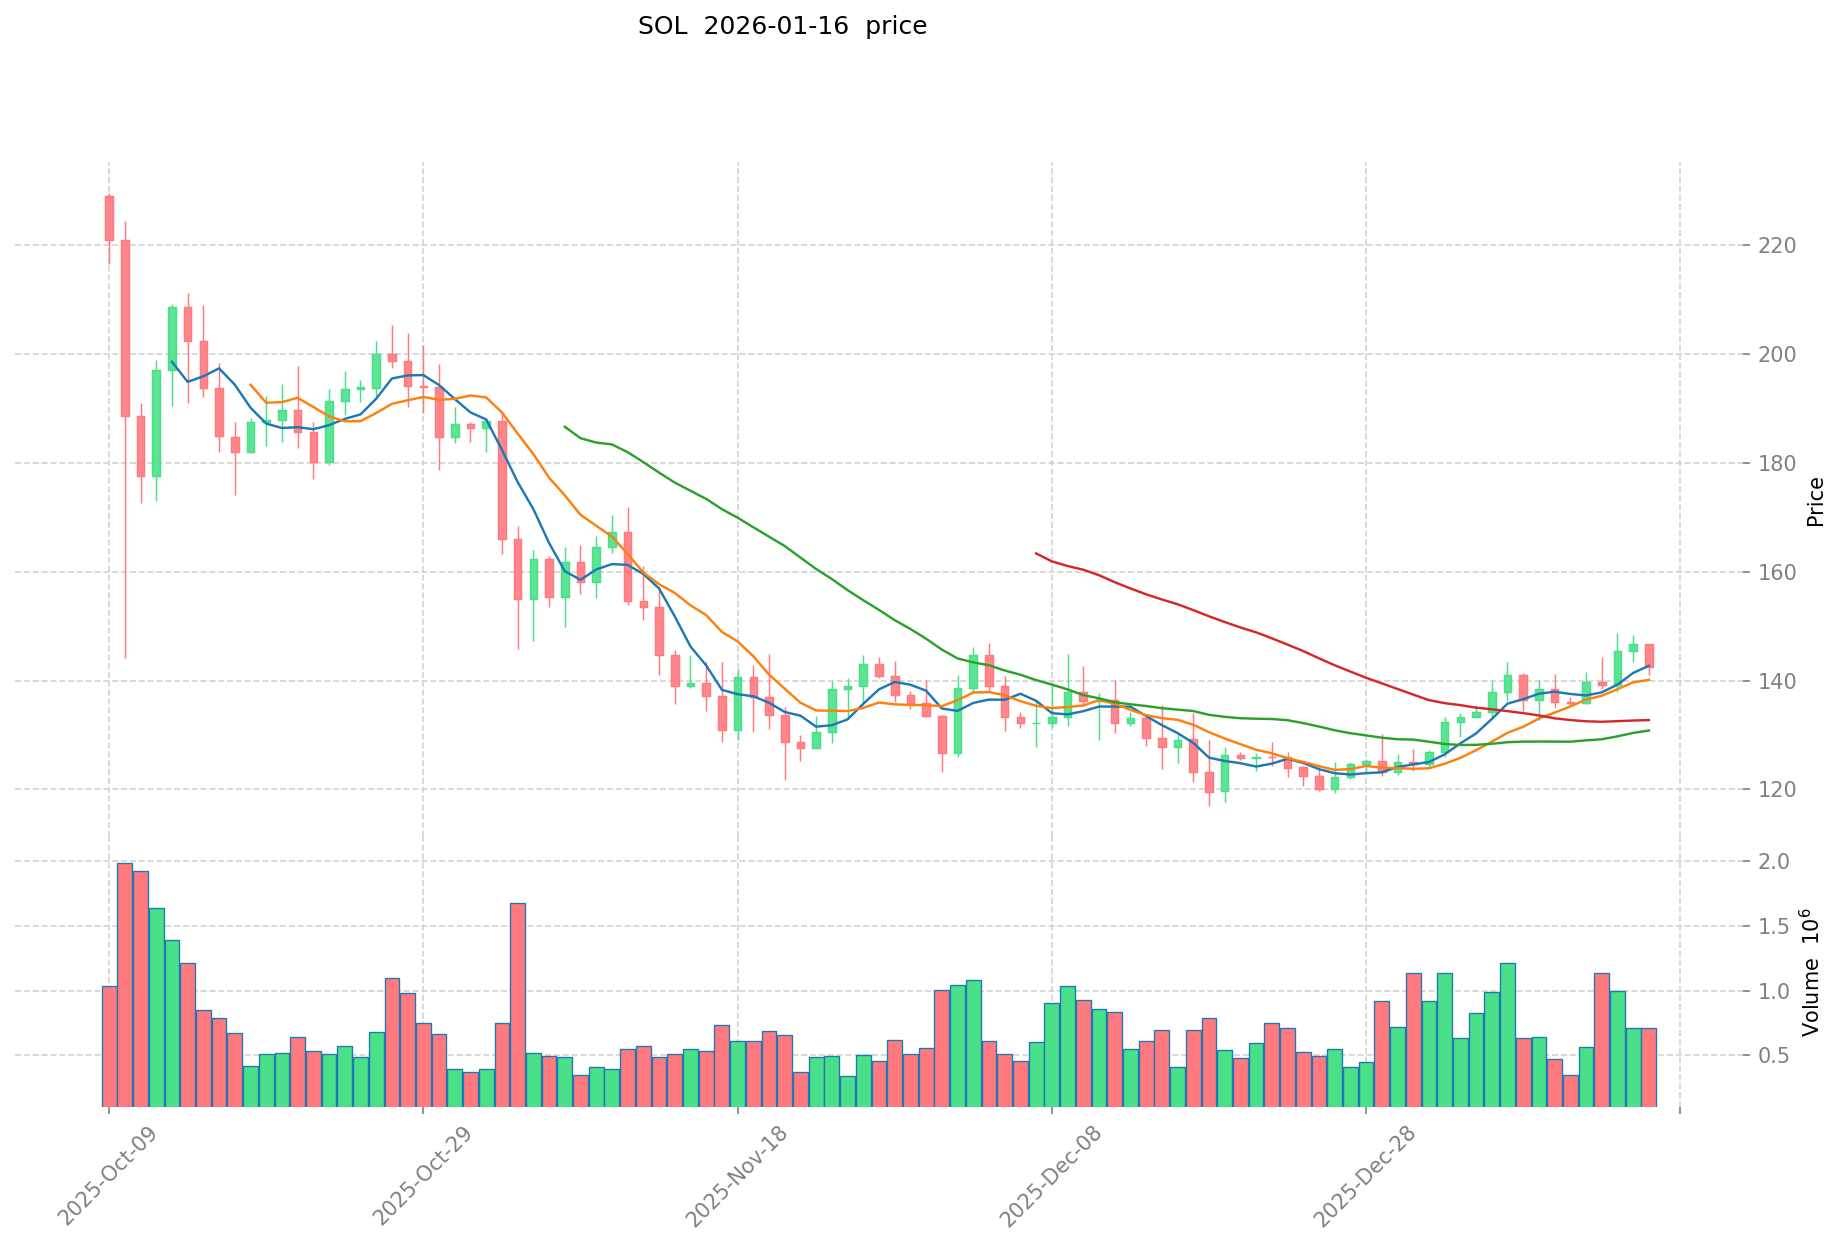
2020-2025: Solana (SOL) demonstrated substantial growth from its all-time low of $0.500801 on May 12, 2020, reaching an all-time high of $293.31 on January 19, 2025, supported by its high-performance blockchain infrastructure and expanding ecosystem of decentralized applications, DeFi platforms, and NFT marketplaces.
-
Comparative Analysis: During the 2024-2025 market cycle, COW exhibited greater volatility with a decline of approximately 89.2% from its peak to trough, while SOL demonstrated relative resilience, declining approximately 51.2% from its all-time high to current levels, reflecting its more established market position and broader adoption.
Current Market Status (January 16, 2026)
- COW Current Price: $0.2435
- SOL Current Price: $143.18
- 24-Hour Trading Volume: COW recorded $115,814.03 compared to SOL's substantially higher $82,569,434.38, indicating significantly different levels of market liquidity and trading activity.
- Market Sentiment Index (Fear & Greed Index): 49 (Neutral), suggesting balanced market conditions without extreme fear or greed among cryptocurrency investors.
Click to view real-time prices:
II. Core Factors Influencing COW vs SOL Investment Value
Supply Mechanism Comparison (Tokenomics)
-
COW: CoW Protocol employs a governance token model where COW serves as the native token for the decentralized trading protocol. The supply mechanism is designed to support protocol governance and incentivize liquidity providers within the CoW Swap ecosystem.
-
SOL: Solana operates with an inflationary supply model that incorporates a reducing inflation rate over time. The network's tokenomics include staking rewards for validators and delegators, with a current staking rate approaching 65% of circulating supply.
-
📌 Historical Pattern: Supply mechanisms have demonstrated cyclical influence on price movements, with staking-based models like SOL's showing correlation between staking ratios and price stability during market volatility periods.
Institutional Adoption and Market Applications
-
Institutional Holdings: SOL has attracted attention from various institutional participants, with increased validation activity and ecosystem development funding. COW's institutional presence remains more focused on DeFi-native protocols and liquidity aggregation services.
-
Enterprise Adoption: SOL demonstrates applications across DeFi infrastructure, payment solutions, and blockchain gaming ecosystems. COW focuses primarily on decentralized exchange aggregation through its CoW Swap platform, utilizing batch auction mechanisms for price discovery.
-
Policy Landscape: Regulatory approaches vary by jurisdiction, with both assets subject to evolving frameworks around decentralized protocols and trading mechanisms.
Technical Development and Ecosystem Building
-
SOL Technical Upgrades: Network stability has shown improvement, with no major outages reported since February 2024. The Nakamoto coefficient stands at 21, indicating meaningful decentralization levels. Future implementations like Firedancer independent client aim to enhance network robustness.
-
COW Technical Development: The protocol operates as a decentralized trading aggregator built on Ethereum and other EVM-compatible chains. The "Coincidence of Wants" (CoW) matching mechanism enables direct peer-to-peer trade settlement through batch auctions, reducing MEV exposure.
-
Ecosystem Comparison: SOL supports diverse applications including DeFi protocols (exemplified by Kamino Finance's lending platform), NFT marketplaces, and payment infrastructure. COW's ecosystem centers on optimizing decentralized exchange execution and liquidity aggregation within DeFi trading workflows.
Macroeconomic Environment and Market Cycles
-
Performance Under Inflation: Digital assets with established network utility and transaction volume may demonstrate varying responses to inflationary pressures. SOL's transaction throughput and low-cost structure position it for payment and settlement applications, while COW's value proposition ties to trading efficiency gains.
-
Macroeconomic Policy Impact: Interest rate adjustments and dollar index movements influence capital flows across cryptocurrency markets. Both assets remain subject to broader market sentiment shifts driven by monetary policy transitions.
-
Geopolitical Considerations: Cross-border transaction demand and international regulatory developments continue shaping adoption patterns for blockchain-based protocols and their associated tokens.
III. 2026-2031 Price Forecast: COW vs SOL
Short-term Forecast (2026)
- COW: Conservative scenario suggests a range of $0.13-$0.24 | Optimistic scenario indicates potential movement toward $0.34
- SOL: Conservative scenario suggests a range of $98.74-$143.10 | Optimistic scenario indicates potential movement toward $183.17
Medium-term Forecast (2028-2029)
- COW may enter a consolidation phase, with projected price range of $0.15-$0.44
- SOL may enter a growth phase, with projected price range of $137.36-$269.44
- Key drivers: institutional capital flows, ETF developments, ecosystem expansion
Long-term Forecast (2030-2031)
- COW: Baseline scenario $0.31-$0.44 | Optimistic scenario $0.51-$0.60
- SOL: Baseline scenario $162.75-$239.33 | Optimistic scenario $218.42-$342.25
View detailed price predictions for COW and SOL
Disclaimer
COW:
| Year |
Predicted High Price |
Predicted Average Price |
Predicted Low Price |
Price Change |
| 2026 |
0.342348 |
0.2428 |
0.128684 |
0 |
| 2027 |
0.31012844 |
0.292574 |
0.14921274 |
20 |
| 2028 |
0.316418781 |
0.30135122 |
0.2923106834 |
23 |
| 2029 |
0.441705550715 |
0.3088850005 |
0.176064450285 |
26 |
| 2030 |
0.506648622070125 |
0.3752952756075 |
0.341518700802825 |
54 |
| 2031 |
0.599721850420785 |
0.440971948838812 |
0.313090083675556 |
81 |
SOL:
| Year |
Predicted High Price |
Predicted Average Price |
Predicted Low Price |
Price Change |
| 2026 |
183.168 |
143.1 |
98.739 |
0 |
| 2027 |
213.70554 |
163.134 |
123.98184 |
13 |
| 2028 |
269.4402711 |
188.41977 |
177.1145838 |
31 |
| 2029 |
235.7979211665 |
228.93002055 |
137.35801233 |
59 |
| 2030 |
246.305809109745 |
232.36397085825 |
218.422132606755 |
62 |
| 2031 |
342.248892677116425 |
239.3348899839975 |
162.7477251891183 |
67 |
IV. Investment Strategy Comparison: COW vs SOL
Long-term vs Short-term Investment Strategies
-
COW: May appeal to investors focused on DeFi trading optimization and protocol governance participation. The asset's positioning within decentralized exchange infrastructure suggests alignment with investors seeking exposure to trading efficiency innovations and batch auction mechanisms.
-
SOL: May appeal to investors interested in high-performance blockchain infrastructure with diverse ecosystem applications spanning DeFi, NFT marketplaces, and payment solutions. The asset's established network utility and broader adoption patterns suggest alignment with investors seeking exposure to scalable blockchain platforms.
Risk Management and Asset Allocation
-
Conservative Investors: COW allocation: 15-25% | SOL allocation: 75-85% - This approach reflects SOL's larger market capitalization, higher liquidity levels, and more established institutional presence compared to COW's earlier-stage market positioning.
-
Aggressive Investors: COW allocation: 35-45% | SOL allocation: 55-65% - Higher allocation to COW reflects potential for volatility-driven returns characteristic of lower market cap assets, while maintaining SOL exposure for portfolio stability.
-
Hedging Tools: Stablecoin reserves for rebalancing opportunities, derivatives positions for downside protection, cross-asset correlation strategies incorporating both DeFi-focused and infrastructure-layer exposures.
V. Comparative Risk Analysis
Market Risk
-
COW: Lower liquidity levels with 24-hour trading volume of $115,814.03 present execution risk during position adjustments. Price volatility demonstrated by the 89.2% decline from peak to trough during 2024-2025 indicates sensitivity to DeFi sector sentiment shifts and trading volume fluctuations.
-
SOL: Despite higher liquidity with $82.57 million daily trading volume, the asset remains subject to broader cryptocurrency market cycles. The 51.2% correction from all-time high demonstrates susceptibility to sector-wide sentiment changes, though relative stability compared to smaller market cap assets reflects more diversified holder base.
Technical Risk
-
COW: Protocol dependency on underlying blockchain infrastructure introduces technical risk related to Ethereum and EVM-compatible chain performance. Smart contract vulnerabilities in batch auction mechanisms and trade settlement processes require ongoing security audits and protocol updates.
-
SOL: Network stability considerations remain relevant despite improvements since February 2024. Validator concentration metrics indicate ongoing decentralization development, with Nakamoto coefficient of 21 suggesting progress toward distributed validation. Implementation of independent clients like Firedancer aims to address single-client risk.
Regulatory Risk
- Global regulatory frameworks continue evolving around decentralized trading protocols and blockchain infrastructure. COW's focus on DEX aggregation and SOL's broader application scope face different regulatory considerations across jurisdictions. Classification questions around governance tokens and utility tokens remain subject to regulatory interpretation, with potential implications for exchange listings, institutional custody, and derivative product availability.
VI. Conclusion: Which Presents Different Investment Characteristics?
📌 Investment Value Summary:
-
COW Characteristics: Focused exposure to decentralized exchange innovation through batch auction mechanisms and MEV protection features. Lower market capitalization positioning with corresponding volatility profiles. Protocol governance participation opportunities within DeFi trading infrastructure.
-
SOL Characteristics: Established high-performance blockchain infrastructure with diverse ecosystem applications. Higher liquidity levels and broader institutional recognition. Network utility across multiple sectors including DeFi, NFTs, and payment solutions.
✅ Investment Considerations:
-
Newer Participants: May consider starting with more liquid assets demonstrating established market presence and broader ecosystem adoption. Position sizing aligned with individual risk tolerance and portfolio diversification objectives.
-
Experienced Participants: May evaluate allocation strategies incorporating both infrastructure-layer exposure and protocol-specific positioning based on sector thesis development and risk-adjusted return expectations. Consider rebalancing mechanisms responsive to volatility patterns.
-
Institutional Participants: May assess custody solutions, regulatory classification clarity, and liquidity depth requirements when evaluating position sizing. Consider correlation patterns with broader portfolio holdings and sector-specific risk factors.
⚠️ Risk Disclosure: Cryptocurrency markets demonstrate high volatility characteristics. This analysis does not constitute investment advice. Participants should conduct independent research and consult qualified advisors before making investment decisions.
VII. FAQ
Q1: What are the primary differences in market positioning between COW and SOL?
COW operates as a DeFi-focused trading protocol with a market cap of $134.87 million (ranked 304th), while SOL functions as a high-performance blockchain infrastructure platform with a market cap of $80.94 billion (ranked 6th). COW specializes in decentralized exchange aggregation through batch auction mechanisms and MEV protection, primarily serving traders seeking optimized execution within DeFi workflows. SOL provides broader infrastructure supporting diverse applications including DeFi protocols, NFT marketplaces, payment solutions, and blockchain gaming ecosystems. The 24-hour trading volume disparity—$115,814 for COW versus $82.57 million for SOL—reflects substantially different liquidity levels and market participation scales.
Q2: How do the volatility patterns differ between COW and SOL?
COW demonstrated approximately 89.2% decline from its December 2024 peak of $1.2279 to its October 2025 low of $0.1323, indicating higher volatility characteristic of lower market cap assets. SOL experienced a comparatively moderate 51.2% correction from its January 2025 all-time high of $293.31 to current levels around $143.18. This volatility differential stems from several factors: COW's lower liquidity levels create larger price impacts from trading activity, its concentration within the DeFi sector amplifies sensitivity to sector-specific sentiment shifts, and its smaller holder base results in less price stability during market adjustments. SOL's broader ecosystem adoption, higher trading volumes, and more diversified institutional participation contribute to relatively dampened volatility patterns.
Q3: What technical risks should investors consider for each asset?
For COW, primary technical risks include dependency on underlying Ethereum and EVM-compatible chain performance, potential smart contract vulnerabilities in batch auction and trade settlement mechanisms, and protocol security requiring ongoing audits. The CoW Protocol's "Coincidence of Wants" matching system introduces complexity in trade execution that necessitates continuous technical refinement. For SOL, despite network stability improvements since February 2024, validator concentration considerations remain relevant with a Nakamoto coefficient of 21 indicating ongoing decentralization progress. The network's historical outage events, though recently absent, highlight infrastructure robustness as a monitoring priority. Implementation of independent clients like Firedancer aims to mitigate single-client dependency risk and enhance network resilience.
Q4: How do institutional adoption patterns compare between COW and SOL?
SOL demonstrates broader institutional recognition with substantial validator participation, ecosystem development funding, and integration into various institutional DeFi infrastructure projects. The network's high transaction throughput and low-cost structure position it for institutional payment and settlement applications. COW's institutional presence focuses more narrowly on DeFi-native protocols and liquidity aggregation services, with adoption primarily among advanced traders and protocols seeking optimized trade execution. SOL's applications span enterprise-level implementations across multiple sectors, while COW's institutional use cases concentrate within decentralized trading workflows. This difference reflects their respective market capitalizations, with SOL's $80.94 billion valuation supporting deeper institutional engagement compared to COW's $134.87 million positioning.
Q5: What allocation strategies might suit different investor profiles?
Conservative investors might consider a 15-25% COW and 75-85% SOL allocation, reflecting SOL's larger market capitalization, higher liquidity, and more established market presence. This approach prioritizes stability through SOL's infrastructure positioning while maintaining limited exposure to COW's DeFi trading innovation potential. Aggressive investors might pursue a 35-45% COW and 55-65% SOL allocation, accepting higher volatility from increased COW positioning in exchange for potential returns characteristic of lower market cap assets. Both strategies assume cryptocurrency allocation as a subset of broader portfolio diversification. Rebalancing mechanisms responsive to volatility patterns, stablecoin reserves for opportunistic positioning, and correlation monitoring with broader portfolio holdings represent additional risk management considerations across profiles.
Q6: What are the key supply mechanism differences affecting long-term value?
COW employs a governance token model supporting protocol operations and incentivizing liquidity provision within the CoW Swap ecosystem. The tokenomics focus on protocol utility through trading fee distributions and governance participation rights. SOL operates with an inflationary supply model featuring a reducing inflation rate over time, currently maintaining approximately 65% staking participation among circulating supply. This staking mechanism creates token lockup dynamics that influence available supply during market cycles. Historical patterns suggest staking-based models like SOL's demonstrate correlation between staking ratios and price stability during volatility periods. The fundamental difference lies in SOL's network security model requiring staking participation versus COW's protocol governance and fee distribution orientation.
Q7: How do price forecasts reflect different growth trajectories through 2031?
Short-term 2026 forecasts suggest COW ranging between $0.13-$0.34 (conservative to optimistic scenarios) while SOL projects $98.74-$183.17, reflecting their current market positioning and volatility characteristics. Medium-term 2028-2029 projections indicate COW consolidation around $0.15-$0.44 compared to SOL's growth trajectory toward $137.36-$269.44, driven by institutional capital flows and ecosystem expansion. Long-term 2030-2031 baseline scenarios suggest COW reaching $0.31-$0.44 versus SOL's $162.75-$239.33, with optimistic scenarios projecting COW toward $0.51-$0.60 and SOL toward $218.42-$342.25. These forecasts reflect COW's potential for percentage gains from lower base valuations against SOL's absolute value appreciation from established infrastructure positioning, though all projections remain subject to significant market cycle uncertainty.
Q8: What regulatory considerations distinguish COW and SOL investments?
Both assets face evolving regulatory frameworks around decentralized protocols, with distinctions emerging from their functional differences. COW's focus on DEX aggregation and batch auction mechanisms raises regulatory questions around trading protocol classification, potential securities law implications for governance token distributions, and compliance requirements for decentralized trading infrastructure across jurisdictions. SOL's broader infrastructure positioning encounters regulatory considerations spanning multiple application domains—DeFi protocol oversight, NFT marketplace regulations, payment system compliance requirements, and blockchain gaming frameworks. Classification questions around governance tokens versus utility tokens remain subject to regulatory interpretation, affecting exchange listing availability, institutional custody solutions, and derivative product development. Jurisdictional variations create complexity, with participants needing to assess regulatory clarity within relevant operating territories when evaluating position sizing and custody arrangements.
* The information is not intended to be and does not constitute financial advice or any other recommendation of any sort offered or endorsed by Gate.