This comprehensive analysis compares CROSS and ARB as Ethereum scaling solutions with distinct market positioning. CROSS is a gaming-optimized Layer 1 blockchain launched in 2025, offering modular infrastructure for Web3 gaming with $46.35 million market cap. ARB, established in 2023, functions as an Optimistic Rollup Layer 2 solution with $1.10 billion market cap and stronger liquidity ($2.66M daily volume vs CROSS's $123.8K). The article examines historical price trends, tokenomics, institutional adoption, technology ecosystems, and risk factors to help investors determine optimal allocation strategies. ARB demonstrates established governance through Arbitrum DAO's $2 billion treasury, while CROSS targets emerging gaming infrastructure opportunities. Both tokens show growth potential through 2031, though ARB's higher liquidity and market position suit conservative investors, while CROSS appeals to aggressive investors seeking gaming sector exposure. Investment decisions require evaluating individual risk to
Introduction: Investment Comparison Between CROSS and ARB
In the cryptocurrency market, the comparison between CROSS and ARB has become a topic of interest for investors. Both assets show notable differences in market cap ranking, application scenarios, and price performance, representing distinct positioning in the crypto asset landscape.
CROSS: Launched in 2025, this gaming-optimized Layer 1 blockchain has gained market attention through its modular infrastructure for on-chain games, including SDKs, DEX, bridge, and wallet solutions. With full EVM compatibility, CROSS aims to bridge Web2-level performance with decentralized ownership in Web3 gaming.
Arbitrum (ARB): Introduced in 2023, ARB represents a technology suite designed to scale Ethereum. As an Optimistic Rollup protocol, it enables users to perform all Ethereum operations with reduced transaction costs and increased speed while maintaining Ethereum-level security.
This article will provide a comprehensive analysis of CROSS vs ARB investment value comparison, examining historical price trends, supply mechanisms, institutional adoption, technical ecosystems, and future projections. The analysis aims to address investors' most pressing question:
"Which is the better buy right now?"
As of January 19, 2026, CROSS holds a market ranking of 550 with a circulating supply of 350 million tokens and a market cap of approximately $46.35 million. In contrast, ARB ranks 77th with a circulating supply of 5.83 billion tokens and a market cap of approximately $1.10 billion. This fundamental difference in scale and market positioning sets the stage for a detailed comparative analysis.
I. Historical Price Comparison and Current Market Status
CROSS (Coin A) and ARB (Coin B) Historical Price Trends
-
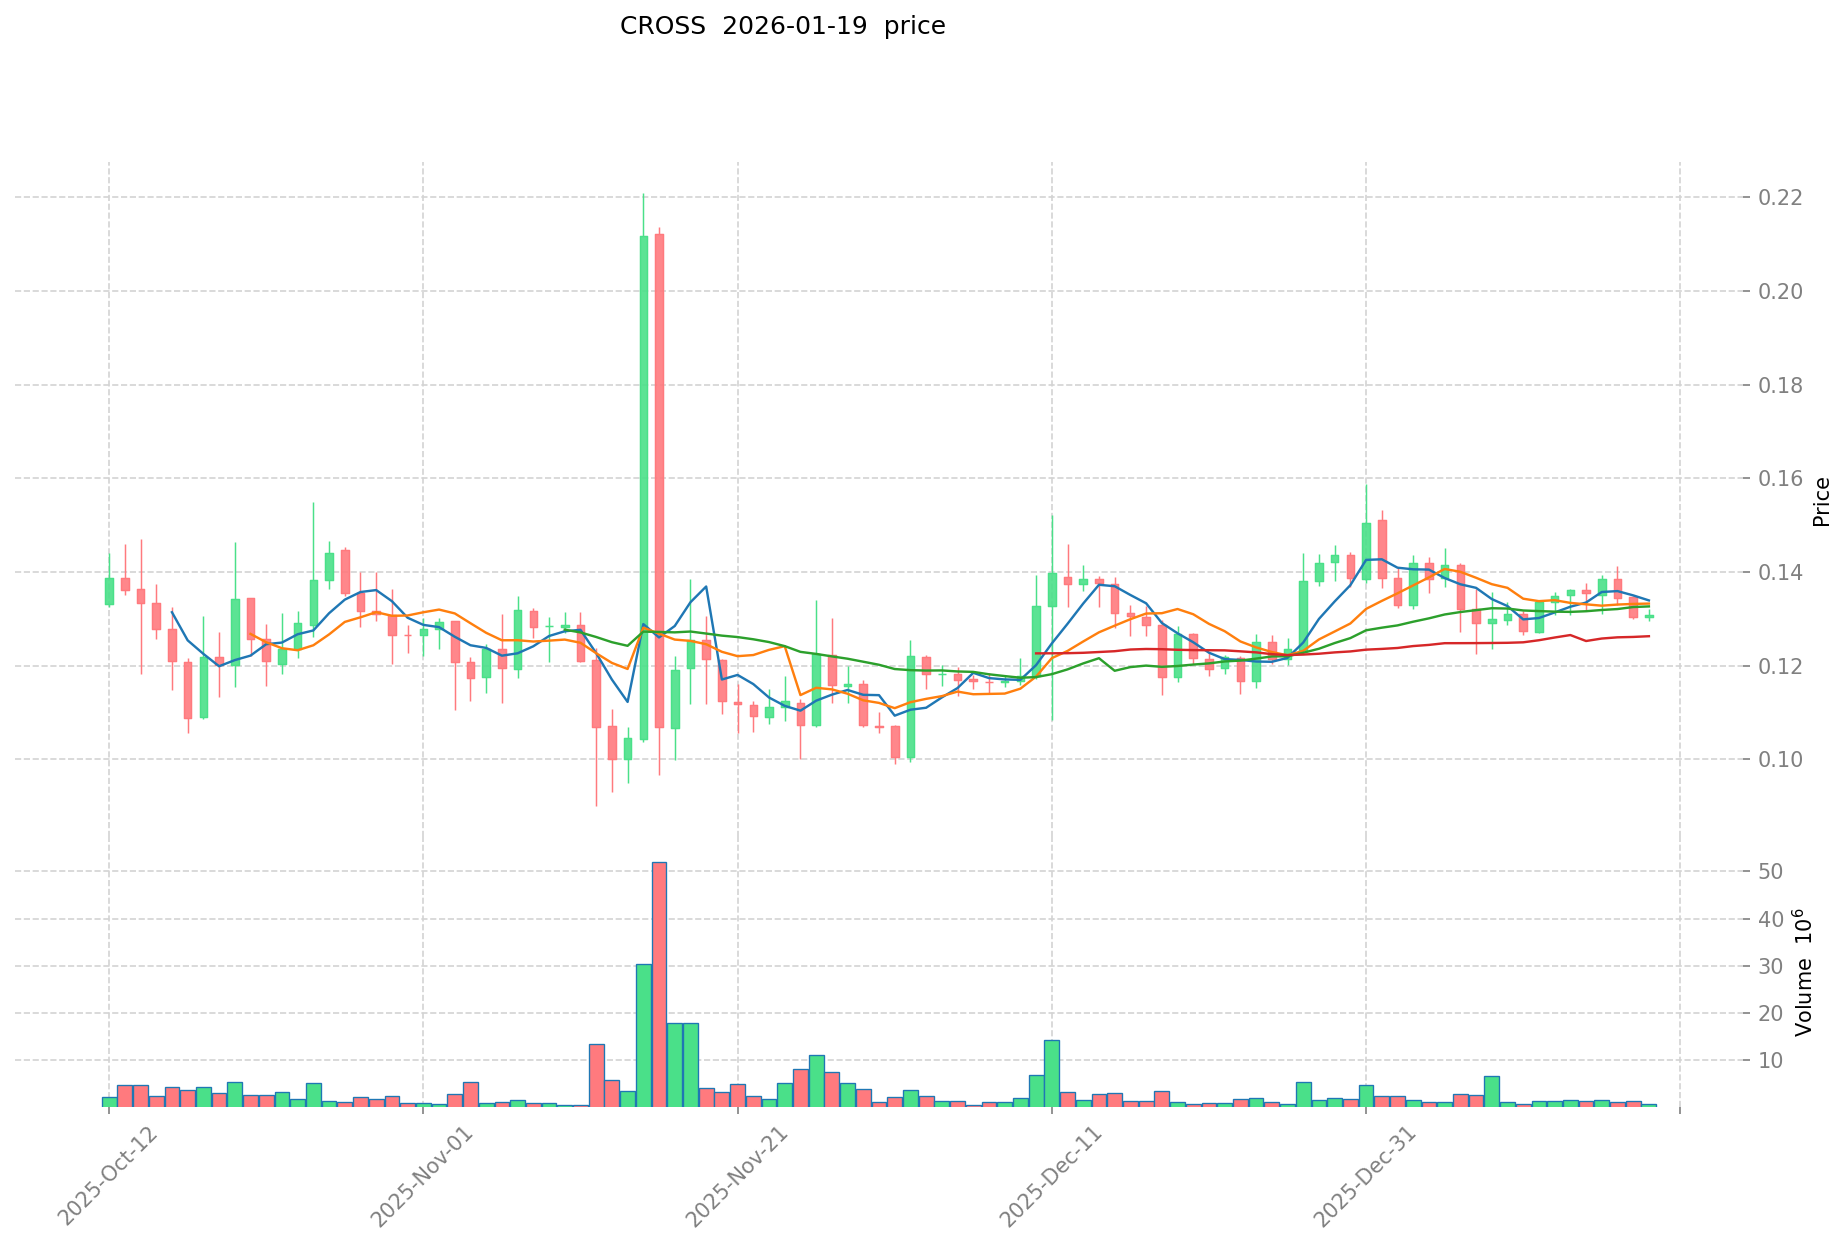
2025: CROSS experienced significant price movements following its mainnet launch and wallet release. The token showed considerable volatility, with prices fluctuating between $0.0458 (recorded on July 4, 2025) and $0.448 (recorded on July 18, 2025).
-
2024: ARB faced market challenges as regulatory uncertainty affected Layer 2 solutions. The token reached its peak at $2.39 on January 12, 2024, reflecting strong initial market enthusiasm for Ethereum scaling solutions.
-
Comparative Analysis: During the 2024-2025 market cycle, ARB declined from its high of $2.39 to approximately $0.1896 (as of January 19, 2026), representing a decline of approximately 92%. In contrast, CROSS, which launched later in 2025, demonstrated a different trajectory with its price moving from $0.0458 to a current level of $0.13243, showing a positive trend since its lower point.
Current Market Situation (2026-01-19)
- CROSS Current Price: $0.13243
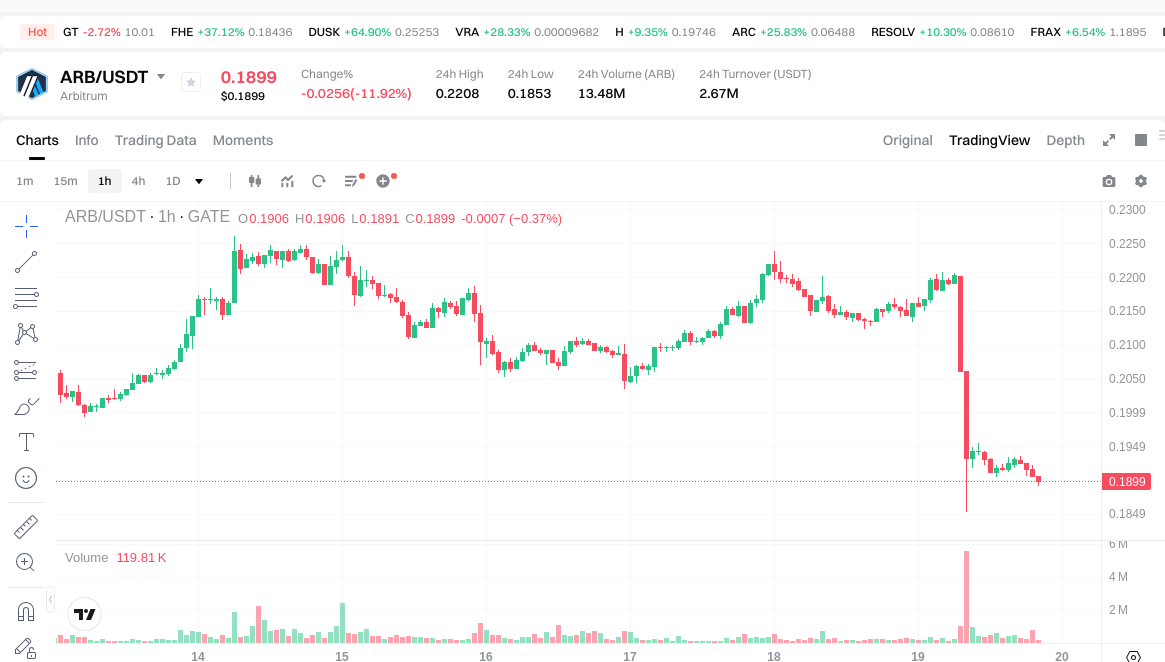
- ARB Current Price: $0.1896
- 24-Hour Trading Volume: CROSS recorded $123,828.12 compared to ARB's $2,658,448.71
- Market Sentiment Index (Fear & Greed Index): 44 (Fear)
View real-time prices:
II. Core Factors Affecting CROSS vs ARB Investment Value
Tokenomics Comparison
-
ARB: The token operates with a maximum supply cap of 10 billion ARB, with approximately 4.96 billion ARB currently in circulation. The governance token was airdropped in March 2023 to eligible users and ecosystem contributors, establishing a distribution model that balances community incentives with long-term ecosystem development.
-
CROSS: Information regarding the supply mechanism is not available in the provided materials.
-
📌 Historical Pattern: Supply mechanisms play a role in shaping price cycles through their impact on token availability and market dynamics.
Institutional Adoption and Market Application
-
Institutional Holdings: ARB has attracted attention through its position as a leading Ethereum Layer 2 scaling solution, with the Arbitrum DAO controlling treasury assets exceeding $2 billion, making it one of the most capitalized on-chain governance systems.
-
Enterprise Adoption: ARB's Optimistic Rollup technology enables lower fees and faster transaction throughput while maintaining compatibility with Ethereum smart contracts, supporting various applications in decentralized finance and blockchain infrastructure. The Arbitrum Orbit framework allows developers to launch their own rollups or application-specific chains secured by Arbitrum.
-
Regulatory Landscape: Different jurisdictions maintain varying approaches to Layer 2 solutions and governance tokens, with regulatory frameworks continuing to evolve.
Technology Development and Ecosystem Building
-
ARB Technology Upgrades: The network has implemented enhancements to improve Arbitrum's speed, utility, and scalability. The Stylus feature enables smart contract development in Rust, C, and C++ languages, expanding the developer base beyond Solidity specialists. These improvements aim to strengthen Arbitrum's competitive position among Layer 2 solutions.
-
CROSS Technology Development: Information regarding technology development is not available in the provided materials.
-
Ecosystem Comparison: ARB operates within the Ethereum ecosystem, supporting DeFi applications and smart contract deployments. The protocol utilizes Optimistic Rollup technology, which processes transactions off-chain while anchoring security to the Ethereum mainnet, significantly reducing gas costs while maintaining Ethereum-level security. ARB holders participate in governance through on-chain voting mechanisms for protocol upgrades, grant allocations, and network changes.
Macroeconomic Factors and Market Cycles
-
Inflationary Environment Performance: The relationship between Layer 2 tokens and inflation dynamics involves multiple factors including technology adoption rates and network utility.
-
Macroeconomic Monetary Policy: Interest rates, dollar index movements, and broader financial market conditions can influence cryptocurrency market sentiment and capital flows.
-
Geopolitical Factors: Cross-border transaction demand and international developments may affect the adoption and utilization of blockchain scaling solutions.
III. 2026-2031 Price Prediction: CROSS vs ARB
Short-term Prediction (2026)
- CROSS: Conservative $0.128-$0.132 | Optimistic $0.132-$0.148
- ARB: Conservative $0.123-$0.190 | Optimistic $0.190-$0.197
Medium-term Prediction (2028-2029)
- CROSS may enter a consolidation phase, with estimated price range of $0.094-$0.161 in 2028 and $0.132-$0.158 in 2029
- ARB may enter a growth phase, with estimated price range of $0.115-$0.240 in 2028 and $0.130-$0.256 in 2029
- Key drivers: institutional capital inflows, ETF developments, ecosystem expansion
Long-term Prediction (2030-2031)
- CROSS: Baseline scenario $0.105-$0.156 (2030), $0.135-$0.193 (2031) | Optimistic scenario $0.156-$0.229 (2030), $0.193-$0.231 (2031)
- ARB: Baseline scenario $0.162-$0.242 (2030), $0.226-$0.276 (2031) | Optimistic scenario $0.242-$0.310 (2030), $0.276-$0.284 (2031)
View detailed price predictions for CROSS and ARB
Disclaimer
CROSS:
| Year |
Predicted High Price |
Predicted Average Price |
Predicted Low Price |
Price Change |
| 2026 |
0.1480192 |
0.13216 |
0.1281952 |
0 |
| 2027 |
0.152697664 |
0.1400896 |
0.123278848 |
5 |
| 2028 |
0.1610329952 |
0.146393632 |
0.09369192448 |
10 |
| 2029 |
0.158324713008 |
0.1537133136 |
0.132193449696 |
16 |
| 2030 |
0.22934794955688 |
0.156019013304 |
0.10453273891368 |
17 |
| 2031 |
0.231220177716528 |
0.19268348143044 |
0.134878437001308 |
45 |
ARB:
| Year |
Predicted High Price |
Predicted Average Price |
Predicted Low Price |
Price Change |
| 2026 |
0.19708 |
0.1895 |
0.123175 |
0 |
| 2027 |
0.2396796 |
0.19329 |
0.1700952 |
1 |
| 2028 |
0.240298128 |
0.2164848 |
0.114736944 |
13 |
| 2029 |
0.25579843968 |
0.228391464 |
0.13018313448 |
19 |
| 2030 |
0.3098815383552 |
0.24209495184 |
0.1622036177328 |
27 |
| 2031 |
0.284267892450528 |
0.2759882450976 |
0.226310360980032 |
44 |
IV. Investment Strategy Comparison: CROSS vs ARB
Long-term vs Short-term Investment Strategies
-
CROSS: May appeal to investors interested in gaming-focused blockchain infrastructure and emerging Layer 1 solutions. The token's position in the gaming sector presents potential opportunities related to Web3 gaming adoption, though with considerations around market maturity and liquidity given its ranking at 550.
-
ARB: May appeal to investors seeking exposure to Ethereum Layer 2 scaling solutions with established market presence. With a market ranking of 77 and integration within the Ethereum ecosystem, ARB offers positioning in DeFi infrastructure and protocol governance participation.
Risk Management and Asset Allocation
-
Conservative Investors: A portfolio approach might consider 30% CROSS vs 70% ARB, reflecting ARB's higher liquidity ($2.66M daily volume vs $123.8K) and established market position.
-
Aggressive Investors: A portfolio approach might consider 50% CROSS vs 50% ARB, balancing ARB's infrastructure maturity with CROSS's potential in gaming-focused applications.
-
Hedging Tools: Portfolio management may incorporate stablecoin allocations for liquidity management, options strategies for downside protection, and cross-asset diversification to manage exposure across different blockchain sectors.
V. Potential Risk Comparison
Market Risks
-
CROSS: The token faces considerations related to lower trading volume ($123.8K daily) and market ranking (550), which may affect liquidity dynamics. Price movements between $0.0458 and $0.448 during 2025 indicate notable volatility patterns.
-
ARB: The token has experienced price movements from $2.39 (January 2024) to $0.1896 (January 2026). Market conditions affecting Layer 2 solutions and broader Ethereum ecosystem developments represent relevant factors.
Technical Risks
-
CROSS: Considerations include the development stage of gaming infrastructure components and network adoption rates among Web3 gaming applications.
-
ARB: Technical considerations involve the Optimistic Rollup model's fraud-proof mechanism, network congestion during high-activity periods, and competition from alternative Layer 2 solutions.
Regulatory Risks
- Different jurisdictions maintain varying approaches toward Layer 2 protocols and governance tokens. Regulatory frameworks continue to evolve regarding DeFi protocols, token classifications, and cross-border blockchain applications, with potential distinct implications for gaming-focused platforms versus Ethereum scaling infrastructure.
VI. Conclusion: Which Is the Better Buy?
📌 Investment Value Summary:
-
CROSS Characteristics: Focuses on gaming-optimized Layer 1 infrastructure with modular components including SDKs and wallet solutions. Market cap of approximately $46.35 million with EVM compatibility. Represents positioning in Web3 gaming sector development.
-
ARB Characteristics: Established Ethereum Layer 2 scaling solution with Optimistic Rollup technology. Market cap of approximately $1.10 billion, governance participation through Arbitrum DAO, and Stylus feature supporting multiple programming languages. Treasury assets exceeding $2 billion support ecosystem development.
✅ Investment Considerations:
-
New Investors: May consider starting with assets that have higher liquidity and established market presence. Understanding technical fundamentals and market dynamics across different blockchain sectors remains important before allocation decisions.
-
Experienced Investors: Portfolio construction might involve evaluating exposure across Layer 1 gaming infrastructure and Layer 2 scaling solutions based on individual risk parameters and market outlook for respective sectors.
-
Institutional Investors: Due diligence may encompass liquidity assessment, governance frameworks, technical roadmap evaluation, and regulatory compliance considerations across different jurisdictions.
⚠️ Risk Notice: Cryptocurrency markets demonstrate significant volatility. This analysis does not constitute investment advice. Conduct thorough research and consider consulting financial professionals before making investment decisions.
VII. FAQ
Q1: What are the main differences between CROSS and ARB in terms of their blockchain architecture?
CROSS is a gaming-optimized Layer 1 blockchain with full EVM compatibility, while ARB operates as a Layer 2 Optimistic Rollup solution built on top of Ethereum. CROSS focuses on providing modular infrastructure specifically designed for on-chain games, including SDKs, DEX, bridge, and wallet solutions. In contrast, ARB utilizes Optimistic Rollup technology to process transactions off-chain while anchoring security to the Ethereum mainnet, significantly reducing gas costs while maintaining Ethereum-level security. The fundamental distinction lies in their positioning: CROSS operates as an independent blockchain targeting the Web3 gaming sector, whereas ARB functions as a scaling solution extending Ethereum's capabilities.
Q2: Which token offers better liquidity for trading?
ARB demonstrates significantly higher liquidity with a 24-hour trading volume of $2,658,448.71 compared to CROSS's $123,828.12 as of January 19, 2026. This substantial difference—approximately 21 times higher trading volume for ARB—indicates that ARB provides more favorable conditions for entering and exiting positions with minimal price impact. Additionally, ARB's market ranking of 77 versus CROSS's ranking of 550, combined with ARB's market cap of $1.10 billion compared to CROSS's $46.35 million, further confirms ARB's superior liquidity profile. For investors prioritizing trade execution efficiency and reduced slippage risk, ARB presents more established market depth.
Q3: How do the price predictions compare for CROSS and ARB through 2031?
Both tokens show projected growth through 2031, though with different trajectories. For 2026, CROSS is estimated at $0.128-$0.148 (optimistic scenario) while ARB ranges from $0.190-$0.197. By 2031, CROSS's baseline scenario projects $0.135-$0.193 with an optimistic scenario of $0.193-$0.231, representing a potential 45% increase from 2026 levels. ARB's 2031 baseline scenario estimates $0.226-$0.276 with an optimistic range of $0.276-$0.284, indicating a potential 44% increase from 2026 levels. While both tokens show similar percentage growth potential, ARB maintains a higher absolute price point throughout the projection period, reflecting its more established market position and larger ecosystem.
Q4: What governance rights do token holders receive?
ARB token holders participate directly in governance through on-chain voting mechanisms for protocol upgrades, grant allocations, and network changes via the Arbitrum DAO, which controls treasury assets exceeding $2 billion. This governance structure represents one of the most capitalized on-chain governance systems in the cryptocurrency space. Token holders can propose and vote on changes affecting the Arbitrum protocol's development direction and resource allocation. The provided materials do not specify governance rights for CROSS token holders. For investors prioritizing governance participation and influence over protocol development, ARB offers a well-established framework with substantial treasury resources under DAO control.
Q5: What are the key risk factors specific to each token?
CROSS faces considerations related to lower trading volume and market ranking, which may affect liquidity dynamics and price stability. The token's position in the emerging Web3 gaming sector presents adoption-related uncertainties, and its price volatility between $0.0458 and $0.448 during 2025 indicates significant short-term fluctuation potential. ARB's risks include exposure to Ethereum ecosystem developments, competition from alternative Layer 2 solutions, and technical considerations involving the Optimistic Rollup fraud-proof mechanism. Both tokens face regulatory uncertainties as different jurisdictions maintain varying approaches toward Layer 2 protocols, governance tokens, and gaming-focused platforms, with regulatory frameworks continuing to evolve regarding DeFi protocols and token classifications.
Q6: Which token is more suitable for conservative versus aggressive investors?
Conservative investors might consider a portfolio allocation favoring ARB (70%) over CROSS (30%), reflecting ARB's higher liquidity, established market presence, and integration within the mature Ethereum ecosystem. This approach prioritizes stability through ARB's market ranking of 77 and daily trading volume exceeding $2.6 million. Aggressive investors seeking higher growth potential might balance exposure equally (50% CROSS, 50% ARB), combining ARB's infrastructure maturity with CROSS's positioning in the emerging Web3 gaming sector. The conservative approach emphasizes risk mitigation through established market positioning, while the aggressive strategy accepts higher volatility in exchange for exposure to gaming-focused blockchain infrastructure development.
Q7: How do the technology development roadmaps differ between CROSS and ARB?
ARB has implemented significant technology enhancements including the Stylus feature, which enables smart contract development in Rust, C, and C++ languages beyond Solidity, expanding the developer base and potential use cases. The Arbitrum Orbit framework allows developers to launch their own rollups or application-specific chains secured by Arbitrum, creating an ecosystem of interconnected chains. These developments aim to strengthen Arbitrum's competitive position among Layer 2 solutions through improved speed, utility, and scalability. CROSS focuses on gaming-optimized infrastructure with modular components including SDKs, DEX, bridge, and wallet solutions specifically designed for on-chain games, though detailed technology roadmap information is not available in the provided materials. The fundamental difference lies in ARB's focus on general-purpose Ethereum scaling versus CROSS's specialized gaming infrastructure approach.
Q8: What institutional adoption differences exist between CROSS and ARB?
ARB demonstrates substantial institutional framework through the Arbitrum DAO, which controls treasury assets exceeding $2 billion, positioning it as one of the most capitalized on-chain governance systems. This institutional infrastructure supports ecosystem development, grant programs, and protocol upgrades. ARB's position as a leading Ethereum Layer 2 scaling solution has attracted attention through its Optimistic Rollup technology, which enables lower fees and faster transaction throughput while maintaining Ethereum smart contract compatibility. The Arbitrum ecosystem supports various applications in decentralized finance and blockchain infrastructure. Information regarding institutional adoption specific to CROSS is not available in the provided materials. For investors prioritizing institutional backing and established ecosystem support, ARB presents a more developed framework with significant treasury resources and governance infrastructure.
* The information is not intended to be and does not constitute financial advice or any other recommendation of any sort offered or endorsed by Gate.