This comprehensive analysis compares CRV and ETH investment potential through multiple dimensions including historical price trends, tokenomics, institutional adoption, and market positioning. CRV, a specialized DeFi governance token focused on stablecoin trading via Curve Finance, currently trades at $0.4336 with lower liquidity, while ETH, a foundational blockchain infrastructure asset, trades at $3,285.17 with significantly higher trading volume ($831M vs $1.6M). The article examines distinct risk-return profiles: ETH offers broader ecosystem exposure and regulatory clarity suitable for conservative investors, while CRV provides concentrated DeFi yield opportunities for experienced traders. Long-term price forecasts project ETH reaching $4,725-$6,376 by 2030-2031 versus CRV's $0.41-$0.65 range. Detailed risk analysis, portfolio allocation strategies, and investment considerations address different investor profiles from novices to institutions, emphasizing that cryptocurrency markets carry extreme volatili
Introduction: Investment Comparison Between CRV and ETH
In the cryptocurrency market, the comparison between CRV vs ETH has consistently been a topic that investors cannot overlook. The two differ significantly in market capitalization ranking, application scenarios, and price performance, representing distinct positioning within the crypto asset landscape.
CRV (Curve DAO Token): Launched in January 2020, it has gained market recognition through its positioning as a decentralized exchange protocol optimized for stablecoin trading with low slippage and fees.
ETH (Ethereum): Since its inception in 2015, it has been regarded as the foundational platform for decentralized applications and smart contracts, ranking as one of the cryptocurrencies with substantial global trading volume and market capitalization.
This article will comprehensively analyze the investment value comparison of CRV vs ETH across historical price trends, supply mechanisms, institutional adoption, technical ecosystem, and future forecasts, attempting to address the question that concerns investors most:
"Which is the better buy right now?"
I. Historical Price Comparison and Current Market Status
Historical Price Trends of CRV (Coin A) and ETH (Coin B)
- 2020: CRV was launched in January 2020 as part of the Curve Finance protocol. The token experienced its historical high price of $15.37 on August 14, 2020, shortly after its initial distribution.
- 2024: CRV reached its historical low price of $0.180354 on August 5, 2024, reflecting a period of market correction.
- 2015: ETH was launched in July 2015 with an initial price around $0.31. The token recorded its historical low of $0.432979 on October 20, 2015.
- 2025: ETH achieved its historical high price of $4,946.05 on August 25, 2025, driven by network upgrades and growing adoption of decentralized applications.
- Comparative Analysis: During the 2024 market cycle, CRV declined from its historical high of $15.37 to a low of $0.180354, representing a substantial price contraction. In contrast, ETH demonstrated resilience across market cycles, maintaining a broader price range between $0.432979 and $4,946.05, with its recent peak occurring in 2025.
Current Market Situation (2026-01-14)
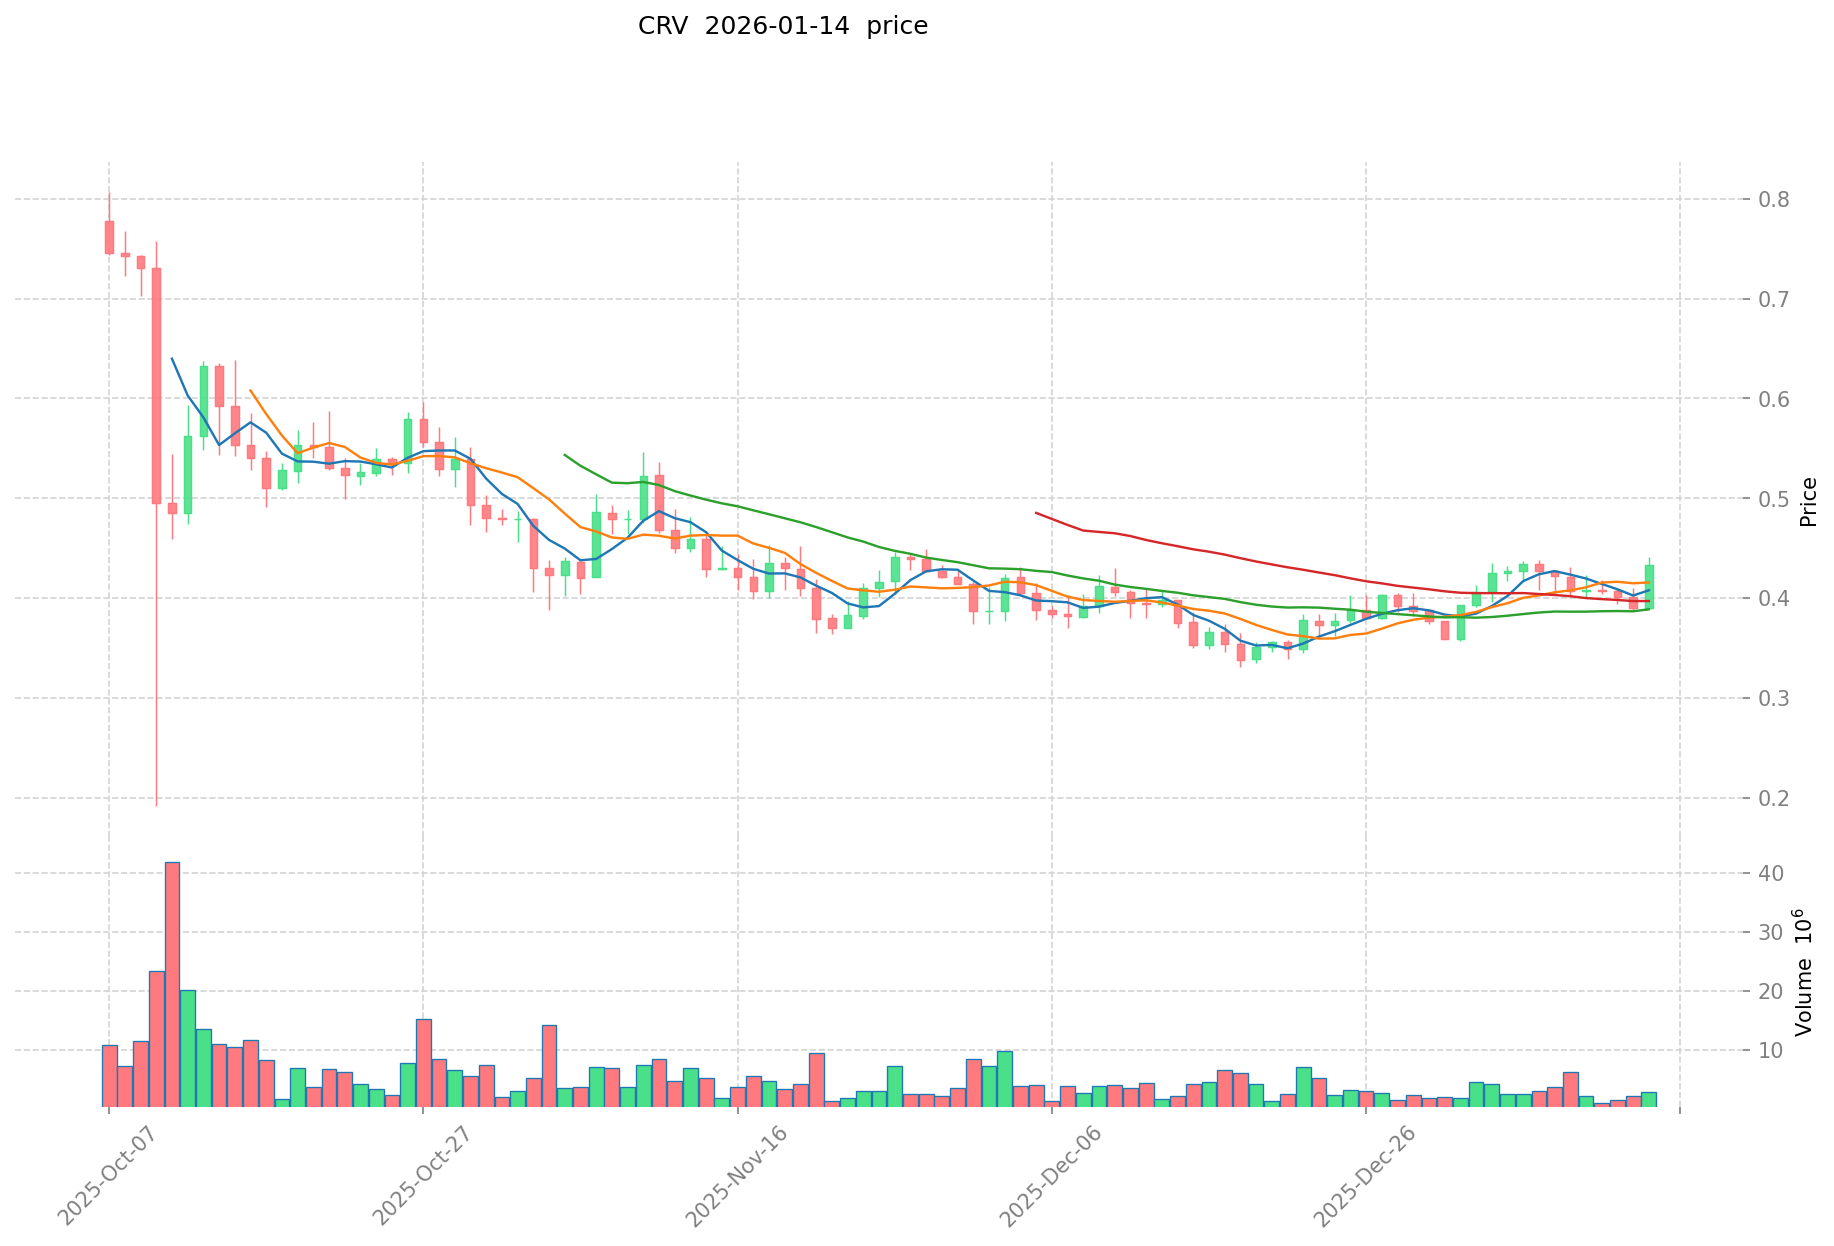
- CRV Current Price: $0.4336
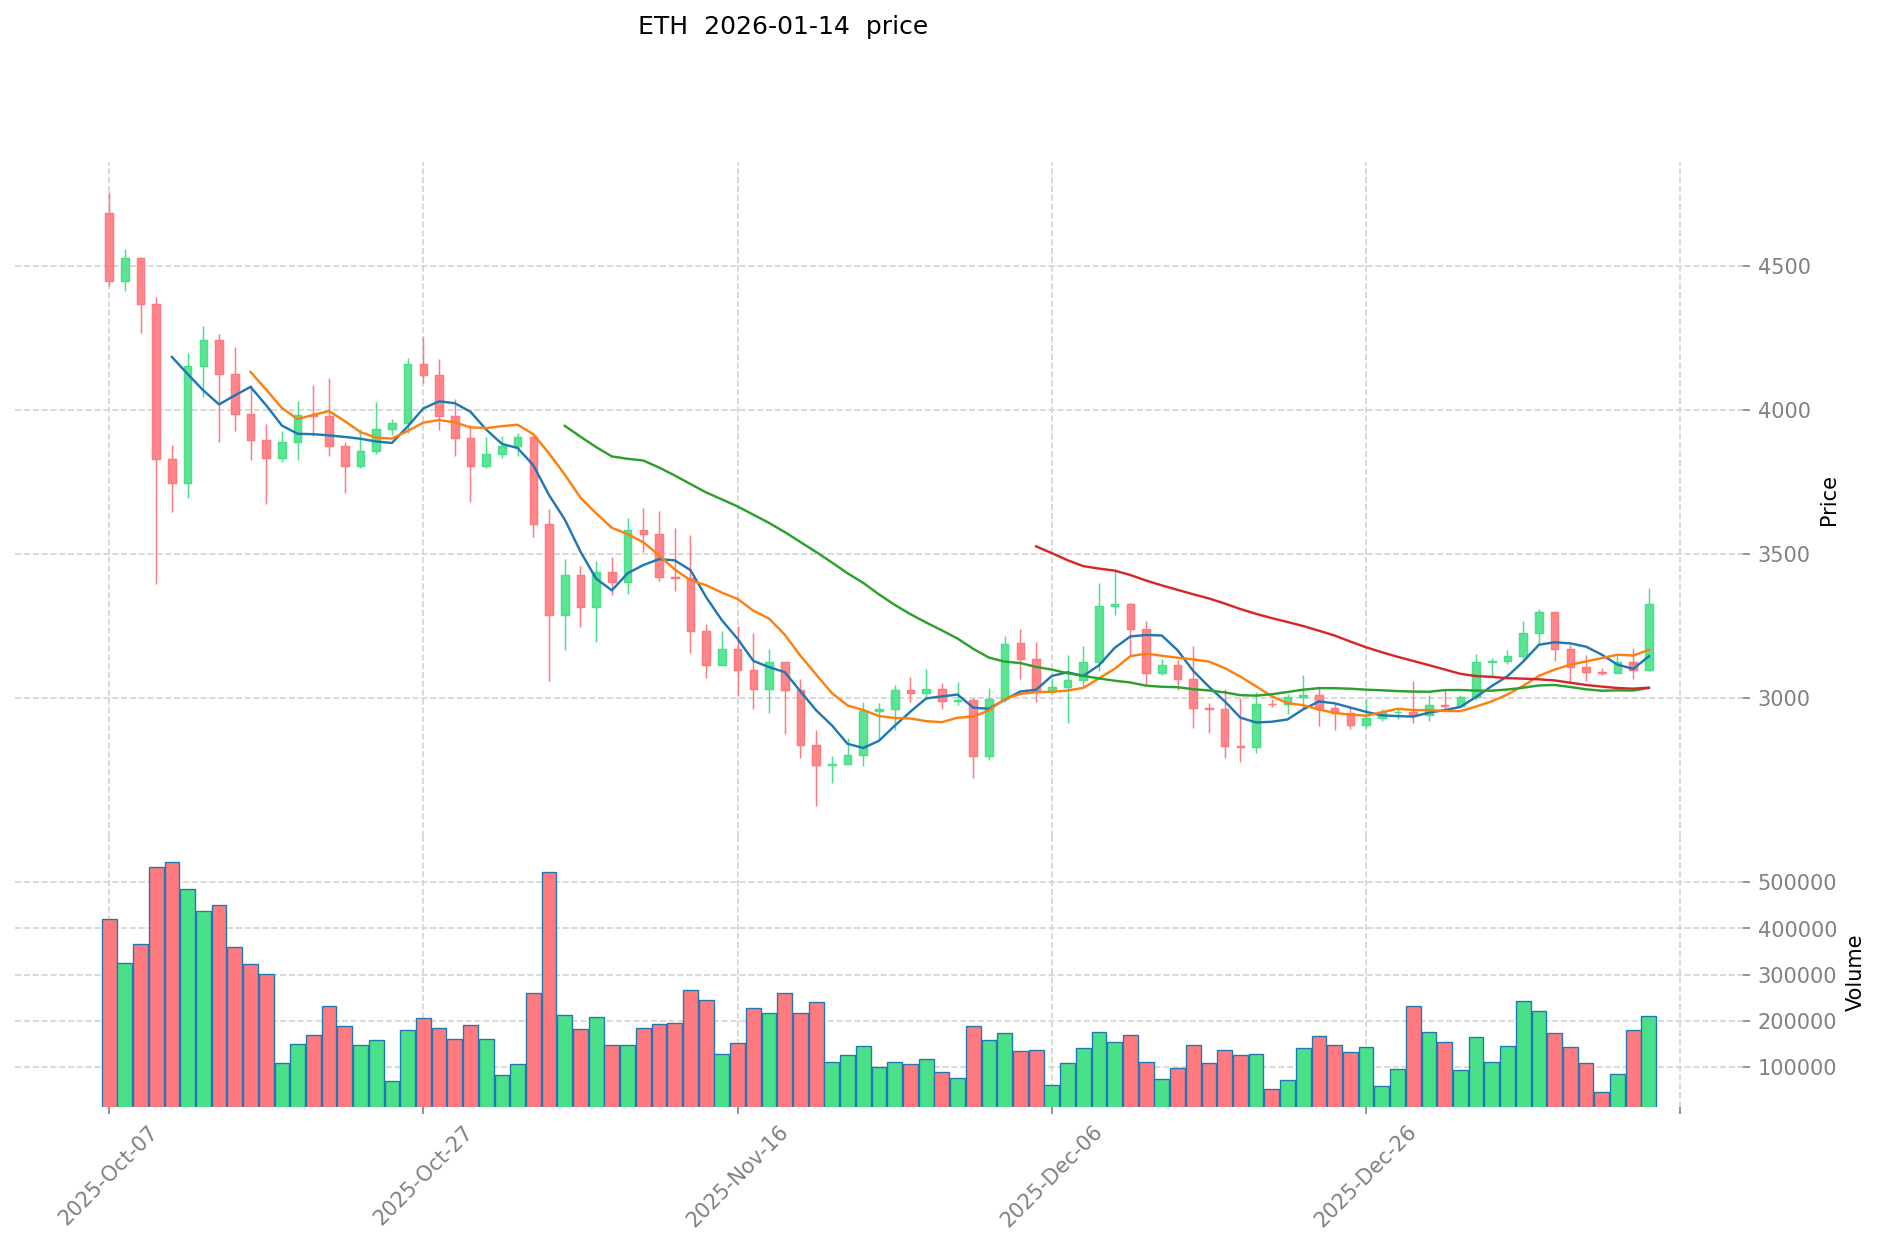
- ETH Current Price: $3,285.17
- 24-Hour Trading Volume: CRV recorded $1,630,093.05, while ETH achieved $831,055,753.83
- Market Sentiment Index (Fear & Greed Index): 48 (Neutral)
View real-time prices:
II. Core Factors Influencing CRV vs ETH Investment Value
Supply Mechanism Comparison (Tokenomics)
-
CRV: Maximum supply capped at 3,030,303,031 tokens, with supply changes historically influencing price movements. The veCRV (vote-escrowed CRV) mechanism requires users to lock CRV tokens to capture protocol value and participate in governance, creating a supply constraint dynamic.
-
ETH: Features a deflationary mechanism post-EIP-1559 implementation, where a portion of transaction fees is burned, potentially reducing circulating supply over time. The token economics shifted from inflationary to potentially deflationary, depending on network activity levels.
-
📌 Historical Pattern: Supply mechanisms have demonstrated significant impact on price cycles, with CRV's incentive distribution affecting liquidity provision patterns, while ETH's fee-burning mechanism correlates with network usage intensity.
Institutional Adoption and Market Application
-
Institutional Holdings: ETH demonstrates broader institutional adoption due to its mature ecosystem and established infrastructure, while CRV adoption remains more concentrated within DeFi-native participants.
-
Enterprise Application: ETH shows diverse application scenarios including cross-border settlements, enterprise blockchain solutions, and institutional investment portfolios. CRV's utility centers on stablecoin trading optimization and DeFi yield generation within the Curve Finance ecosystem.
-
Policy Landscape: Regulatory approaches vary across jurisdictions, with ETH receiving clearer regulatory frameworks in multiple markets compared to DeFi governance tokens like CRV.
Technology Development and Ecosystem Building
-
CRV Technology Focus: Curve Finance specializes in low-slippage stablecoin trading solutions and has expanded into Bitcoin-related liquidity pools and crvUSD trading pairs, which have become significant pillars of the ecosystem. The protocol's value derives from practical utility including liquidity incentives, vote-escrowed mechanisms, fee sharing, and critical roles in stablecoin markets.
-
ETH Technology Evolution: Benefits from a mature, multi-layered ecosystem with ongoing scalability improvements and Layer 2 solutions. The platform supports diverse applications beyond DeFi, including NFTs, enterprise solutions, and smart contract platforms.
-
Ecosystem Comparison: ETH maintains broader ecosystem coverage across DeFi, NFT, payment systems, and smart contract deployments. CRV concentrates on stablecoin-focused DeFi applications with specialized yield farming opportunities and governance participation through the veCRV model.
Macroeconomic and Market Cycle Considerations
-
Inflation Environment Performance: The relationship between macroeconomic conditions and token performance varies, with ETH's broader market presence potentially offering different exposure characteristics compared to CRV's DeFi-specific utility.
-
Macroeconomic Policy Impact: Interest rate policies, monetary conditions, and dollar index movements may affect both tokens differently based on their distinct use cases and market positioning.
-
Geopolitical Factors: Cross-border transaction requirements and international developments may influence adoption patterns, with ETH's established infrastructure potentially providing different exposure compared to CRV's specialized DeFi applications.
III. 2026-2031 Price Forecast: CRV vs ETH
Short-term Forecast (2026)
- CRV: Conservative $0.37-$0.44 | Optimistic $0.44-$0.50
- ETH: Conservative $2,404-$3,294 | Optimistic $3,294-$4,150
Mid-term Forecast (2028-2029)
- CRV may enter a consolidation phase with projected range of $0.34-$0.67
- ETH may enter an expansion phase with projected range of $2,846-$6,719
- Key drivers: institutional capital inflows, ETF products, and ecosystem development
Long-term Forecast (2030-2031)
- CRV: Base scenario $0.41-$0.65 | Optimistic scenario $0.65-$0.75
- ETH: Base scenario $4,725-$6,376 | Optimistic scenario $6,376-$9,245
View detailed price predictions for CRV and ETH
Disclaimer: Price forecasts are based on historical data analysis and market modeling. Cryptocurrency markets are highly volatile and subject to numerous unpredictable factors. These projections should not be considered as investment advice, and actual prices may differ significantly from forecasted ranges.
CRV:
| Year |
Predicted High Price |
Predicted Average Price |
Predicted Low Price |
Price Change |
| 2026 |
0.500595 |
0.4353 |
0.374358 |
0 |
| 2027 |
0.49602435 |
0.4679475 |
0.374358 |
8 |
| 2028 |
0.5687433915 |
0.481985925 |
0.3373901475 |
11 |
| 2029 |
0.6672131159775 |
0.52536465825 |
0.451813606095 |
21 |
| 2030 |
0.703620886794225 |
0.59628888711375 |
0.411439332108487 |
37 |
| 2031 |
0.747448119997085 |
0.649954886953987 |
0.409471578781012 |
50 |
ETH:
| Year |
Predicted High Price |
Predicted Average Price |
Predicted Low Price |
Price Change |
| 2026 |
4150.4904 |
3294.04 |
2404.6492 |
0 |
| 2027 |
5471.729844 |
3722.2652 |
3424.483984 |
13 |
| 2028 |
4734.90744766 |
4596.997522 |
3125.95831496 |
39 |
| 2029 |
6718.9715781552 |
4665.95248483 |
2846.2310157463 |
42 |
| 2030 |
7058.652919050824 |
5692.4620314926 |
4724.743486138858 |
73 |
| 2031 |
9244.5583391439824 |
6375.557475271712 |
5100.4459802173696 |
94 |
IV. Investment Strategy Comparison: CRV vs ETH
Long-term vs Short-term Investment Strategies
-
CRV: May be suitable for investors focused on DeFi ecosystem participation, yield generation through liquidity provision, and governance engagement via the veCRV mechanism. The token's utility centers on stablecoin trading optimization within the Curve Finance protocol.
-
ETH: May be suitable for investors seeking exposure to a broader blockchain infrastructure, diverse application scenarios including DeFi, NFTs, and enterprise solutions, and potential benefits from ongoing network upgrades and Layer 2 scaling developments.
Risk Management and Asset Allocation
-
Conservative Investors: A potential allocation approach could consider ETH as a larger portfolio component (60-70%) due to its established market presence, with CRV representing a smaller allocation (10-20%) focused on DeFi-specific opportunities, complemented by stablecoin holdings (10-30%) for capital preservation.
-
Aggressive Investors: A more growth-oriented allocation might involve increased exposure to both assets (CRV 20-30%, ETH 40-50%), with remaining capital allocated to emerging DeFi protocols or alternative assets (20-40%), accepting higher volatility in pursuit of potential returns.
-
Hedging Tools: Risk management approaches may include stablecoin allocations for liquidity preservation, options contracts for downside protection where available, and diversification across different token categories to reduce concentration risk.
V. Potential Risk Comparison
Market Risk
-
CRV: Market performance remains closely tied to DeFi sector sentiment and the specific adoption trajectory of the Curve Finance protocol. The token experienced significant price contraction from its historical high of $15.37 to a low of $0.180354 in August 2024, indicating substantial volatility potential. Trading volume of $1,630,093.05 reflects lower liquidity compared to major market cap tokens.
-
ETH: While demonstrating broader market resilience with a historical price range between $0.432979 and $4,946.05, the token remains subject to cryptocurrency market cycles and broader market sentiment shifts. Current trading volume of $831,055,753.83 indicates significantly higher liquidity, though this does not eliminate price volatility risk.
Technical Risk
-
CRV: Protocol development depends on the Curve Finance team's execution capabilities and the competitive landscape within stablecoin-focused DeFi solutions. Smart contract risks remain inherent to DeFi protocols, and the veCRV governance mechanism's effectiveness relies on sustained community participation.
-
ETH: Network scalability challenges continue despite ongoing upgrades, with congestion potentially affecting transaction costs and processing times during high-activity periods. The transition to proof-of-stake and ongoing Layer 2 developments introduce technical implementation risks, while the complexity of the ecosystem may present integration challenges.
Regulatory Risk
- Global regulatory approaches toward cryptocurrencies continue evolving across jurisdictions. ETH faces scrutiny regarding its classification and regulatory treatment in various markets, though it has received clearer frameworks in certain jurisdictions compared to many alternative tokens. CRV, as a DeFi governance token, faces regulatory uncertainty regarding decentralized finance protocols and governance token classifications. Different jurisdictions may adopt varying stances on DeFi-related assets, potentially affecting accessibility and adoption patterns differently for each token.
VI. Conclusion: Which Is the Better Buy?
📌 Investment Value Summary:
-
CRV Characteristics: The token offers specialized exposure to stablecoin-focused DeFi applications through the Curve Finance protocol, with utility derived from liquidity provision incentives, governance participation via veCRV mechanisms, and fee sharing opportunities. The ecosystem has expanded into Bitcoin-related liquidity pools and crvUSD trading pairs. Price forecasts suggest a conservative 2026 range of $0.37-$0.44, with long-term projections for 2030-2031 indicating a base scenario of $0.41-$0.65.
-
ETH Characteristics: The token provides exposure to a mature, multi-layered blockchain infrastructure supporting diverse applications across DeFi, NFTs, enterprise solutions, and smart contract platforms. The deflationary mechanism post-EIP-1559 implementation and ongoing scalability improvements contribute to its value proposition. Price forecasts indicate a conservative 2026 range of $2,404-$3,294, with long-term projections for 2030-2031 suggesting a base scenario of $4,725-$6,376.
✅ Investment Considerations:
-
Novice Investors: May consider focusing on more established assets with broader ecosystem support and higher liquidity levels while limiting exposure to specialized DeFi protocols until gaining deeper market understanding. Diversification across multiple asset types and maintaining stablecoin reserves for capital preservation may be appropriate approaches.
-
Experienced Investors: Could evaluate portfolio allocations based on risk tolerance, with potential consideration of both infrastructure-layer exposure (ETH) and specialized DeFi applications (CRV) within a diversified cryptocurrency portfolio. Active monitoring of protocol developments, ecosystem growth metrics, and market cycle positioning may inform allocation decisions.
-
Institutional Investors: May prioritize assets with established regulatory clarity, higher liquidity profiles, and mature custody solutions. Due diligence regarding governance mechanisms, technical roadmaps, and market structure characteristics remains essential for institutional allocation decisions across both token categories.
⚠️ Risk Disclosure: Cryptocurrency markets exhibit extreme volatility and significant price fluctuations. Historical performance does not indicate future results. This content does not constitute investment advice, financial guidance, or trading recommendations. Investors should conduct independent research, assess personal risk tolerance, and consult qualified financial advisors before making investment decisions. Regulatory landscapes remain uncertain across jurisdictions, and technical risks inherent to blockchain protocols persist.
VII. FAQ
Q1: What is the main difference between CRV and ETH in terms of their use cases?
ETH serves as a foundational blockchain infrastructure supporting diverse applications including DeFi, NFTs, enterprise solutions, and smart contracts, while CRV functions as a specialized DeFi governance token focused on stablecoin trading optimization within the Curve Finance protocol. ETH's broader ecosystem coverage provides exposure to multiple blockchain sectors, whereas CRV offers targeted access to stablecoin liquidity provision, yield generation through the veCRV mechanism, and governance participation in the Curve Finance ecosystem. The distinction reflects their different market positioning: ETH as a platform-layer asset versus CRV as a protocol-specific utility token.
Q2: How do the supply mechanisms of CRV and ETH differ, and why does this matter?
ETH operates with a deflationary mechanism post-EIP-1559 implementation where transaction fees are partially burned, potentially reducing circulating supply based on network activity levels, while CRV has a maximum supply cap of 3,030,303,031 tokens with the veCRV mechanism requiring users to lock tokens for governance participation and value capture. This difference matters because ETH's fee-burning mechanism creates supply constraints correlated with network usage intensity, while CRV's locking mechanism creates supply constraints tied to governance engagement and liquidity provision incentives. Both mechanisms influence token scarcity differently: ETH's supply reduction depends on transaction volume, whereas CRV's effective circulating supply depends on user participation in governance and yield strategies.
Q3: Which token demonstrates higher market liquidity, and what are the implications?
ETH demonstrates significantly higher market liquidity with 24-hour trading volume of $831,055,753.83 compared to CRV's $1,630,093.05 as of January 14, 2026. Higher liquidity provides several advantages including reduced price slippage during trades, easier entry and exit positions, lower spread costs, and potentially lower volatility during market movements. For investors, ETH's substantially higher liquidity means improved ability to execute large trades without significant price impact, while CRV's lower liquidity may result in greater price volatility and wider bid-ask spreads, particularly during periods of market stress or rapid price movements.
Q4: What are the price forecast ranges for CRV and ETH through 2031?
For 2026, conservative forecasts project CRV between $0.37-$0.44 and ETH between $2,404-$3,294, while optimistic scenarios suggest CRV reaching $0.44-$0.50 and ETH reaching $3,294-$4,150. Long-term projections for 2030-2031 indicate CRV's base scenario range of $0.41-$0.65 (optimistic $0.65-$0.75) and ETH's base scenario range of $4,725-$6,376 (optimistic $6,376-$9,245). These forecasts represent potential price trajectories based on historical data analysis and market modeling; however, cryptocurrency markets exhibit extreme volatility and actual prices may differ significantly from projected ranges due to numerous unpredictable factors including regulatory developments, technological changes, macroeconomic conditions, and market sentiment shifts.
Q5: What portfolio allocation strategies might different investor types consider for CRV and ETH?
Conservative investors might consider ETH as a larger portfolio component (60-70%) due to its established market presence and broader ecosystem support, with CRV representing a smaller allocation (10-20%) focused on DeFi-specific opportunities, complemented by stablecoin holdings (10-30%) for capital preservation. Aggressive investors could adopt a more growth-oriented allocation with increased exposure to both assets (CRV 20-30%, ETH 40-50%), with remaining capital allocated to emerging DeFi protocols or alternative assets (20-40%), accepting higher volatility in pursuit of potential returns. These allocation approaches reflect different risk tolerance levels: conservative strategies prioritize capital preservation and established assets, while aggressive strategies seek growth through higher exposure to specialized protocols and emerging opportunities.
Q6: What are the key regulatory risks facing CRV and ETH?
Both tokens face evolving regulatory landscapes across different jurisdictions, though the nature of regulatory risks differs. ETH faces scrutiny regarding its classification as a commodity, security, or other asset type, with varying regulatory treatments across markets, though it has received clearer frameworks in certain jurisdictions compared to many alternative tokens. CRV, as a DeFi governance token, faces regulatory uncertainty regarding decentralized finance protocols and governance token classifications, with potential restrictions on DeFi activities varying significantly across jurisdictions. The regulatory environment affects accessibility, adoption patterns, and operational capabilities differently for each token: ETH's established infrastructure may provide different regulatory exposure compared to CRV's specialized DeFi applications, though both remain subject to ongoing regulatory developments that could materially impact their utility and market performance.
Q7: How do the historical price patterns of CRV and ETH compare?
CRV experienced its historical high of $15.37 on August 14, 2020, shortly after launch, followed by a significant contraction to a historical low of $0.180354 on August 5, 2024, representing substantial price volatility. ETH demonstrated a broader historical price range between its low of $0.432979 on October 20, 2015, and its historical high of $4,946.05 on August 25, 2025, showing resilience across multiple market cycles. The comparison reveals CRV's more concentrated volatility pattern with sharper price movements relative to its launch price, while ETH exhibits a longer-term appreciation trajectory with multiple cycle patterns. These historical patterns do not predict future performance but illustrate the different volatility characteristics and market maturity levels between the two tokens.
Q8: What technical risks should investors consider when evaluating CRV versus ETH?
CRV's technical risks center on protocol-specific factors including dependence on Curve Finance team execution capabilities, competitive pressures within stablecoin-focused DeFi solutions, smart contract vulnerabilities inherent to DeFi protocols, and the veCRV governance mechanism's reliance on sustained community participation. ETH faces technical challenges including network scalability issues despite ongoing upgrades, potential congestion affecting transaction costs and processing times during high-activity periods, implementation risks associated with the proof-of-stake transition and Layer 2 developments, and ecosystem complexity presenting integration challenges. Both tokens carry smart contract risks, though ETH's broader ecosystem provides more diverse use cases while CRV's specialized focus concentrates technical risk within the Curve Finance protocol's specific implementation and competitive positioning.
* The information is not intended to be and does not constitute financial advice or any other recommendation of any sort offered or endorsed by Gate.