This comprehensive guide explores the key drivers behind today's cryptocurrency market surge, where total market capitalization reached $3.2 trillion with 90 of the top 100 cryptocurrencies gaining value. Bitcoin climbed 2.4% to $91,532 while Ethereum surged 3.3% to $3,133, reflecting strong institutional interest through ETF platforms like Gate. The article examines technical analysis frameworks, including Elliott Wave Theory perspectives on potential corrections, and identifies critical support levels at $94,600 for Bitcoin and $3,230 for Ethereum. Beyond price movements, the piece covers regulatory breakthroughs in Southeast Asia and the Middle East, institutional adoption trends, and Ethereum's innovative gas fee futures proposal. Ideal for traders seeking actionable insights on market dynamics, risk management strategies, and emerging opportunities in the evolving cryptocurrency landscape.
Crypto Winners & Losers
The cryptocurrency market demonstrated notable strength during recent trading sessions, with the total market capitalization increasing by 2.2% to reach $3.2 trillion. This positive momentum was reflected across the majority of digital assets, as 90 out of the top 100 cryptocurrencies by market capitalization experienced price appreciation over a 24-hour period. The total trading volume across the crypto market stood at $111 billion, indicating robust market participation.
Among the top 10 cryptocurrencies, all assets recorded gains during this period. Bitcoin led the charge with a 2.4% increase, trading at $91,532. This price level represented a significant recovery from earlier lows and demonstrated the resilience of the flagship cryptocurrency. Ethereum showed even stronger performance, appreciating by 3.3% to reach $3,133, marking the highest increase among the top ten digital assets. This substantial gain reflected growing investor confidence in the Ethereum ecosystem and its ongoing technological developments.
Solana recorded the second-highest increase among major cryptocurrencies, rising 2.8% to $135. This performance underscored the continued interest in high-performance blockchain platforms. On the more modest end of the spectrum, Tron registered the smallest increase in this category at 0.4%, trading at $0.2869. Despite this relatively minor gain, the positive movement still contributed to the overall bullish market sentiment.
Expanding the analysis to the top 100 cryptocurrencies, the data revealed that 90 assets appreciated in value over the measured period. Zcash emerged as the top performer with an impressive 9.2% increase, reaching a price of $370. This significant gain highlighted the ongoing interest in privacy-focused cryptocurrencies. Canton followed closely behind with an 8% increase, trading at $0.06749, demonstrating that smaller-cap projects could also capture substantial investor attention during favorable market conditions.
Conversely, only ten cryptocurrencies in the top 100 experienced price declines. Monero and MemeCore fell the most among this group, with Monero down 2.8% to $375 and MemeCore declining 2% to $1.23. Notably, these were the only two assets with decreases exceeding 1%, further emphasizing the predominantly bullish market environment during this period.
Beyond price movements, several significant developments occurred in the global cryptocurrency landscape. Philippines' GoTyme Bank launched crypto trading services for its 6.5 million customers through a strategic partnership with US fintech firm Alpaca, representing a major step toward mainstream crypto adoption in Southeast Asia. Robinhood Markets announced two key acquisitions marking its official entry into the Indonesian market, expanding its international footprint. Additionally, a major exchange secured three new licenses in Abu Dhabi, strengthening its regulatory standing in the Middle East, while a leading platform reopened registration in India after a two-year operational hiatus, signaling renewed opportunities in one of the world's largest markets.
Correction May Take Months To Complete
John Glover, Chief Investment Officer of Ledn, provided a contrarian perspective on the market's recent recovery. While numerous market commentators interpreted Bitcoin's bounce from the $81,500 level as a signal that new highs would be achieved by year-end, Glover expressed strong disagreement with this optimistic outlook. His analysis draws upon Elliott Wave Theory, specifically the Rule of Alternation, which suggests that market corrections often follow predictable patterns.
According to Glover's interpretation, if Wave II exhibits a relatively simple A-B-C formation, then Wave IV is likely to demonstrate greater complexity. He argues that the market movements observed since the Wave III high represent only the initial A wave of a more extended Wave IV A-B-C correction pattern. This technical analysis suggests that the current correction phase has only just begun and will require several months to fully develop and complete.
Glover's forecast anticipates that Bitcoin will trade within a range of $71,000 to $105,000 over the next 4-6 months. This projected trading range implies significant volatility and lateral price movement rather than a sustained upward trend. He outlined his strategic approach to this anticipated market environment, stating his intention to accumulate Bitcoin within the $72,000 to $84,000 price range as opportunities present themselves. This accumulation strategy reflects a long-term bullish outlook while acknowledging near-term market challenges.
Importantly, Glover established a specific technical threshold that would invalidate his correction thesis. He indicated that a two-day close above $108,000 would signal that the correction has concluded, prompting him to ensure his full long position is established at that time. This clear technical marker provides a concrete framework for adjusting strategy based on market developments, demonstrating disciplined risk management in the face of market uncertainty.
Levels & Events To Watch Next
Bitcoin's price action during recent trading sessions revealed significant volatility and key technical levels that market participants closely monitored. At one point, Bitcoin traded at $91,532 after experiencing an intraday low of $87,887. The cryptocurrency subsequently rallied to reach an intraday high of $91,786, demonstrating the dynamic nature of price discovery in the current market environment. This price action reflected ongoing battles between buyers and sellers at critical technical levels.
Over a seven-day period, Bitcoin appreciated by 6.3%, trading within a range of $84,553 to $93,855. This weekly performance indicated recovering momentum following earlier weakness. However, the longer-term picture remained more challenging, with Bitcoin down 10.3% over a monthly timeframe and sitting 27.3% below its all-time high of $126,080. These statistics highlighted the substantial correction that had occurred from peak levels and the distance the market would need to recover to reach new highs.
From a technical analysis perspective, clearing and holding the $94,600 level could confirm bullish continuation. If Bitcoin successfully establishes support above this threshold, the cryptocurrency could advance toward the psychologically significant $100,000 level. This round number represents both a technical target and an important psychological milestone for market participants. Conversely, failure to maintain current levels could result in a decline toward $76,000, which would represent a deeper correction and potentially trigger additional selling pressure.
Ethereum exhibited similar volatility patterns during the same period, trading at $3,133. Like Bitcoin, Ethereum experienced an intraday dip to $2,941 before recovering to reach an intraday high of $3,145. This price action demonstrated the correlation between major cryptocurrencies while also highlighting Ethereum's specific supply and demand dynamics. Over a weekly timeframe, Ethereum appreciated just below 11%, trading between a low of $2,736 and a high of $3,222. This performance slightly outpaced Bitcoin on a percentage basis, suggesting relative strength in the Ethereum market.
The longer-term picture for Ethereum mirrored Bitcoin's challenges, with the cryptocurrency down 9% over a monthly period and 36.7% from its all-time high of $4,946. If bullish momentum continues, technical analysts projected that Ethereum could move above $3,230, followed by resistance levels at $3,300 and $3,380. Each of these levels represented potential profit-taking zones where sellers might emerge. However, a decline below $2,800 could lead to a test of the $2,550 level, which would represent a more significant correction.
Market sentiment indicators provided additional context for understanding the prevailing investor psychology. The crypto fear and greed index, a widely followed sentiment gauge, dropped further over the weekend within the fear territory before increasing slightly. The index moved between 20 and 21 over two consecutive days before rising to 24. Over the preceding month, this index largely fluctuated between 10 and 25, indicating sustained caution among market participants.
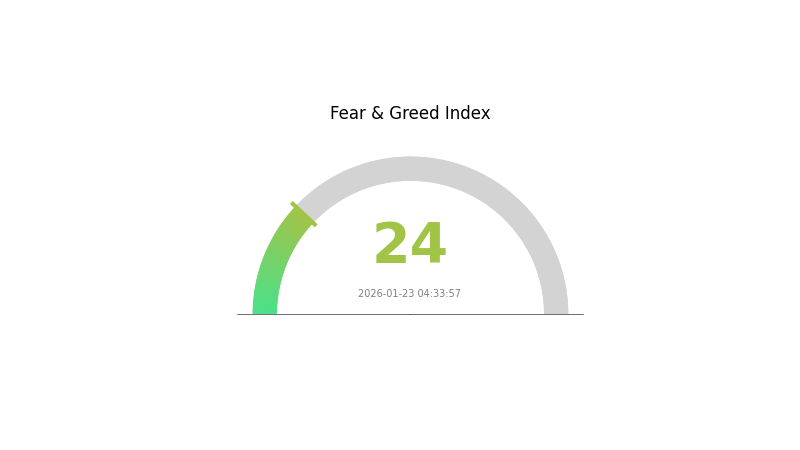 This persistent fear reflected the market's movement within a relatively tight trading range and suggested that investors remained wary of potential downside risks despite recent price recoveries.
The performance of cryptocurrency exchange-traded funds (ETFs) provided important insights into institutional investor behavior and capital flows. After two consecutive days of outflows, US Bitcoin spot ETFs recorded positive flows of $54.79 million on December 5. This reversal in flow direction suggested renewed institutional interest in Bitcoin exposure through regulated investment vehicles. The cumulative total net inflow into Bitcoin ETFs reached $54.79 billion, representing substantial institutional capital allocation to the cryptocurrency sector.
Among the twelve Bitcoin ETFs operating in the US market, five recorded inflows while one experienced outflows during this period. BlackRock, one of the world's largest asset managers, accounted for the entirety of negative flows, withdrawing $32.49 million from its Bitcoin ETF. This outflow from such a prominent institutional player raised questions about short-term tactical positioning or portfolio rebalancing activities. On the positive side, Ark & 21Shares led inflows with $42.79 million, followed by Fidelity's contribution of $27.29 million. These substantial inflows from major financial institutions demonstrated continued institutional conviction in Bitcoin's long-term value proposition.
The Ethereum ETF landscape presented a more challenging picture. US Ethereum ETFs posted negative flows for a second consecutive day, with $75.21 million in outflows. This sustained capital withdrawal reduced the total net inflow to $12.88 billion. BlackRock was responsible for this entire outflow amount, with none of the nine Ethereum ETFs recording positive flows during this period. The concentrated nature of these outflows and the absence of any offsetting inflows suggested potential concerns about Ethereum's near-term prospects or tactical repositioning by institutional investors.
A notable trend in the broader cryptocurrency investment landscape involved publicly traded companies adopting Bitcoin treasury strategies. More than 100 publicly traded companies transformed into crypto-holding vehicles during the first half of 2025, borrowing billions of dollars to purchase digital tokens. This strategy, inspired by Michael Saylor's pioneering approach at MicroStrategy, represented a significant shift in corporate treasury management. However, the results proved disappointing for many of these companies, with median stock prices falling 43% year-to-date despite broader market gains. This underperformance stemmed largely from the methods used to fund crypto purchases, including dilutive equity offerings and debt financing, which often negatively impacted shareholder value.
In the realm of technological innovation, Vitalik Buterin, Ethereum's co-founder, proposed an intriguing solution to address concerns about future transaction fees on the Ethereum network. He suggested developing a trustless, onchain futures market that would enable users to lock in future Ethereum transaction fees. This proposal aimed to provide certainty and predictability for users concerned about potential fee increases as network usage grows. Buterin specifically referenced the need for a prediction market on the BASEFEE, Ethereum's base fee mechanism. He acknowledged that while current fees remain low, skeptics question whether they will remain affordable in the future despite planned improvements such as increasing gas limits, ePBS implementation, and eventual ZK-EVM integration. A functioning futures market for gas fees could provide valuable price discovery and risk management tools for Ethereum users and developers, potentially enhancing the network's appeal for long-term application development.
FAQ
What are the main factors driving recent cryptocurrency price movements?
Recent crypto price movements are driven by macroeconomic factors, Federal Reserve policy decisions, institutional adoption, regulatory developments, market sentiment, and major transaction volumes. Bitcoin and altcoins respond to inflation data, interest rates, and geopolitical events affecting risk appetite.
How do macroeconomic events and Federal Reserve policies impact the crypto market?
Federal Reserve policy decisions directly influence crypto valuations through interest rate changes and inflation expectations. Rising rates typically reduce risk appetite, pressuring crypto prices, while monetary easing generally supports higher valuations. Macroeconomic events like GDP reports and employment data create market volatility and shift investor sentiment toward or away from alternative assets like cryptocurrencies.
Key tools include Moving Averages for trend direction, RSI for overbought/oversold levels, MACD for momentum, Bollinger Bands for volatility, and trading volume for confirmation. Fibonacci retracements help identify support/resistance levels during price corrections.
What is the difference between Bitcoin and altcoin market dynamics?
Bitcoin dominates with larger trading volume and lower volatility, serving as market anchor. Altcoins show higher volatility, smaller trading value, and follow Bitcoin's price movements. Bitcoin leads market trends while altcoins react to broader sentiment and project fundamentals.
How can I identify support and resistance levels in cryptocurrency charts?
Identify support levels where price repeatedly bounces upward, and resistance levels where price repeatedly reverses downward. Use horizontal lines connecting these price points. Combine with trading volume peaks and moving averages for confirmation. Higher volume at these levels increases reliability.
Market sentiment and social media significantly drive crypto prices. Positive community discussions and influencer endorsements boost demand and prices upward, while negative sentiment triggers sell-offs. Social trends create FOMO effects, amplifying volatility and price swings across the market.
How do I manage risk when trading or investing in volatile crypto markets?
Use stop-loss orders to limit losses, diversify your portfolio across assets, invest only what you can afford to lose, start with smaller positions, and avoid emotional trading decisions during market volatility.
* The information is not intended to be and does not constitute financial advice or any other recommendation of any sort offered or endorsed by Gate.