# Article Overview: DAFI vs SAND - Play-to-Earn Gaming Tokens Comparison
This comprehensive guide compares DAFI and SAND, two leading metaverse gaming tokens, across price performance, tokenomics, and investment potential. DAFI (launched 2021) offers synthetic reward mechanisms for decentralized networks, while SAND (launched 2020) powers The Sandbox's virtual gaming ecosystem. The analysis examines historical price trends, market positioning, risk factors, and 2026-2031 price forecasts to help investors determine which token better suits their portfolio. Ideal for both beginner and experienced crypto investors, this article addresses critical questions about liquidity, ecosystem development, and long-term value. Access real-time prices and detailed market data on Gate to make informed investment decisions in the play-to-earn gaming sector.
Introduction: DAFI vs SAND Investment Comparison
In the cryptocurrency market, the comparison between DAFI and SAND has always been a topic investors cannot overlook. The two not only show significant differences in market capitalization ranking, application scenarios, and price performance, but also represent different positions in the crypto asset landscape.
DAFI (DAFI): Launched in 2021, it has gained market recognition by creating network-linked synthetic compounds to reward economies while maintaining staking, liquidity, and participation in decentralized networks without requiring high token issuance rates.
SAND (SAND): Since its launch in 2020, it has been recognized as a virtual game world where players can create, own, and benefit from different game experiences through Ethereum-based functional tokens, establishing itself as one of the most actively traded tokens in the crypto ecosystem.
This article will comprehensively analyze the investment value comparison between DAFI and SAND across historical price trends, supply mechanisms, market positioning, ecosystem development, and future outlook, while attempting to answer the question investors care most about:
"Which is the better buy right now?"
Dafi Protocol (DAFI) vs The Sandbox (SAND): Price History and Market Analysis
I. Historical Price Comparison and Current Market Status
Dafi Protocol (DAFI) and The Sandbox (SAND) Historical Price Trends
- 2021: DAFI reached its all-time high of $0.207531 on March 20, 2021, reflecting early market enthusiasm for the protocol's synthetic reward mechanism.
- 2021: SAND achieved its all-time high of $8.4 on November 25, 2021, driven by growing interest in metaverse and GameFi platforms.
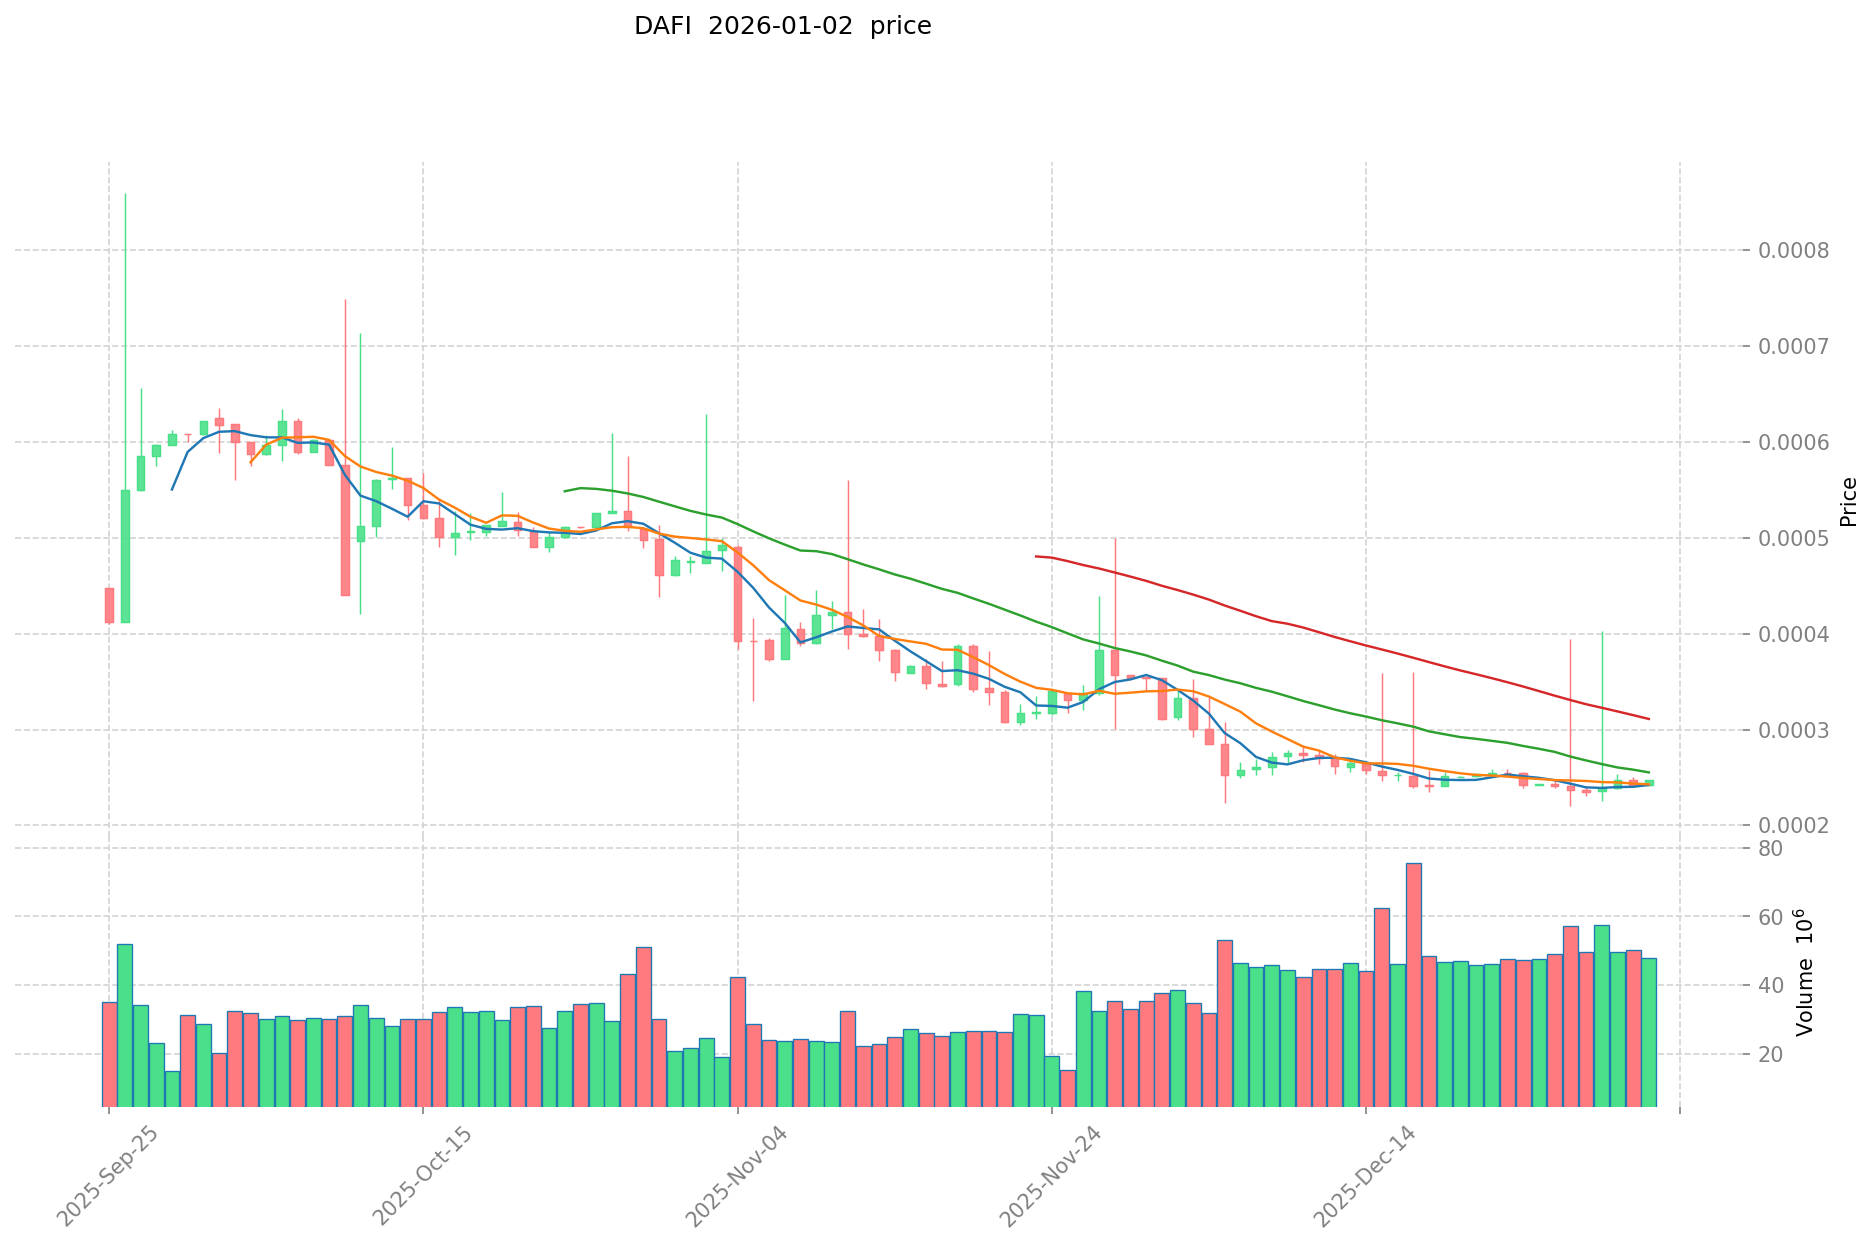
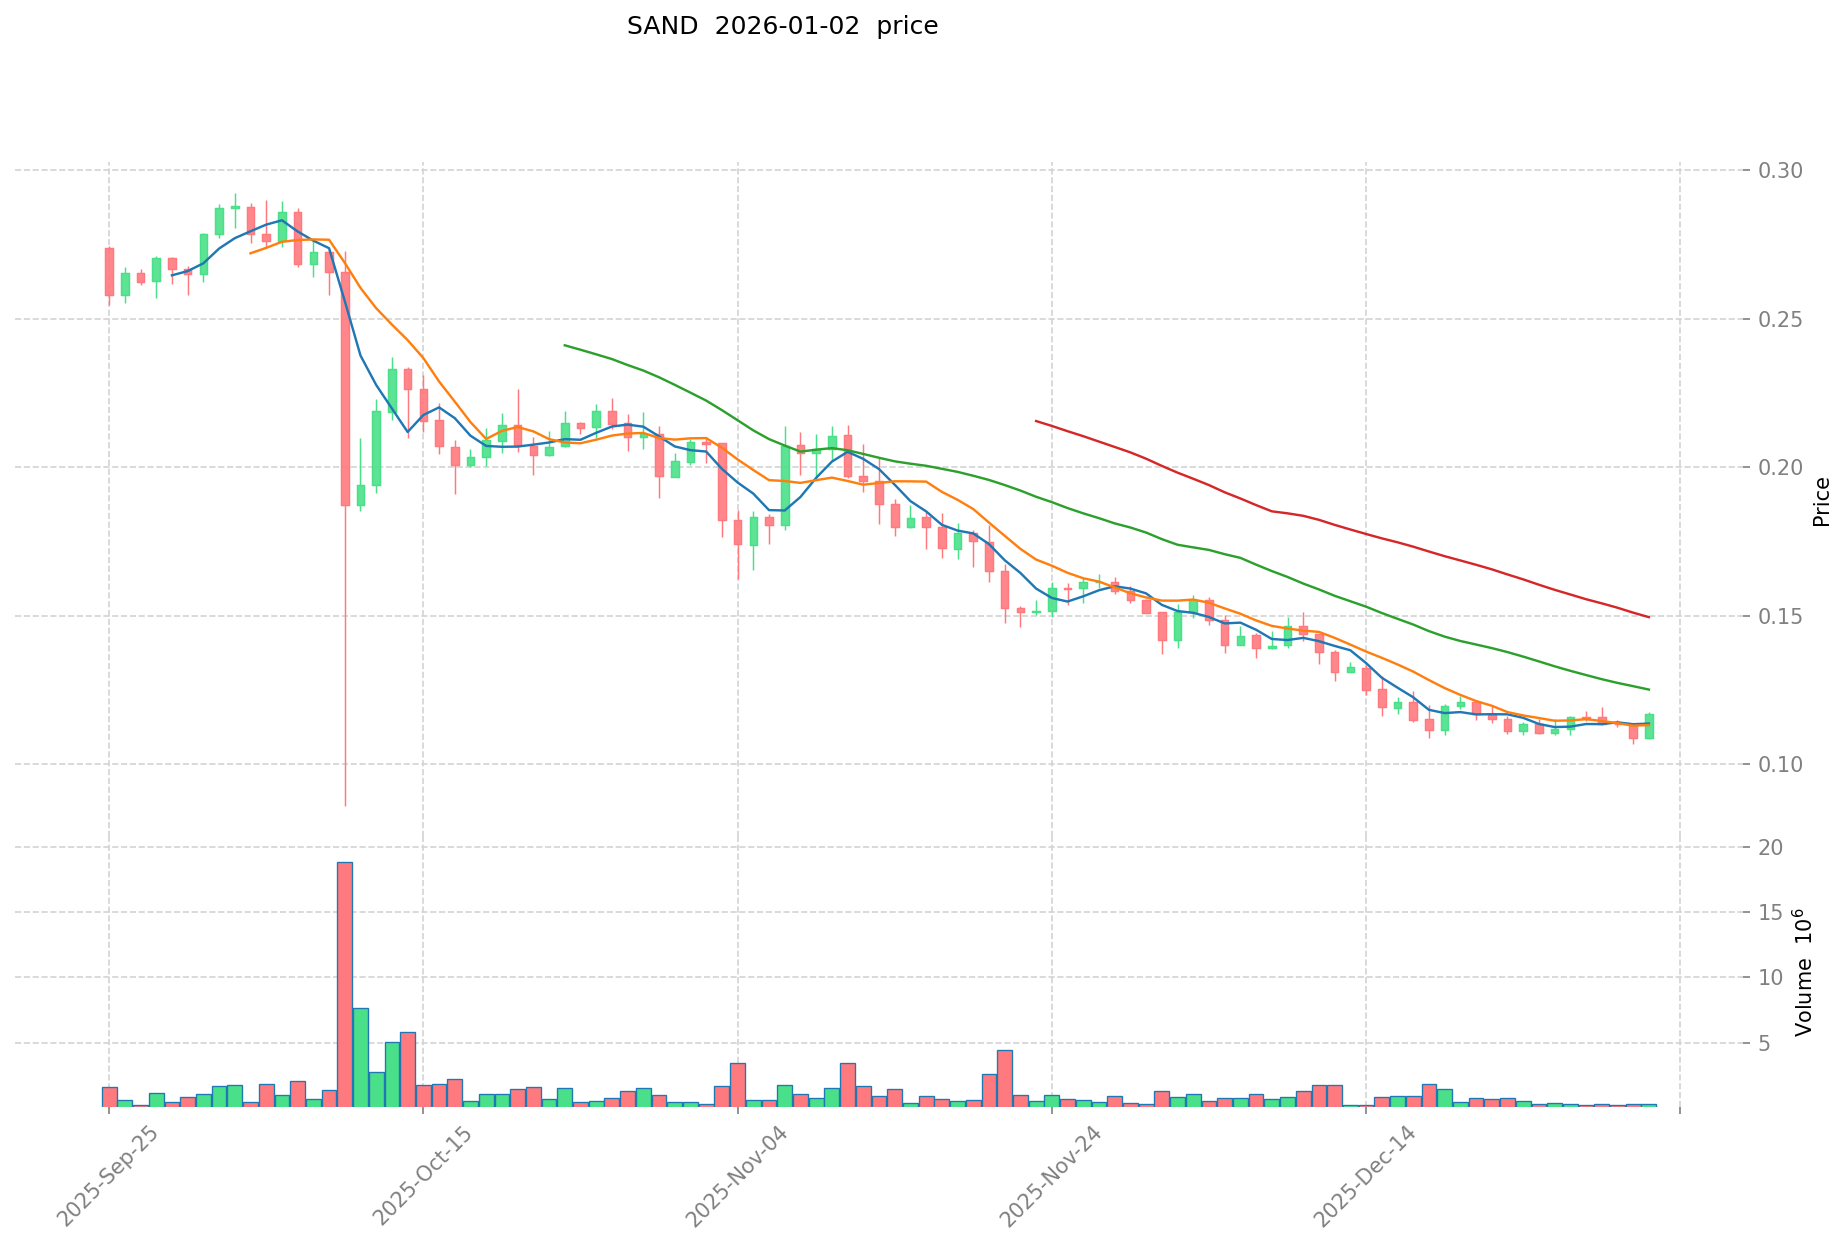
- Comparative Analysis: Over the market cycle from 2021 to 2026, DAFI declined from $0.207531 to $0.0002479, representing a 99.88% decrease. In the same period, SAND fell from $8.4 to $0.1174, representing a 98.59% decline. Both tokens experienced substantial depreciation, though SAND maintained relatively higher trading liquidity and market engagement.
Current Market Status (January 2, 2026)
- DAFI current price: $0.0002479
- SAND current price: $0.1174
- 24-hour trading volume: DAFI recorded $11,560.60 compared to SAND's $82,335.55
- Market sentiment index (Fear & Greed Index): 28 (Fear)
View real-time prices:
II. Core Factors Affecting DAFI vs SAND Investment Value
Tokenomics Comparison
Based on available information about Web3 and blockchain projects, DAFI and SAND operate within the digital asset ecosystem with distinct economic models. However, specific details regarding their supply mechanisms, emission schedules, and deflationary features are not provided in the reference materials.
Institutional Adoption and Market Applications
The reference materials indicate that DAFI and SAND are positioned within Web3 and blockchain technology frameworks with community support. Both projects focus on Web3 adoption, though specific institutional holding data, enterprise partnerships, and regulatory treatment across different jurisdictions are not detailed in the available sources.
Technology Development and Ecosystem Building
Both DAFI and SAND are characterized as Web3-focused projects with emphasis on blockchain technology innovation. Their long-term value depends on scalability improvements, partnership development, and user growth. However, specific technological upgrades, DeFi implementations, NFT integrations, and smart contract applications are not elaborated in the provided reference materials.
Macroeconomic Environment and Market Cycles
The investment value of DAFI and SAND is influenced by the broader regulatory environment and technology adoption landscape. Their performance relative to inflation, monetary policy impacts, and geopolitical factors affecting Web3 market conditions would be relevant considerations, though specific analysis of these relationships is not available in the reference materials provided.
III. 2026-2031 Price Forecast: DAFI vs SAND
Short-term Forecast (2026)
- DAFI: Conservative $0.0001325-$0.00025 | Optimistic $0.00037
- SAND: Conservative $0.081075-$0.1175 | Optimistic $0.160975
Medium-term Forecast (2028-2029)
- DAFI may enter growth consolidation phase, expected price range $0.000290749-$0.0003800755
- SAND may enter steady expansion phase, expected price range $0.158318607-$0.19789825875
- Key drivers: institutional capital inflows, ETF development, ecosystem expansion
Long-term Forecast (2030-2031)
- DAFI: Base scenario $0.0002590594608-$0.0004047804075 | Optimistic scenario $0.000372317018818-$0.000593934291924
- SAND: Base scenario $0.12348851346-$0.2374779105 | Optimistic scenario $0.159335804049975-$0.303496769619
View DAFI and SAND Detailed Price Forecast
DAFI:
| 年份 |
预测最高价 |
预测平均价格 |
预测最低价 |
涨跌幅 |
| 2026 |
0.00037 |
0.00025 |
0.0001325 |
0 |
| 2027 |
0.0003906 |
0.00031 |
0.0001581 |
25 |
| 2028 |
0.000409851 |
0.0003503 |
0.000290749 |
41 |
| 2029 |
0.000429485315 |
0.0003800755 |
0.00028125587 |
53 |
| 2030 |
0.000481688684925 |
0.0004047804075 |
0.0002590594608 |
63 |
| 2031 |
0.000593934291924 |
0.000443234546212 |
0.000372317018818 |
78 |
SAND:
| 年份 |
预测最高价 |
预测平均价格 |
预测最低价 |
涨跌幅 |
| 2026 |
0.160975 |
0.1175 |
0.081075 |
0 |
| 2027 |
0.185185875 |
0.1392375 |
0.096073875 |
18 |
| 2028 |
0.23358483 |
0.1622116875 |
0.0973270125 |
38 |
| 2029 |
0.27705756225 |
0.19789825875 |
0.158318607 |
68 |
| 2030 |
0.268350038865 |
0.2374779105 |
0.12348851346 |
102 |
| 2031 |
0.303496769619 |
0.2529139746825 |
0.159335804049975 |
115 |
四、投资策略对比:DAFI vs SAND
长期 vs 短期投资策略
- DAFI:适合关注合成奖励机制创新、看好去中心化网络参与的长期投资者,但需承受高波动性风险
- SAND:适合关注元宇宙和游戏生态发展、寻求相对稳定流动性的投资者
风险管理与资产配置
- 保守型投资者:DAFI: 5% vs SAND: 10%
- 激进型投资者:DAFI: 15% vs SAND: 25%
- 对冲工具:稳定币配置占比30%-40%、期权策略对冲极端行情、跨币种组合分散单一代币风险
五、潜在风险对比
市场风险
- DAFI:流动性极低(24小时交易量仅$11,560.60),价格波动剧烈,容易出现滑点风险;历史跌幅高达99.88%,反弹空间与风险并存
- SAND:交易量相对充足(24小时$82,335.55),但仍面临市场情绪波动风险;98.59%的历史跌幅反映市场对元宇宙概念热度下降
技术风险
- DAFI:网络采用合成复合奖励机制,其技术运行稳定性、智能合约安全性需要持续关注
- SAND:基于Ethereum构建,依赖主网扩展性能改进;游戏生态的用户体验和智能合约漏洞风险
监管风险
- 全球监管政策对两者影响:随着各国对加密资产的监管趋严,DeFi类项目(DAFI)和游戏代币(SAND)均面临不确定性;某些地区的游戏内交易限制可能直接影响SAND应用场景
六、结论:Which Is the Better Buy?
📌 投资价值总结:
- DAFI优势:创新的网络激励机制、去中心化参与模式、长期生态拓展潜力
- SAND优势:更高的交易流动性、成熟的元宇宙游戏平台、相对稳定的市场认可度
✅ 投资建议:
- 新手投资者:优先考虑SAND作为入场选择,其交易流动性和生态认可度相对较高,风险相对可控
- 有经验投资者:可根据风险偏好配置两者组合,DAFI可作为高风险/高潜力配置的一部分
- 机构投资者:关注两者生态发展进度、技术更新和市场流动性变化,等待更明确的市场信号后做出配置决策
⚠️ 风险提示:加密货币市场波动性极高,本文不构成投资建议。
FAQ
DAFI和SAND分别是什么?各自的核心功能是什么?
DAFI是数字资产框架倡议,核心功能是标准化数字资产管理。SAND是数字资产标准与互操作性协议,核心功能是促进不同区块链间的资产互操作性和跨链交互。
DAFI与SAND在代币经济学上有什么主要区别?
DAFI主要用于治理投票和权益收益,SAND则主要用于游戏内交易和虚拟资产购买。SAND更聚焦游戏生态,DAFI更聚焦治理和收益。两者的代币分配机制和释放周期也有所不同。
DAFI和SAND的应用场景分别是什么?哪个更有实际应用价值?
DAFI主要应用于去中心化金融领域,提供流动性挖矿服务。SAND主要用于元宇宙游戏生态,支持虚拟地产和游戏资产交易。SAND实际应用价值更高,市场需求更广泛。
投资DAFI和SAND分别面临什么风险?哪个风险更大?
DAFI和SAND都面临市场波动、流动性和项目发展风险。DAFI作为较新项目风险相对较大,SAND因生态更成熟、应用场景更明确,风险相对较小。投资加密资产本质风险都较高。
DAFI和SAND的流动性和交易对深度如何对比?
SAND流动性和交易对深度相对较好,作为知名项目交易额稳定。DAFI流动性相对较低,交易对深度不如SAND,市场波动性更大。总体而言,SAND在流动性方面表现更优。
DAFI和SAND在生态发展和社区活跃度上有什么差异?
DAFI专注去中心化金融生态,社区参与度更活跃;SAND则聚焦区块链可扩展性和高效交易。两者生态方向不同,DAFI在DeFi领域社区热度更高,SAND在基础设施发展上更具优势。
* The information is not intended to be and does not constitute financial advice or any other recommendation of any sort offered or endorsed by Gate.