This comprehensive guide explores the hammer candlestick pattern, a widely-recognized technical analysis tool for identifying bullish reversals in cryptocurrency trading and other financial markets. The article covers pattern identification, visual characteristics, four key variations including traditional hammers, inverted hammers, hanging mans, and shooting stars, each with distinct bullish or bearish implications. Readers learn practical trading strategies by combining hammer signals with moving averages, volume analysis, and support/resistance levels on Gate and other platforms. The guide emphasizes that while hammer patterns offer reliability and accessibility for traders of all skill levels, they should never be used in isolation due to false signal risks. Through multi-indicator confirmation and proper risk management including stop-loss placement, traders can significantly improve trading success in volatile cryptocurrency markets.
What is the Hammer Candlestick Pattern?
Navigating the cryptocurrency market can be challenging at times. Market participants need to conduct thorough technical analysis to succeed in this space, and candlestick charts are among the most popular tools used for technical analysis. When used correctly, these charts can be extremely useful in identifying patterns and helping you formulate trading strategies. Learning to read these charts is beneficial not only for cryptocurrency trading but also for stock trading, forex trading, and other financial markets.
The hammer candlestick pattern represents one of the most widely recognized candlestick formations in technical analysis. This pattern serves as a powerful indicator that traders actively seek because it signals a potential bullish reversal in the market. Once identified, this pattern can be combined with other trading methods and indicators to strengthen trading decisions. The hammer candlestick can signal an upcoming trend reversal, while other analytical tools can help confirm this reversal and provide additional confidence in trading decisions.
How Does the Hammer Candlestick Pattern Look?
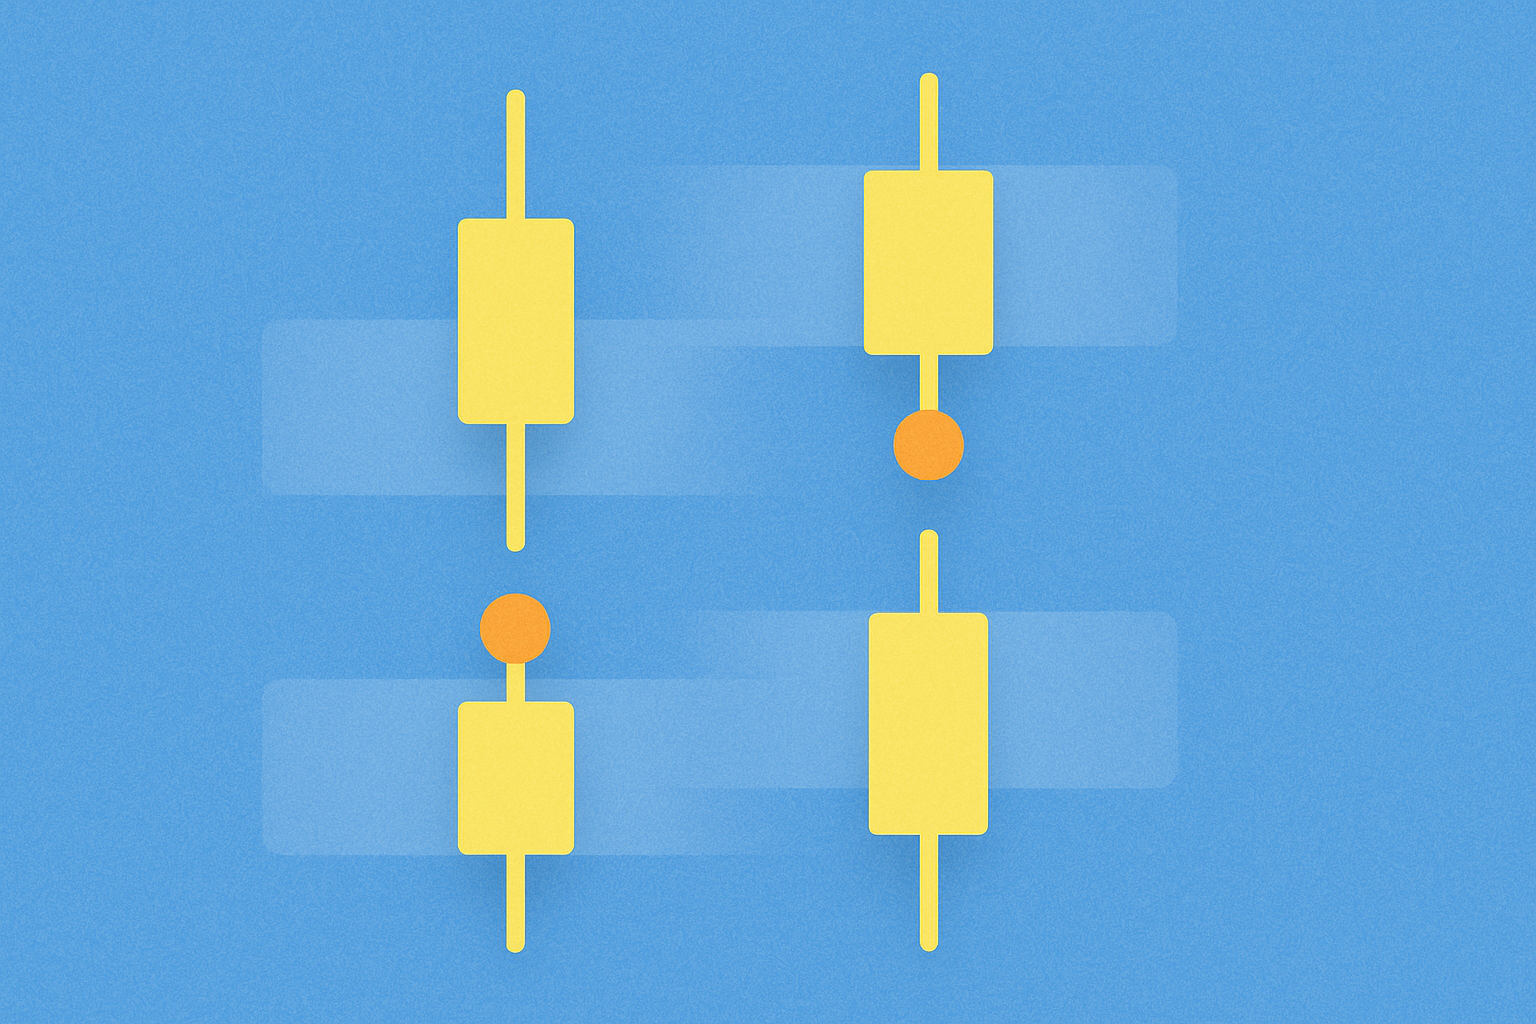
The hammer candlestick pattern is relatively easy to spot on candlestick charts, making it accessible even for traders who are developing their technical analysis skills. This pattern consists of a single candlestick formation characterized by a small body and a long lower wick pointing downward. The visual appearance resembles a hammer, hence its name.
The success rate and reliability of this candlestick pattern primarily depend on the ratio between the length of the wick and the body of the candle. A strong hammer candlestick pattern typically features a lower wick that is at least twice the length of the candle body. Generally speaking, the longer the wick in proportion to the body, the stronger the reversal signal becomes. This extended lower wick demonstrates that sellers pushed prices significantly lower during the trading period, but buyers managed to push prices back up near the opening level, indicating strong buying pressure and potential trend reversal.
Different Variations of the Hammer Pattern
The traditional hammer candlestick signals a bullish reversal, and this interpretation applies across various financial markets. Whether you are engaged in cryptocurrency trading, forex trading, or stock market trading, the fundamental principle remains consistent.
However, hammer-type candlestick patterns can appear in several different forms, each carrying its own specific meaning and implications for traders. Some hammer variations are considered bullish hammers, indicating upward price movement, while others are bearish hammers, suggesting downward pressure. Understanding these variations is crucial for accurate market interpretation. Below is a comprehensive list of different hammer-related candlestick patterns.
Traditional Hammer Candle
The first and most fundamental type is the traditional hammer candlestick. This represents a bullish candlestick pattern that forms when the closing price is higher than the opening price, resulting in a green or white candle body depending on your charting platform. This formation demonstrates that while selling pressure was significant during the trading period (as evidenced by the long lower wick), buyers ultimately gained control of the market and pushed prices higher by the close. The pattern suggests that the downtrend may be losing momentum and a bullish reversal could be imminent.
Inverted Hammer Candle
The second variation is the inverted hammer candlestick, which also serves as a bullish signal in technical analysis. This candle forms when the opening price is lower than the closing price, similar to the traditional hammer. However, in this case, there is a long upper wick extending above the candle body instead of below it. This formation indicates that strong buying pressure attempted to push prices significantly higher during the trading session. However, sellers ultimately managed to pull prices back down before the candle could close at its highest point. Although this pattern is not as strongly bullish as the traditional hammer, it still signals meaningful influence from buyers and suggests that bullish momentum may be building in the market.
Hanging Man Candle
Next, we have a hammer-type pattern that represents a bearish signal, known as the Hanging Man candlestick. This pattern forms when the opening price is higher than the closing price, resulting in a red or black candle body. The lower wick of this candle is long, demonstrating that the market experienced significant selling pressure during the trading period. Because the closing price is lower than the opening price, this suggests that sellers likely maintained control of the market throughout the session. This is why the Hanging Man is considered a bearish candlestick pattern, often appearing at the top of an uptrend and signaling a potential reversal to the downside.
Shooting Star Candle
Finally, we have the shooting star candlestick, which also represents a bearish pattern in technical analysis. This pattern resembles the inverted hammer in appearance but signals a bearish reversal rather than a bullish one. The shooting star forms when price attempts to break out in an upward direction, creating a long upper wick, but ultimately the candle closes below the opening price. This formation demonstrates that despite initial buying pressure that pushed prices higher, sellers regained control and drove prices back down, indicating an impending bearish reversal. The shooting star typically appears at the end of an uptrend and serves as a warning signal for traders holding long positions.
How to Trade with the Hammer Candlestick Pattern?
Traders who identify one of these hammer variations can use this knowledge to their advantage in developing profitable trading strategies. However, it is important not to rely solely on the appearance of the pattern when making trading decisions. The hammer candlestick should be used as a signal to examine the market more closely rather than as a definitive buy or sell trigger.
Successful traders typically combine hammer patterns with other technical indicators to confirm their analysis. For example, moving averages can help confirm the overall trend direction and strength. Volume indicators can verify whether the hammer formation occurred on significant trading volume, which adds credibility to the signal. Support and resistance levels can provide context about whether the hammer formed at a meaningful price level. Additionally, fundamental analysis can also prove useful, as it may reveal specific events or news that increased buying pressure and contributed to the hammer formation. This multi-faceted approach to analysis significantly improves the reliability of trading decisions based on hammer candlestick patterns.
Advantages and Limitations of the Hammer Candlestick Pattern
The hammer candlestick pattern offers both benefits and limitations that traders should understand before incorporating it into their trading strategy. Below is a comprehensive list of advantages and disadvantages associated with this pattern.
Advantages
The hammer candlestick pattern demonstrates reliable price trend signals across all financial markets, including cryptocurrencies, stocks, forex, and commodities. This universal applicability makes it a valuable tool for traders who operate in multiple markets. The pattern integrates well with other price action tools and technical indicators, allowing for comprehensive market analysis. Market participants can utilize the hammer candlestick pattern as either a trend reversal pattern or a trend continuation pattern depending on the broader market context. Perhaps most importantly, the hammer pattern is very easy to identify on charts, making it accessible to traders at all skill levels and reducing the learning curve for technical analysis.
Disadvantages
Despite its usefulness, the hammer candlestick pattern is not 100% reliable and can generate false signals that lead to losing trades. Price action may continue to decline even after the pattern appears, particularly if the broader market trend remains strongly bearish or if the pattern forms without sufficient supporting evidence from other indicators. Traders cannot rely solely on this single indicator when making trading decisions, as doing so significantly increases risk exposure. Successful trading requires confirming hammer signals with additional technical analysis tools, volume confirmation, and consideration of overall market conditions. The pattern works best when combined with proper risk management strategies, including stop-loss orders and position sizing.
Why You Should Remember the Hammer Candlestick Pattern
Like other patterns that appear on trading charts, the hammer candlestick pattern has its own specific advantages and disadvantages that traders must consider. The most significant limitation of this pattern is its potential to provide false signals that can lead to unprofitable trades. The appearance of a hammer candlestick suggests that a trend reversal is likely to occur, but market conditions or unexpected events may disrupt this anticipated reversal.
However, the hammer candlestick pattern remains highly valuable because it is easy to detect on charts and appears relatively frequently across different timeframes and markets. The key principle to remember is not to act on this pattern immediately upon identification. Instead, traders should always confirm the trend reversal through other technical indicators, volume analysis, and consideration of broader market context. This cautious approach is particularly important when trading cryptocurrencies, as the inherent volatility of digital assets makes market navigation challenging. Successful market participants must remain vigilant and cautious, using the hammer pattern as one component of a comprehensive trading strategy rather than as a standalone signal. By combining hammer candlestick analysis with proper risk management and multiple confirmation signals, traders can significantly improve their success rate in navigating volatile cryptocurrency markets and other financial markets.
FAQ
What is a Hammer Candlestick Pattern and what are its characteristics?
A Hammer Candlestick Pattern is a bullish reversal signal featuring a small body at the top and a long lower wick, typically twice the body length. It appears after downtrends, indicating buyer strength. The pattern suggests potential price recovery and trend reversal, making it valuable for identifying buying opportunities in technical analysis.
How to identify and confirm the hammer candlestick pattern? What conditions must be met?
A hammer candlestick has a small body at the top, long lower wick (2-3x body length), minimal upper wick, and forms after downtrends. Confirm with increased trading volume and bullish follow-up candles for reversal signals.
How should I trade after a hammer candlestick appears? What price movement does it signal?
A hammer candlestick signals potential reversal from downtrends. Traders typically buy on confirmation when price closes above the hammer's high with increased trading volume. It suggests bullish momentum and potential upward price movement ahead.
How accurate and reliable is the Hammer Candlestick Pattern? Is it safe to use alone?
The Hammer pattern has moderate reliability in identifying potential reversals, with accuracy rates typically around 60-70% in trending markets. However, using it solely is risky; combining it with support levels, volume analysis, and other indicators significantly improves reliability and trading success rates.
What is the difference between Hammer Candlestick and Inverted Hammer?
Hammer has a small body at the top with a long lower wick, signaling potential upward reversal. Inverted Hammer has a small body at the bottom with a long upper wick, also suggesting possible bullish reversal. The key difference is wick position: lower versus upper.
Does the hammer candlestick pattern show different signal strength across different timeframes (daily, weekly, monthly)?
Yes, hammer candlestick patterns display varying signal strength across timeframes. Monthly hammers provide the strongest reversal signals with highest reliability. Weekly hammers offer moderate strength with good confirmation rates. Daily hammers generate more frequent signals but with lower reliability. Longer timeframes reduce false signals and indicate more significant trend reversals.
Combining hammer candlesticks with moving averages and support/resistance levels significantly enhances signal reliability. When a hammer forms near support levels and aligns with moving average rebounds, it strengthens reversal signals. This multi-tool approach filters false signals and improves entry point accuracy for trend reversals.
When trading the hammer candlestick pattern, how should you set stop-loss and take-profit levels?
Set stop-loss below the hammer's lower wick, typically 2-3% below. Place take-profit at 1.5-2x the risk-reward ratio, targeting the previous resistance level or using a 5-10% gain target based on volatility.
* The information is not intended to be and does not constitute financial advice or any other recommendation of any sort offered or endorsed by Gate.