This comprehensive guide compares DEGO and BAT as investment opportunities within the cryptocurrency ecosystem. DEGO, launched in 2020, operates as a cross-chain NFT+DeFi protocol enabling NFT creation, mining, and trading, currently ranked #1254 in market cap. BAT, introduced in 2017 by JavaScript and Firefox co-founder Brendan Eich, addresses digital advertising and user incentives through the Brave browser, ranked #190. The analysis examines historical price trends, market status as of January 2026, supply mechanisms, institutional adoption, technological ecosystems, and investment strategies across conservative and aggressive profiles. Current market data shows DEGO at $0.4255 with $26,892.60 daily volume, while BAT trades at $0.177 with $181,494.23 volume on Gate. The article addresses which asset suits different investor types, evaluates risk factors including volatility and liquidity constraints, and presents price projections through 2031 to guide strategic allocation decisions.
Introduction: Investment Comparison Between DEGO and BAT
In the cryptocurrency market, the comparison between DEGO vs BAT has consistently drawn investor attention. These two assets exhibit notable differences in market capitalization ranking, application scenarios, and price performance, while representing distinct positioning within the crypto asset landscape.
DEGO (DEGO): Launched in 2020, this project has gained market recognition through its positioning as a cross-chain NFT+DeFi protocol and infrastructure. DEGO operates as an open NFT ecosystem where users can create NFTs, initiate NFT mining, conduct auctions, and facilitate trading activities.
BAT (BAT): Introduced in 2017, Basic Attention Token was created by JavaScript founder and Mozilla/Firefox browser co-founder Brendan Eich. The token addresses advertising display and user incentive challenges within browsers, establishing itself as a digital asset circulating between advertisers and users.
This article will comprehensively analyze the investment value comparison of DEGO vs BAT across multiple dimensions, including historical price trends, supply mechanisms, institutional adoption, technological ecosystem, and future outlook. We aim to address the question that concerns investors most:
"Which is the better buy right now?"
By examining these two projects with different market capitalizations—DEGO ranked at approximately #1254 and BAT at #190—we will explore how their distinct use cases, from NFT infrastructure to digital advertising solutions, impact their respective investment profiles and potential returns.
I. Price History Comparison and Market Status
DEGO (Coin A) and BAT (Coin B) Historical Price Trends
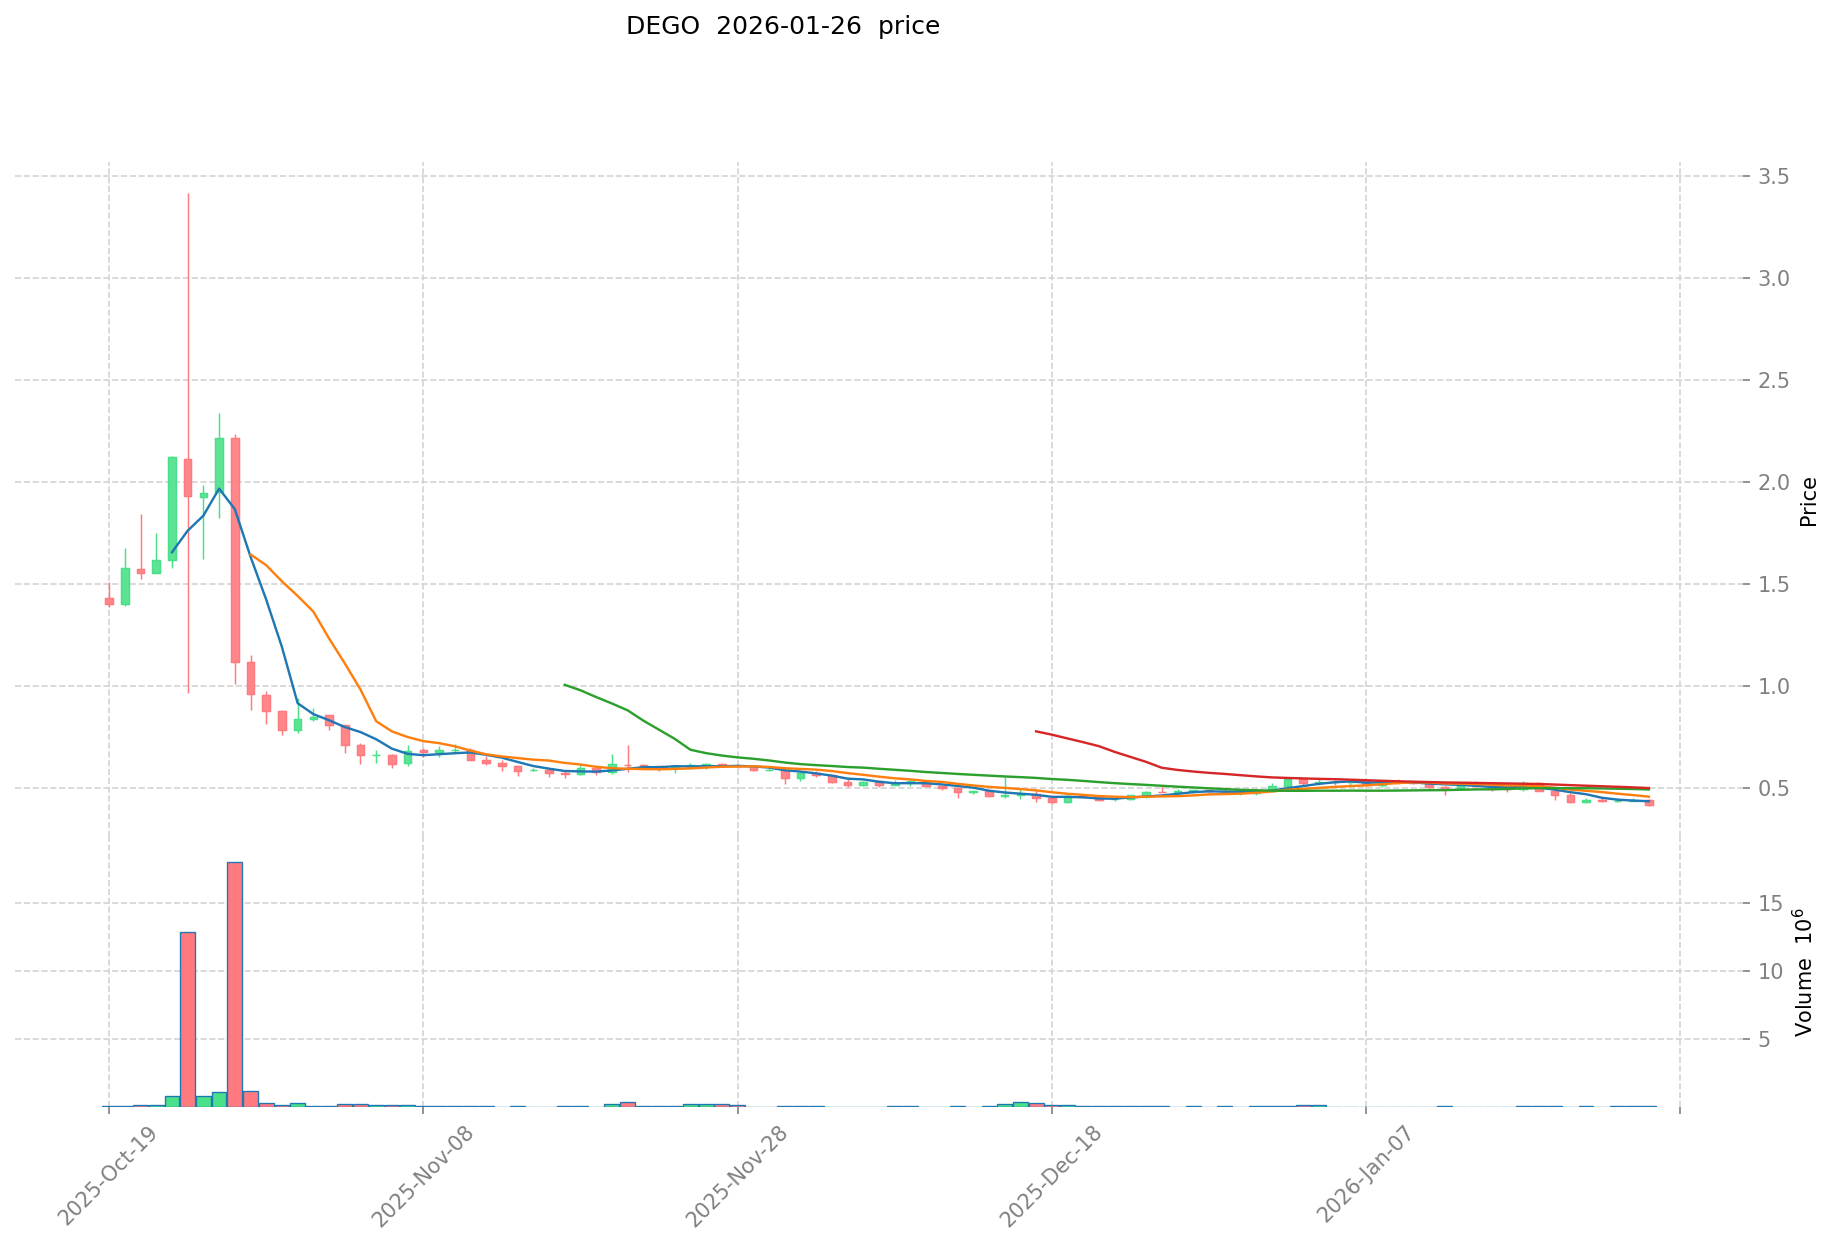
- 2021: DEGO experienced significant volatility, with the price reaching a peak of $33.41 in March 2021. Following this peak, the price underwent a substantial correction.
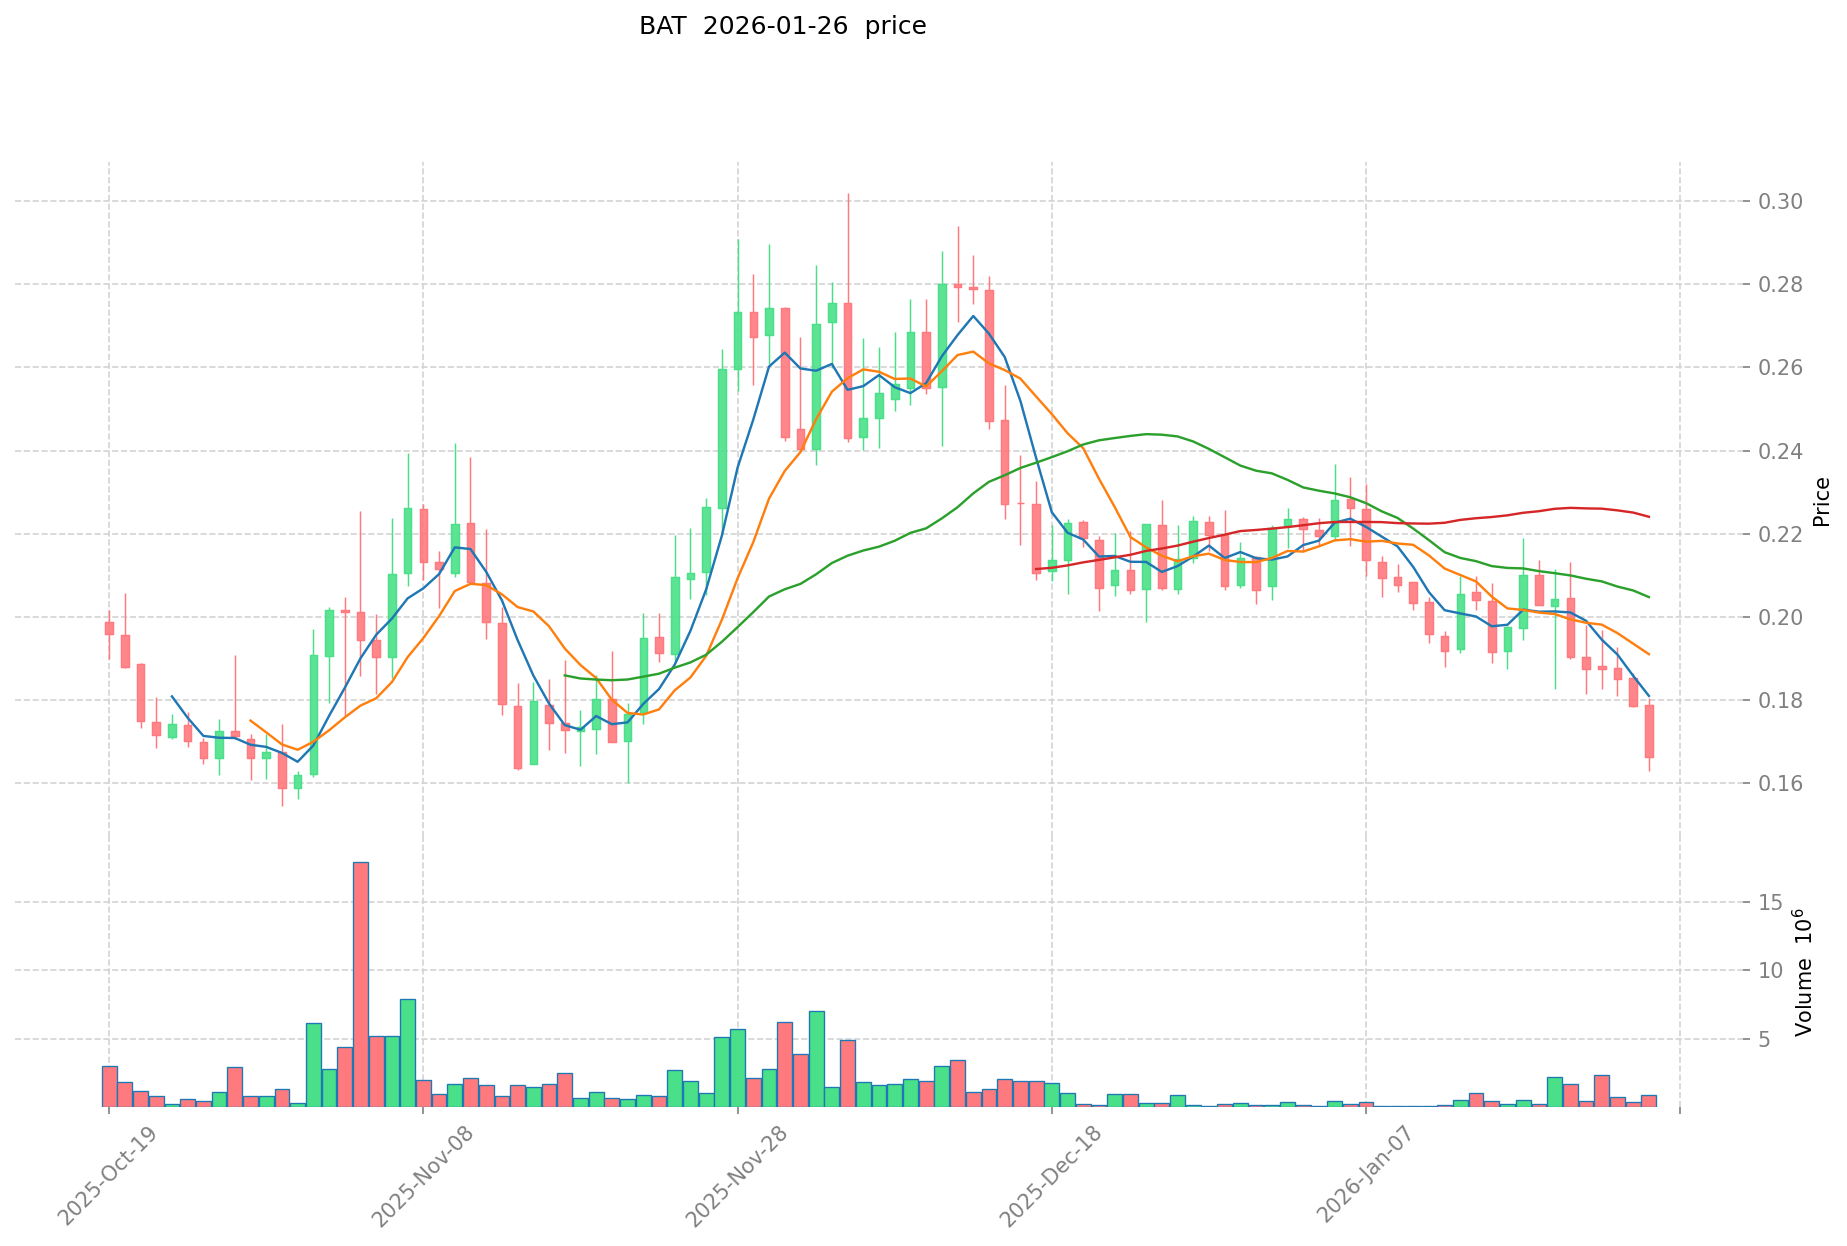
- 2021: BAT reached its highest recorded price of $1.90 in November 2021, driven by increased adoption of the Brave browser and growing interest in privacy-focused digital advertising solutions.
- Comparative Analysis: During the 2021-2025 market cycle, DEGO declined from its high of $33.41 to a low of $0.216349 in October 2025, representing a decrease of approximately 99.4%. Meanwhile, BAT declined from its peak of $1.90 to $0.072394 in July 2017 (initial launch period), though it recovered significantly during subsequent market cycles.
Current Market Status (January 27, 2026)
- DEGO Current Price: $0.4255
- BAT Current Price: $0.177
- 24-Hour Trading Volume: DEGO $26,892.60 vs BAT $181,494.23
- Market Sentiment Index (Fear & Greed Index): 20 (Extreme Fear)
Click to view real-time prices:
II. Core Factors Influencing DEGO vs BAT Investment Value
Supply Mechanism Comparison (Tokenomics)
- DEGO: Current reference materials do not provide specific information regarding DEGO's supply mechanism or tokenomics model.
- BAT: Available materials lack detailed descriptions of BAT's supply structure, including whether it employs fixed supply, deflationary mechanisms, or halving schedules.
- 📌 Historical Pattern: Supply mechanisms have historically played a role in shaping price cycles across crypto assets, though specific data connecting supply dynamics to DEGO and BAT price movements is not available in current materials.
Institutional Adoption and Market Application
- Institutional Holdings: Reference materials do not contain comparative data on institutional preference between DEGO and BAT.
- Enterprise Adoption: Specific applications of DEGO or BAT in cross-border payments, settlement systems, or institutional investment portfolios are not documented in available sources.
- National Policies: Regulatory attitudes toward DEGO and BAT across different jurisdictions are not covered in the provided materials.
Technology Development and Ecosystem Building
- DEGO Technology Upgrades: Current reference materials do not detail specific technical improvements or their potential market impact for DEGO.
- BAT Technology Development: Available sources lack information on BAT's technical roadmap or recent technological advancements.
- Ecosystem Comparison: Comparative analysis of DeFi integration, NFT applications, payment solutions, and smart contract implementations for both assets is not available in the reference materials.
Macroeconomic Environment and Market Cycles
- Performance in Inflationary Environments: Reference materials do not provide evidence comparing the inflation-hedging characteristics of DEGO versus BAT.
- Macroeconomic Monetary Policy: The specific impact of interest rate changes and US Dollar Index fluctuations on both assets lacks documentation in available sources.
- Geopolitical Factors: While geopolitical considerations may influence cross-border transaction demand, specific correlations with DEGO and BAT performance are not addressed in the reference materials.
III. 2026-2031 Price Prediction: DEGO vs BAT
Short-term Forecast (2026)
- DEGO: Conservative $0.310469 - $0.4253 | Optimistic $0.4253 - $0.459324
- BAT: Conservative $0.15903 - $0.1767 | Optimistic $0.1767 - $0.190836
Mid-term Forecast (2028-2029)
- DEGO may enter a consolidation phase, with projected prices ranging from $0.34454335552 to $0.630022135808
- BAT may enter a volatile adjustment phase, with projected prices ranging from $0.1495136448 to $0.262645636032
- Key drivers: institutional capital flows, ETF developments, ecosystem expansion
Long-term Forecast (2030-2031)
- DEGO: Baseline scenario $0.390198303355161 - $0.68455842693888 | Optimistic scenario $0.68455842693888 - $0.828315696596044
- BAT: Baseline scenario $0.13759242352128 - $0.2906046876096 | Optimistic scenario $0.2906046876096 - $0.430094937662208
View detailed price predictions for DEGO and BAT
Disclaimer
DEGO:
| Year |
Predicted High Price |
Predicted Average Price |
Predicted Low Price |
Price Change |
| 2026 |
0.459324 |
0.4253 |
0.310469 |
0 |
| 2027 |
0.47769696 |
0.442312 |
0.34058024 |
3 |
| 2028 |
0.5244051072 |
0.46000448 |
0.4048039424 |
8 |
| 2029 |
0.630022135808 |
0.4922047936 |
0.34454335552 |
15 |
| 2030 |
0.80800338917376 |
0.561113464704 |
0.46572417570432 |
31 |
| 2031 |
0.828315696596044 |
0.68455842693888 |
0.390198303355161 |
60 |
BAT:
| Year |
Predicted High Price |
Predicted Average Price |
Predicted Low Price |
Price Change |
| 2026 |
0.190836 |
0.1767 |
0.15903 |
0 |
| 2027 |
0.23154768 |
0.183768 |
0.16906656 |
3 |
| 2028 |
0.2159641536 |
0.20765784 |
0.1495136448 |
17 |
| 2029 |
0.262645636032 |
0.2118109968 |
0.203338556928 |
19 |
| 2030 |
0.3439810588032 |
0.237228316416 |
0.13759242352128 |
34 |
| 2031 |
0.430094937662208 |
0.2906046876096 |
0.258638171972544 |
64 |
IV. Investment Strategy Comparison: DEGO vs BAT
Long-term vs Short-term Investment Strategies
- DEGO: May appeal to investors focused on NFT infrastructure development and cross-chain DeFi protocol potential, though current market data suggests elevated volatility given its #1254 market cap ranking and limited trading volume ($26,892.60 as of January 27, 2026).
- BAT: May suit investors interested in digital advertising innovation and browser-based utility models, with relatively higher liquidity ($181,494.23 24-hour volume) and established market presence since 2017.
Risk Management and Asset Allocation
- Conservative Investors: Suggested allocation framework could consider DEGO: 20-30% vs BAT: 70-80%, reflecting BAT's relatively higher market capitalization ranking (#190) and established operational history.
- Aggressive Investors: Alternative allocation might explore DEGO: 50-60% vs BAT: 40-50%, acknowledging DEGO's higher volatility profile and potential for price movement.
- Hedging Instruments: Risk management approaches may include stablecoin reserves for portfolio stabilization, options strategies for downside protection, and diversified cross-asset positioning to mitigate concentration risk.
V. Potential Risk Comparison
Market Risks
- DEGO: Exhibits substantial price volatility, having declined approximately 99.4% from its March 2021 peak of $33.41 to October 2025 low of $0.216349. Current trading volume of $26,892.60 suggests limited liquidity, which may amplify price fluctuations during market stress.
- BAT: Demonstrates historical volatility with peak-to-trough movements from $1.90 (November 2021) to lower price levels. Market sentiment as of January 27, 2026 reflects Fear & Greed Index at 20 (Extreme Fear), indicating broader market uncertainty affecting both assets.
Technical Risks
- DEGO: Reference materials do not provide sufficient documentation regarding scalability solutions, network stability metrics, or technical infrastructure resilience.
- BAT: Available sources lack detailed information on computational resource distribution, security audit results, or vulnerability assessment data.
Regulatory Risks
- Global regulatory frameworks continue to evolve for digital assets, with potential differential impacts on NFT-focused platforms versus browser-based advertising tokens. Specific regulatory developments affecting DEGO and BAT across various jurisdictions require ongoing monitoring, though detailed policy analysis is not available in current reference materials.
VI. Conclusion: Which Is the Better Buy?
📌 Investment Value Summary:
- DEGO Characteristics: Positions itself within the NFT and cross-chain DeFi infrastructure space, offering exposure to emerging decentralized application ecosystems. However, the asset demonstrates substantial volatility and limited liquidity based on available market data.
- BAT Characteristics: Represents established positioning in digital advertising and browser utility sectors, with relatively higher market capitalization ranking and trading volume. The project maintains operational history since 2017 with practical application in privacy-focused browsing solutions.
✅ Investment Considerations:
- New Investors: May benefit from prioritizing established market presence and liquidity profiles when evaluating entry points. Comprehensive research into project fundamentals, use case viability, and risk tolerance assessment remains essential before allocation decisions.
- Experienced Investors: Could evaluate portfolio diversification opportunities across different crypto sectors (NFT infrastructure vs. digital advertising), while implementing appropriate position sizing and risk management protocols aligned with individual investment objectives.
- Institutional Participants: Assessment frameworks may incorporate factors such as regulatory clarity, liquidity depth, custody solutions, and correlation analysis with broader portfolio holdings when considering exposure to either asset class.
⚠️ Risk Disclosure: Cryptocurrency markets exhibit high volatility and significant risk of capital loss. This content does not constitute investment advice, financial guidance, or trading recommendations. Investors should conduct independent research and consult qualified financial professionals before making investment decisions.
VII. FAQ
Q1: What is the current market capitalization ranking difference between DEGO and BAT?
DEGO currently ranks approximately #1254 while BAT ranks at #190 in market capitalization. This significant disparity reflects BAT's more established market presence since its 2017 launch compared to DEGO's 2020 introduction. The ranking difference also corresponds to notable variations in trading volume, with BAT demonstrating $181,494.23 in 24-hour volume versus DEGO's $26,892.60 as of January 27, 2026. Higher market cap rankings typically correlate with greater liquidity and potentially lower volatility, though this does not guarantee future performance. Investors should consider these metrics alongside project fundamentals, use case viability, and individual risk tolerance when evaluating allocation decisions between the two assets.
Q2: How do the core use cases of DEGO and BAT differ?
DEGO functions as a cross-chain NFT+DeFi protocol and infrastructure, while BAT operates as a digital advertising solution token. DEGO's ecosystem enables users to create NFTs, initiate NFT mining, conduct auctions, and facilitate trading activities within an open NFT infrastructure. In contrast, BAT addresses advertising display and user incentive challenges within browsers, specifically through the Brave browser ecosystem, establishing a digital asset circulation model between advertisers and users. These fundamentally different applications position DEGO within the emerging NFT and decentralized application infrastructure sector, whereas BAT targets the established digital advertising market with privacy-focused browsing solutions. The distinct use cases influence their respective market adoption patterns and investment risk profiles.
Q3: What was the peak price performance for DEGO and BAT, and how much have they declined?
DEGO reached its highest price of $33.41 in March 2021, subsequently declining to a low of $0.216349 in October 2025, representing approximately 99.4% decrease from peak. BAT achieved its all-time high of $1.90 in November 2021. As of January 27, 2026, DEGO trades at $0.4255 while BAT is priced at $0.177. These substantial declines reflect broader cryptocurrency market cycles and sector-specific dynamics affecting both NFT infrastructure and digital advertising tokens. The magnitude of DEGO's decline from peak exceeds BAT's proportional movement, indicating higher volatility characteristics. Historical price performance does not predict future results, and investors should evaluate current market conditions, project development trajectories, and risk management protocols when assessing potential entry points.
Q4: What is the projected price range for DEGO and BAT in 2026?
For 2026, DEGO conservative estimates range from $0.310469 to $0.4253, while optimistic projections extend from $0.4253 to $0.459324. BAT conservative forecasts span $0.15903 to $0.1767, with optimistic scenarios projecting $0.1767 to $0.190836. These projections reflect baseline analytical models considering current market positioning, historical volatility patterns, and sector-specific factors. The forecasts should not be interpreted as guaranteed outcomes, as cryptocurrency markets remain subject to numerous unpredictable variables including regulatory developments, macroeconomic conditions, technological advancements, and market sentiment shifts. Investors should view price predictions as reference frameworks rather than definitive targets, maintaining appropriate risk management strategies regardless of projected scenarios.
Q5: Which asset demonstrates higher liquidity based on current trading volume?
BAT exhibits significantly higher liquidity with 24-hour trading volume of $181,494.23 compared to DEGO's $26,892.60 as of January 27, 2026. This approximately 6.7x volume differential indicates greater market depth and potentially easier execution for position entry and exit in BAT versus DEGO. Higher liquidity typically reduces slippage during trades, provides tighter bid-ask spreads, and may decrease price impact from individual transactions. The liquidity disparity correlates with BAT's higher market capitalization ranking (#190 vs. #1254) and longer operational history since 2017. For investors prioritizing execution efficiency and position management flexibility, liquidity metrics represent important evaluation criteria alongside other fundamental and technical factors in portfolio construction decisions.
Q6: What suggested allocation frameworks exist for conservative versus aggressive investors?
Conservative investors may consider allocation frameworks of DEGO: 20-30% versus BAT: 70-80%, reflecting BAT's relatively higher market capitalization ranking and established operational presence. This approach prioritizes the more liquid and established asset while maintaining measured exposure to DEGO's NFT infrastructure positioning. Aggressive investors might explore alternative allocations such as DEGO: 50-60% versus BAT: 40-50%, acknowledging DEGO's higher volatility profile and potential for greater price movement. These frameworks represent illustrative examples rather than prescriptive recommendations, as optimal allocation depends on individual risk tolerance, investment timeframes, portfolio diversification objectives, and market condition assessments. All allocation strategies should incorporate appropriate hedging instruments including stablecoin reserves, options strategies, and cross-asset diversification to mitigate concentration risk.
Q7: What are the primary risk factors investors should consider for both assets?
Market risks include substantial price volatility for both assets, with DEGO demonstrating approximately 99.4% decline from peak and limited liquidity based on $26,892.60 trading volume. BAT exhibits historical volatility with peak-to-trough movements, while current market sentiment reflects Fear & Greed Index at 20 (Extreme Fear) as of January 27, 2026. Technical risks involve insufficient documentation regarding scalability solutions, network stability metrics, and security infrastructure for both projects in available reference materials. Regulatory risks encompass evolving global frameworks for digital assets, with potential differential impacts on NFT-focused platforms versus browser-based advertising tokens requiring ongoing monitoring. Investors should acknowledge high cryptocurrency market volatility, significant capital loss potential, and the necessity for independent research and professional financial consultation before making allocation decisions.
Q8: How do the long-term price projections compare for 2030-2031?
For 2030-2031, DEGO baseline scenarios project $0.390198303355161 to $0.68455842693888, with optimistic scenarios extending from $0.68455842693888 to $0.828315696596044. BAT baseline projections range from $0.13759242352128 to $0.2906046876096, with optimistic scenarios spanning $0.2906046876096 to $0.430094937662208. These long-term forecasts incorporate assumptions regarding institutional capital flows, ETF developments, and ecosystem expansion over the projection period. The wide projection ranges reflect inherent uncertainty in multi-year cryptocurrency market predictions. Investors should recognize that long-term forecasts serve as analytical frameworks rather than reliable targets, as numerous unpredictable factors including technological disruption, regulatory changes, competitive dynamics, and macroeconomic conditions may materially impact actual outcomes relative to current projections.
* The information is not intended to be and does not constitute financial advice or any other recommendation of any sort offered or endorsed by Gate.