This comprehensive article compares DESO and DOT, two distinct blockchain ecosystems with different market positioning and investment profiles. DESO focuses on decentralized social media infrastructure since 2021, while DOT operates as a multi-chain interoperability protocol since 2019. The article analyzes historical price trends, tokenomics, institutional adoption, and ecosystem development to help investors understand both assets' characteristics. With current prices at $5.989 (DESO) and $2.146 (DOT), the comparison addresses core investment considerations including staking mechanisms, liquidity profiles, and 2026-2031 price forecasts. Suitable for investors evaluating blockchain infrastructure exposure, the content provides risk assessment and allocation strategies for conservative, aggressive, and institutional participants, helping readers determine which asset aligns with their investment objectives.
Introduction: Investment Comparison Between DESO and DOT
In the cryptocurrency market, the comparison between DESO vs DOT has become a topic that investors cannot overlook. Both assets exhibit significant differences in market cap ranking, application scenarios, and price performance, representing distinct positioning within the crypto asset landscape.
DESO (Decentralized Social): Launched in 2021, this asset has gained market recognition through its positioning as a Layer 1 blockchain built specifically for decentralized social media applications. The platform aims to challenge centralized control of social media by enabling users to monetize their influence and content.
DOT (Polkadot): Since its introduction in 2019, DOT has been recognized as a multi-chain interoperability protocol, connecting various blockchains through its relay chain architecture. It facilitates trustless information and transaction exchange across independent blockchain networks.
This article will comprehensively analyze the investment value comparison between DESO vs DOT, focusing on historical price trends, supply mechanisms, institutional adoption, technical ecosystems, and future predictions, attempting to answer the question that concerns investors most:
"Which is the better buy right now?"
I. Historical Price Comparison and Current Market Status
DESO (Decentralized Social) vs DOT (Polkadot) Historical Price Trends
- 2021: DESO experienced significant volatility, reaching an all-time high of $198.68 in June 2021, reflecting early market enthusiasm for decentralized social blockchain platforms.
- 2021: DOT achieved its historical peak of $54.98 in November 2021, driven by growing interest in cross-chain interoperability solutions and its parachain ecosystem development.
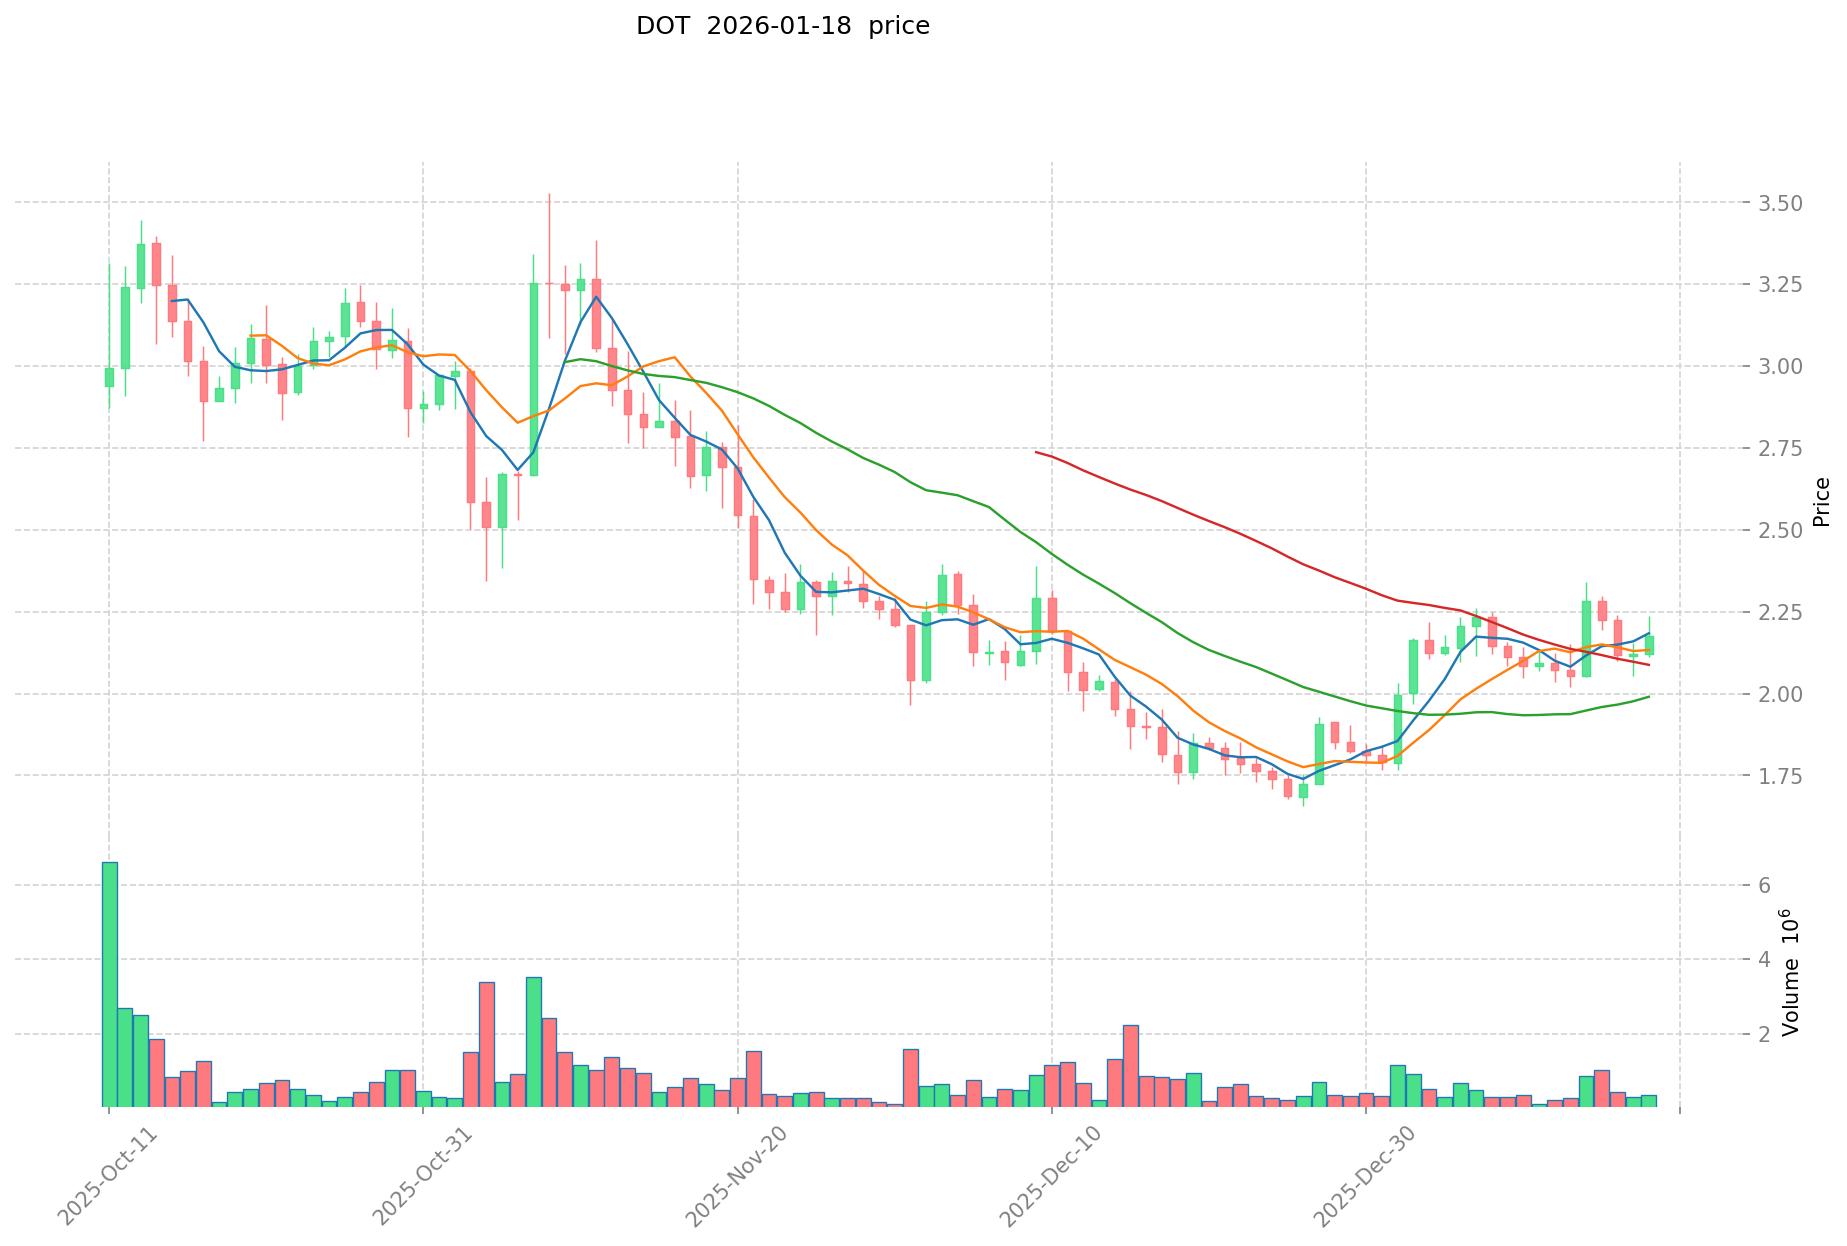
- Comparative Analysis: Throughout the broader market cycle, DESO declined from its peak of $198.68 to a low of $2.7 recorded in November 2024, while DOT decreased from $54.98 to $1.66 in December 2025, indicating both assets experienced substantial corrections during market downturns.
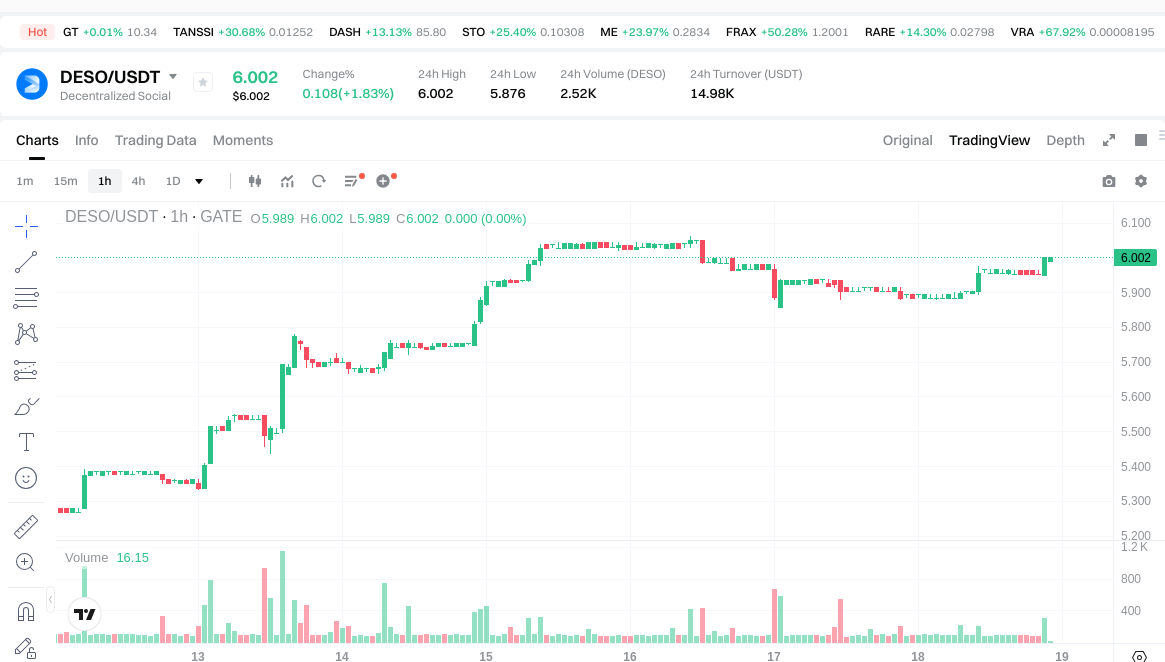
Current Market Status (2026-01-18)
- DESO current price: $5.989
- DOT current price: $2.146
- 24-hour trading volume: DESO at $15,002.80 vs DOT at $517,757.31
- Market sentiment index (Fear & Greed Index): 49 (Neutral)
View real-time prices:
II. Core Factors Influencing DESO vs DOT Investment Value
Supply Mechanism Comparison (Tokenomics)
-
DOT: Polkadot employs an inflationary staking model with approximately 50.60% of circulating supply locked in staking. The network features dynamic supply adjustments through parachain slot auctions, where DOT tokens can be locked for up to 96 weeks, creating artificial scarcity in market circulation.
-
DESO: Reference materials do not provide sufficient information regarding DESO's supply mechanism specifics.
-
📌 Historical Pattern: DOT's supply locking mechanism has demonstrated significant impact on price cycles. During the first parachain auction period, DOT reached its historical peak of $54.98, illustrating how the auction-driven lock-up mechanism creates favorable supply-demand dynamics. The net staking increase of 20 million DOT (valued at $61 million) during price declines from $4.23 to $3.00 indicates sustained investor confidence in long-term value despite market downturns.
Institutional Adoption and Market Application
-
Institutional Holdings: DOT shows measurable institutional participation, with institutional investors holding approximately 8.3% of total supply as of Q3 2025. Major exchanges control over 40% of independent addresses, indicating concentrated institutional positioning.
-
Enterprise Adoption: Reference materials focus primarily on DOT's ecosystem development through parachain projects and cross-chain interoperability infrastructure, though specific enterprise payment or settlement applications are not detailed in available data.
-
National Policy: During October 2025, regulatory uncertainty coincided with significant DOT price volatility, suggesting sensitivity to policy developments. The market experienced notable redistribution effects during regulatory ambiguity periods.
Technology Development and Ecosystem Building
-
DOT Technology Upgrades: Polkadot's parachain slot auction mechanism represents a key technological differentiator, enabling specialized blockchain deployment while maintaining shared security. The network demonstrates growing ecosystem activity with staking participation reaching 80% of network transaction volume during auction periods.
-
DESO Technology Development: Reference materials do not contain adequate information on DESO's technical architecture or development roadmap.
-
Ecosystem Comparison: DOT's ecosystem focuses on cross-chain interoperability and parachain specialization. Active address counts grew to 120,000 with daily transaction volumes exceeding $2 billion in 2025, indicating expanding on-chain activity. However, comparative DeFi, NFT, and smart contract deployment metrics between DESO and DOT are not available in provided materials.
Macroeconomic and Market Cycles
-
Performance Under Inflation: Reference materials do not provide comparative data on inflation-hedging characteristics of either asset.
-
Macroeconomic Monetary Policy: During October 2025 market volatility, DOT experienced significant price movement from $4.08 to $2.94, demonstrating sensitivity to broader market sentiment shifts. Exchange net inflows of 6.6 million DOT during this period reflected panic-selling behavior, suggesting vulnerability to macroeconomic stress conditions.
-
Geopolitical Factors: While specific geopolitical impacts are not detailed in reference materials, the October 2025 downturn coinciding with regulatory uncertainty suggests susceptibility to policy and geopolitical developments. The subsequent accumulation phase (net outflows of 700,000 DOT) as prices stabilized around $3.00 indicates strategic positioning by long-term holders during uncertainty periods.
III. 2026-2031 Price Forecast: DESO vs DOT
Short-term Forecast (2026)
- DESO: Conservative 5.76-6.00 | Optimistic 6.00-6.90
- DOT: Conservative 1.70-2.15 | Optimistic 2.15-2.73
Mid-term Forecast (2028-2029)
- DESO may enter a consolidation phase with projected price range of 5.30-10.22
- DOT may enter an expansion phase with projected price range of 2.11-4.44
- Key drivers: institutional capital inflows, ETF developments, ecosystem growth
Long-term Forecast (2030-2031)
- DESO: Base scenario 7.66-9.15 | Optimistic scenario 9.01-11.43
- DOT: Base scenario 2.46-4.18 | Optimistic scenario 3.87-4.86
View detailed price predictions for DESO and DOT
Disclaimer
DESO:
| Year |
Predicted High Price |
Predicted Average Price |
Predicted Low Price |
Price Change |
| 2026 |
6.9023 |
6.002 |
5.76192 |
0 |
| 2027 |
8.0651875 |
6.45215 |
4.1938975 |
7 |
| 2028 |
8.3474690625 |
7.25866875 |
5.2988281875 |
21 |
| 2029 |
10.2220202671875 |
7.80306890625 |
7.1007927046875 |
30 |
| 2030 |
9.282920924320312 |
9.01254458671875 |
7.660662898710937 |
50 |
| 2031 |
11.434665944399414 |
9.147732755519531 |
6.03750361864289 |
52 |
DOT:
| Year |
Predicted High Price |
Predicted Average Price |
Predicted Low Price |
Price Change |
| 2026 |
2.7305 |
2.15 |
1.6985 |
0 |
| 2027 |
2.977105 |
2.44025 |
1.6349675 |
13 |
| 2028 |
3.873408825 |
2.7086775 |
2.11276845 |
26 |
| 2029 |
4.442908269375 |
3.2910431625 |
2.270819782125 |
53 |
| 2030 |
4.4856918304875 |
3.8669757159375 |
3.7122966873 |
80 |
| 2031 |
4.301623786408875 |
4.1763337732125 |
2.464036926195375 |
94 |
IV. Investment Strategy Comparison: DESO vs DOT
Long-term vs Short-term Investment Strategies
-
DESO: May suit investors interested in decentralized social media infrastructure development and early-stage blockchain social platforms. The asset's historical volatility pattern suggests consideration for higher risk tolerance portfolios focused on emerging use cases in the social media blockchain sector.
-
DOT: May appeal to investors seeking exposure to cross-chain interoperability infrastructure and multi-chain ecosystem development. The staking mechanism with approximately 50.60% of circulating supply locked provides a structural component for long-term holders interested in network participation rewards.
Risk Management and Asset Allocation
-
Conservative Investors: DESO 20-30% vs DOT 70-80%
- Rationale: DOT's established institutional adoption (8.3% institutional holdings), mature staking infrastructure, and parachain ecosystem development suggest relatively lower risk profile compared to DESO's earlier-stage positioning.
-
Aggressive Investors: DESO 40-50% vs DOT 50-60%
- Rationale: Higher DESO allocation for investors willing to accept greater volatility in exchange for potential upside from decentralized social media sector growth.
-
Hedging Tools: Stablecoin allocation (15-25% of portfolio), options strategies for downside protection, cross-asset diversification across different blockchain sectors to reduce concentration risk.
V. Potential Risk Comparison
Market Risk
-
DESO: Experienced significant drawdown from historical peak of $198.68 to $2.7 (approximately 98.6% decline), demonstrating substantial downside volatility during market contractions. Current 24-hour trading volume of $15,002.80 suggests limited liquidity compared to larger market cap assets.
-
DOT: Demonstrated decline from peak of $54.98 to $1.66 (approximately 97% correction), reflecting sensitivity to broader market cycles. The October 2025 period showed notable volatility with exchange net inflows of 6.6 million DOT during panic-selling phases, indicating susceptibility to sentiment-driven selloffs. Current 24-hour trading volume of $517,757.31 provides relatively higher liquidity.
Technical Risk
-
DESO: Reference materials do not provide adequate information regarding network scalability metrics, transaction throughput capacity, or documented technical vulnerabilities.
-
DOT: Parachain slot auction mechanism creates periodic lock-up dynamics that may impact liquidity during auction periods. Exchange concentration exceeding 40% of independent addresses indicates potential centralization concerns in token distribution. Network security depends on relay chain validator set integrity and cross-chain message verification protocols.
Regulatory Risk
- Global Policy Impact: Both assets face regulatory uncertainty in major jurisdictions. DOT's October 2025 price volatility coinciding with regulatory ambiguity demonstrates sensitivity to policy developments. The concentrated exchange holdings (over 40% of addresses) for DOT may create compliance complications if exchange regulations tighten. DESO's positioning in decentralized social media sector may encounter content moderation and data privacy regulatory scrutiny as governments develop frameworks for blockchain-based social platforms.
VI. Conclusion: Which Is the Better Buy?
📌 Investment Value Summary:
-
DESO Characteristics: Represents exposure to decentralized social media infrastructure sector with early-stage positioning. Historical price action demonstrates high volatility range. Limited information availability regarding tokenomics and technical development constrains comprehensive valuation assessment.
-
DOT Characteristics: Established cross-chain interoperability protocol with measurable institutional participation (8.3% institutional holdings). Staking mechanism with approximately 50.60% supply locked creates structural supply dynamics. Active ecosystem development through parachain architecture with 120,000 active addresses and daily transaction volumes exceeding $2 billion in 2025.
✅ Investment Considerations:
-
Newer Participants: Consider starting with smaller position sizes in either asset given the substantial historical volatility both have demonstrated. DOT's more established ecosystem and higher liquidity may provide relatively lower complexity for initial blockchain infrastructure exposure.
-
Experienced Participants: Portfolio allocation between DESO and DOT depends on risk tolerance and sector preference. DOT offers exposure to cross-chain infrastructure with established staking mechanisms, while DESO provides access to decentralized social media sector development with higher uncertainty and potentially higher volatility.
-
Institutional Participants: DOT's existing institutional adoption footprint (8.3% institutional holdings), parachain ecosystem development, and staking infrastructure may align with institutional portfolio requirements. DESO's limited available information regarding supply mechanisms and technical architecture may require additional due diligence for institutional allocation considerations.
⚠️ Risk Disclosure: Cryptocurrency markets exhibit extreme volatility. This content does not constitute investment advice. Both assets have demonstrated substantial price declines exceeding 95% from historical peaks. Market participants should conduct independent research and assess personal risk tolerance before making allocation decisions.
VII. FAQ
Q1: What is the main difference between DESO and DOT in terms of use cases?
DESO focuses on decentralized social media infrastructure, while DOT serves as a cross-chain interoperability protocol. DESO, launched in 2021, positions itself as a Layer 1 blockchain specifically designed for social media applications, enabling users to monetize content and influence while challenging centralized platform control. In contrast, DOT (Polkadot), introduced in 2019, operates as a multi-chain protocol connecting various blockchains through its relay chain architecture, facilitating trustless information exchange across independent networks. The fundamental distinction lies in their target sectors: DESO addresses the social media and content creator economy, whereas DOT tackles blockchain interoperability and cross-chain infrastructure challenges.
Q2: How do the staking mechanisms differ between DESO and DOT?
DOT offers a well-established staking infrastructure with approximately 50.60% of circulating supply locked, while DESO's staking details remain unspecified in available data. Polkadot employs an inflationary staking model with dynamic supply adjustments through parachain slot auctions, where tokens can be locked for up to 96 weeks, creating artificial scarcity. During price declines from $4.23 to $3.00, DOT witnessed a net staking increase of 20 million tokens (valued at $61 million), demonstrating sustained investor confidence despite market downturns. The absence of detailed information about DESO's supply mechanism makes direct comparison challenging for staking-focused investors.
Q3: Which asset has better liquidity and trading volume?
DOT demonstrates significantly higher liquidity with 24-hour trading volume of $517,757.31 compared to DESO's $15,002.80 as of January 18, 2026. This substantial difference—over 34 times higher for DOT—indicates greater market depth and easier entry/exit capability for investors. DOT's higher liquidity reduces slippage risk during larger transactions and provides more reliable price discovery. The concentrated exchange holdings (over 40% of DOT's independent addresses) further contribute to readily available liquidity, though this concentration also presents centralization concerns. For investors prioritizing ease of trading and reduced execution risk, DOT's superior liquidity profile offers clear advantages.
Q4: What are the institutional adoption levels for DESO vs DOT?
DOT shows measurable institutional participation with approximately 8.3% of total supply held by institutional investors as of Q3 2025, while DESO lacks documented institutional adoption data. Major exchanges control over 40% of DOT's independent addresses, indicating concentrated institutional positioning. This established institutional footprint suggests that DOT has achieved recognition within professional investment circles and provides infrastructure that meets institutional portfolio requirements. The absence of comparable data for DESO suggests either limited institutional engagement or insufficient transparency in reporting institutional holdings. For investors seeking validation through institutional participation, DOT presents clearer evidence of professional market acceptance.
Q5: How have both assets performed during market downturns?
Both assets experienced severe drawdowns exceeding 95% from historical peaks, indicating extreme sensitivity to market cycles. DESO declined approximately 98.6% from its June 2021 peak of $198.68 to a low of $2.7 in November 2024, while DOT fell approximately 97% from its November 2021 high of $54.98 to $1.66 in December 2025. During October 2025's regulatory uncertainty, DOT experienced notable volatility with exchange net inflows of 6.6 million tokens during panic-selling phases, demonstrating vulnerability to sentiment-driven selloffs. However, the subsequent accumulation phase (net outflows of 700,000 DOT) as prices stabilized around $3.00 indicated strategic positioning by long-term holders, suggesting some resilience in investor conviction despite adverse market conditions.
Q6: What are the key risks specific to each asset?
DESO faces risks related to limited liquidity ($15,002.80 daily volume), insufficient transparency regarding tokenomics, and uncertainty in the emerging decentralized social media sector, which may encounter content moderation and data privacy regulatory scrutiny. DOT's specific risks include exchange concentration (over 40% of addresses), periodic liquidity constraints during parachain slot auctions, and dependency on relay chain validator set integrity for network security. Both assets demonstrated susceptibility to regulatory developments, with DOT's October 2025 volatility coinciding with regulatory ambiguity. Additionally, both have shown extreme downside volatility during market contractions, with historical drawdowns exceeding 95%, making them unsuitable for risk-averse investors or those unable to withstand substantial capital losses.
Q7: Which asset is more suitable for long-term holding strategies?
DOT appears more suitable for long-term holding strategies based on established infrastructure and staking rewards. The network's staking mechanism with approximately 50.60% of supply locked provides structural incentives for long-term holders, offering network participation rewards through validator staking. DOT's parachain ecosystem development, with 120,000 active addresses and daily transaction volumes exceeding $2 billion in 2025, demonstrates growing on-chain activity and ecosystem maturation. Conversely, DESO's suitability for long-term holding remains uncertain due to limited information about supply mechanisms, technical development roadmap, and ecosystem metrics. For conservative investors seeking lower-risk blockchain infrastructure exposure, a 70-80% DOT allocation versus 20-30% DESO allocation may be appropriate, while aggressive investors might consider 50-60% DOT and 40-50% DESO allocations depending on risk tolerance.
Q8: What are the realistic price expectations for 2026?
For 2026, DESO shows a conservative range of $5.76-$6.00 and an optimistic scenario of $6.00-$6.90, while DOT presents a conservative range of $1.70-$2.15 and an optimistic projection of $2.15-$2.73. Current prices as of January 18, 2026, stand at $5.989 for DESO and $2.146 for DOT, positioning both assets within their respective forecast ranges. These projections suggest limited upside potential in the near term, with DESO showing approximately 15% maximum upside and DOT around 27% maximum upside under optimistic scenarios. The market sentiment index at 49 (Neutral) reflects cautious market conditions. Investors should recognize that both assets have demonstrated extreme historical volatility, and these forecasts represent analytical estimates rather than guaranteed outcomes, requiring independent assessment of personal risk tolerance and investment objectives.
* The information is not intended to be and does not constitute financial advice or any other recommendation of any sort offered or endorsed by Gate.