This comprehensive guide compares DIA and ADA, two distinct blockchain platforms with different market positioning and investment profiles. DIA, launched in 2020, focuses on decentralized financial data infrastructure, while ADA (Cardano), established in 2017, emphasizes research-driven smart contract capabilities. The analysis examines historical price trajectories, current market status showing DIA at $0.2678 and ADA at $0.358, and contrasts liquidity profiles with ADA demonstrating substantially higher trading volume. Key comparison factors include supply mechanisms, institutional adoption patterns, technology ecosystems, and macroeconomic influences. The guide provides investment allocation strategies tailored for conservative (70% ADA) and aggressive (50/50 split) investors, discusses risk management through diversification and hedging, and evaluates market, technical, and regulatory risks specific to each asset. Suitable for investors seeking exposure to data infrastructure versus smart contract platfor
Introduction: DIA vs ADA Investment Comparison
In the crypto asset market, the comparison between DIA vs ADA remains a focal point for investors. These two projects exhibit notable differences in market cap ranking, use cases, and price performance, representing distinct positioning within the digital asset landscape.
DIA (DIA): Launched in 2020, this decentralized information asset platform has gained recognition for its open-source financial data infrastructure that leverages cryptoeconomic incentives for data sourcing and verification.
ADA (ADA): Since its introduction in 2017, Cardano has been positioned as a layered blockchain platform designed to support financial applications and smart contracts with a research-driven approach.
This article will analyze the investment value comparison of DIA vs ADA through historical price trends, supply mechanisms, institutional adoption patterns, technical ecosystems, and forward-looking assessments. The analysis aims to address investors' key consideration:
"Which presents a more compelling opportunity under current market conditions?"
I. Historical Price Comparison and Current Market Status
DIA and ADA Historical Price Trajectories
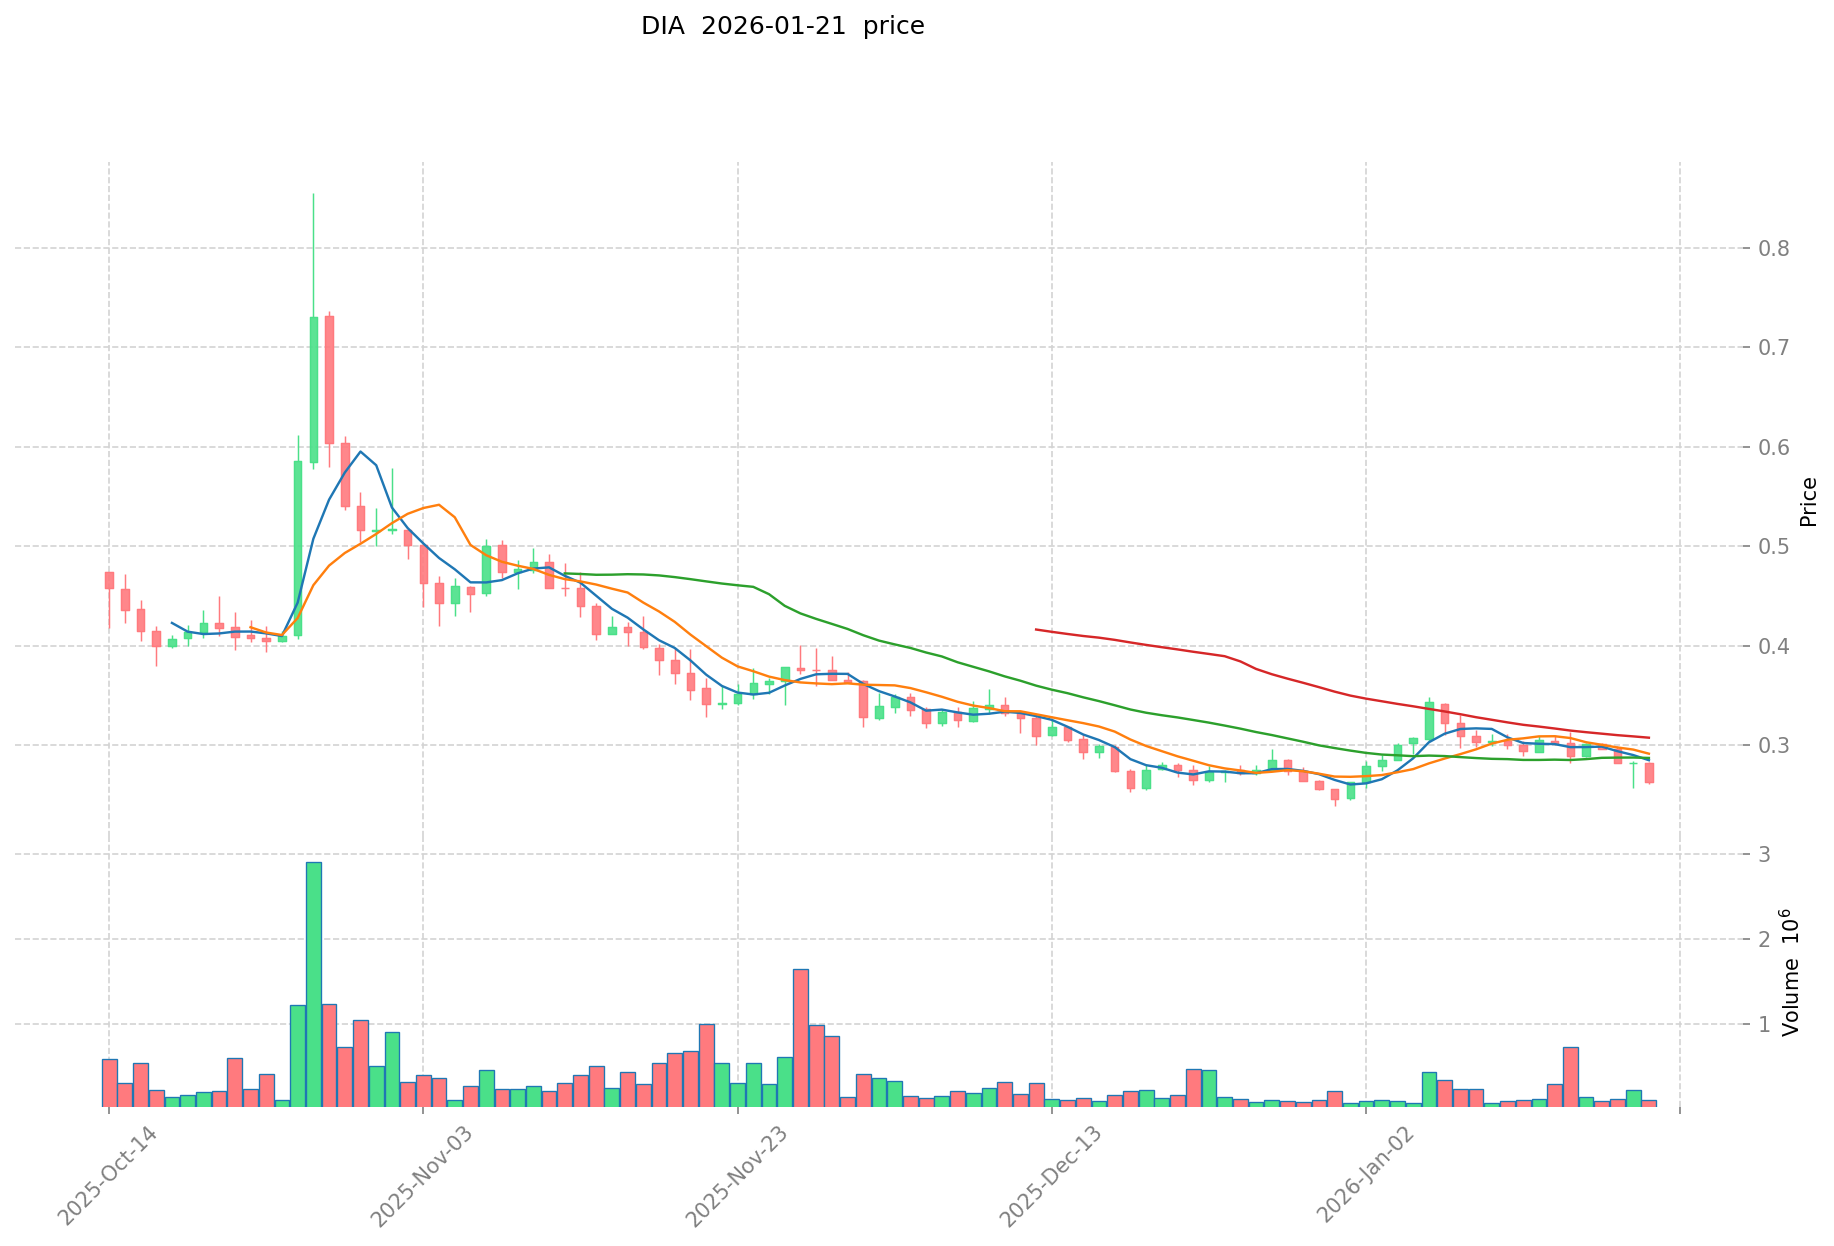
- 2021: DIA reached its all-time high of $5.73 on May 5, 2021, reflecting strong market momentum during the broader cryptocurrency bull market.
- 2023: DIA experienced a significant downturn, recording its all-time low of $0.208951 on September 2, 2023, amid challenging market conditions.
- 2021: ADA achieved its all-time high of $3.09 on September 2, 2021, driven by network development milestones and market enthusiasm.
- 2020: ADA recorded its all-time low of $0.01925275 on March 13, 2020, during the early pandemic-related market volatility.
- Comparative Analysis: During the 2021-2023 market cycle, DIA declined from its peak of $5.73 to a low of $0.208951, representing a substantial contraction. Meanwhile, ADA experienced a decline from $3.09 to $0.01925275 during its respective downturn period, demonstrating similar market cycle patterns.
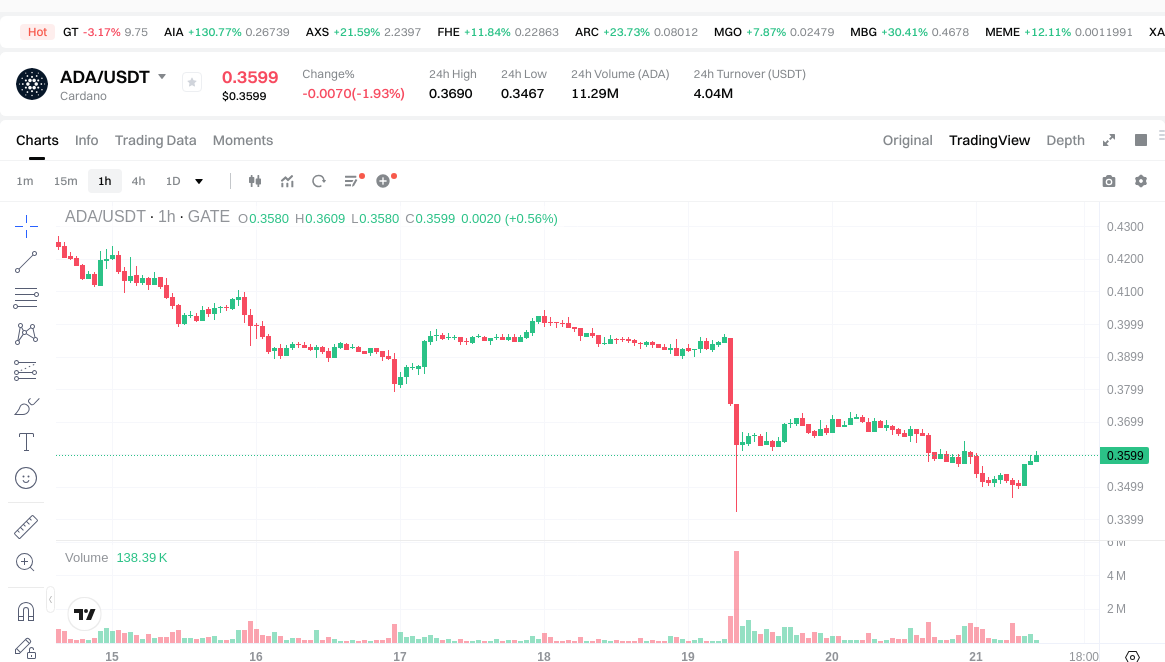
Current Market Status (January 21, 2026)
- DIA Current Price: $0.2678
- ADA Current Price: $0.358
- 24-Hour Trading Volume: DIA recorded $25,318.72 compared to ADA's $4,017,702.33
- Market Sentiment Index (Fear & Greed Index): 24 (Extreme Fear)
View real-time prices:
II. Core Factors Affecting DIA vs ADA Investment Value
Supply Mechanism Comparison (Tokenomics)
Due to limited available data on the specific supply mechanisms of DIA and ADA, a detailed comparison cannot be provided at this time. Generally, different cryptocurrencies adopt varying supply models, such as fixed supply caps, deflationary mechanisms, or inflationary models with scheduled emissions. These mechanisms can influence long-term price dynamics by affecting scarcity and market expectations.
Institutional Adoption and Market Application
Without specific information regarding institutional holdings, enterprise adoption, or regulatory attitudes toward DIA and ADA in different jurisdictions, it is not possible to provide a comprehensive comparison. Institutional interest and real-world applications in areas such as cross-border payments, settlement systems, and investment portfolios can significantly impact the investment value of cryptocurrencies.
Technology Development and Ecosystem Building
Specific details about recent technology upgrades for DIA and ADA, as well as their ecosystem developments in areas such as DeFi, NFTs, payments, and smart contract implementations, are not available in the provided materials. Technology advancement and ecosystem maturity are important factors that can affect the adoption and value proposition of blockchain projects.
Macroeconomic and Market Cycles
The performance of cryptocurrencies during different macroeconomic conditions, such as inflationary environments, varying interest rate policies, and shifts in the U.S. dollar index, can differ based on their characteristics and market positioning. Additionally, geopolitical factors and cross-border transaction demands may influence cryptocurrency adoption and price movements. However, specific comparative analysis between DIA and ADA in these contexts cannot be provided without supporting data.
III. 2026-2031 Price Forecast: DIA vs ADA
Short-term Forecast (2026)
- DIA: Conservative $0.16-$0.27 | Optimistic $0.27-$0.38
- ADA: Conservative $0.35-$0.36 | Optimistic $0.36-$0.39
Mid-term Forecast (2028-2029)
- DIA may enter a growth phase with estimated price range of $0.30-$0.51
- ADA may enter a consolidation phase with estimated price range of $0.23-$0.44
- Key drivers: institutional capital inflows, ETF developments, ecosystem expansion
Long-term Forecast (2030-2031)
- DIA: Baseline scenario $0.25-$0.45 | Optimistic scenario $0.45-$0.53
- ADA: Baseline scenario $0.23-$0.47 | Optimistic scenario $0.43-$0.65
View detailed price predictions for DIA and ADA
Disclaimer
DIA:
| Year |
Predicted High Price |
Predicted Average Price |
Predicted Low Price |
Price Change |
| 2026 |
0.384241 |
0.2687 |
0.16122 |
0 |
| 2027 |
0.34605873 |
0.3264705 |
0.17629407 |
21 |
| 2028 |
0.4505945841 |
0.336264615 |
0.2959128612 |
25 |
| 2029 |
0.5075241834195 |
0.39342959955 |
0.2793350156805 |
46 |
| 2030 |
0.477505504973835 |
0.45047689148475 |
0.337857668613562 |
68 |
| 2031 |
0.528949965981393 |
0.463991198229292 |
0.250555247043817 |
73 |
ADA:
| Year |
Predicted High Price |
Predicted Average Price |
Predicted Low Price |
Price Change |
| 2026 |
0.392291 |
0.3599 |
0.345504 |
0 |
| 2027 |
0.432509825 |
0.3760955 |
0.21813539 |
5 |
| 2028 |
0.432603848875 |
0.4043026625 |
0.23449554425 |
12 |
| 2029 |
0.439375918471875 |
0.4184532556875 |
0.39334606034625 |
16 |
| 2030 |
0.514697504495625 |
0.428914587079687 |
0.227324731152234 |
19 |
| 2031 |
0.651092343186965 |
0.471806045787656 |
0.429343501666767 |
31 |
IV. Investment Strategy Comparison: DIA vs ADA
Long-term vs Short-term Investment Strategies
- DIA: May appeal to investors interested in decentralized data infrastructure and oracle solutions, with a focus on niche technical applications in blockchain ecosystems.
- ADA: May attract investors drawn to research-driven blockchain platforms with emphasis on smart contract capabilities and layered architecture design.
Risk Management and Asset Allocation
- Conservative Investors: DIA 30% vs ADA 70%
- Aggressive Investors: DIA 50% vs ADA 50%
- Hedging Tools: Stablecoin allocation, options strategies, cross-asset portfolio diversification
V. Potential Risk Comparison
Market Risk
- DIA: Trading volume of $25,318.72 indicates relatively lower liquidity, which may result in higher price volatility during market fluctuations.
- ADA: With trading volume of $4,017,702.33, market depth appears more substantial, though still subject to broader cryptocurrency market cycles.
Technical Risk
- DIA: Scalability considerations and network stability factors related to data infrastructure operations.
- ADA: Network expansion challenges and ongoing development implementation requirements.
Regulatory Risk
- Global regulatory developments may affect both assets differently based on their specific use cases and jurisdictional presence, though specific regulatory positions remain evolving.
VI. Conclusion: Which Is the Better Buy?
📌 Investment Value Summary:
- DIA Advantages: Positioned in the decentralized data infrastructure sector with focus on financial data verification mechanisms.
- ADA Advantages: Established presence since 2017 with research-oriented development approach and layered blockchain architecture.
✅ Investment Recommendations:
- Beginner Investors: Consider starting with smaller allocations across both assets while monitoring market conditions, with emphasis on understanding the distinct use cases of each project.
- Experienced Investors: May evaluate portfolio diversification opportunities between data infrastructure exposure (DIA) and smart contract platform positioning (ADA) based on market cycle analysis.
- Institutional Investors: Assess liquidity profiles, with ADA presenting higher trading volumes, while evaluating long-term strategic fit within broader digital asset allocation frameworks.
⚠️ Risk Disclaimer: The cryptocurrency market exhibits significant volatility. This content does not constitute investment advice.
VII. FAQ
Q1: What are the key differences in market liquidity between DIA and ADA?
ADA demonstrates significantly higher market liquidity compared to DIA. As of January 21, 2026, ADA's 24-hour trading volume reached $4,017,702.33, while DIA recorded only $25,318.72. This substantial difference indicates that ADA offers greater ease of entry and exit for investors, with potentially lower slippage and price impact during transactions. The higher liquidity of ADA reflects broader market participation and institutional interest, making it more suitable for larger position sizes. DIA's lower trading volume suggests a more specialized investor base focused on its decentralized data infrastructure niche, which may result in higher volatility during market movements.
Q2: How do the historical price performances of DIA and ADA compare during market cycles?
Both assets experienced significant volatility during the 2021-2023 market cycle, though with different timing and magnitude. DIA reached its all-time high of $5.73 on May 5, 2021, before declining to an all-time low of $0.208951 on September 2, 2023. ADA achieved its peak of $3.09 on September 2, 2021, with its historical low occurring earlier at $0.01925275 on March 13, 2020. The timing differences reflect distinct market positioning: DIA's peak coincided with the broader 2021 cryptocurrency bull market, while ADA's all-time high emerged later during network development milestones. Both assets demonstrated susceptibility to broader market cycles, though their recovery trajectories may differ based on their respective use cases and ecosystem development.
Q3: What investment allocation strategy is recommended for conservative versus aggressive investors?
For conservative investors, a recommended allocation is 30% DIA and 70% ADA, reflecting ADA's higher liquidity profile and more established market presence since 2017. This allocation prioritizes stability through ADA's larger market depth while maintaining exposure to DIA's specialized data infrastructure positioning. Aggressive investors may consider a balanced 50% DIA and 50% ADA allocation to capture potential growth opportunities in both segments. This approach provides equal weighting to the decentralized data infrastructure sector (DIA) and the research-driven smart contract platform space (ADA). Risk management should incorporate stablecoin allocations, options strategies, and cross-asset portfolio diversification regardless of investor profile.
Q4: What are the projected price ranges for DIA and ADA through 2031?
Short-term forecasts for 2026 suggest DIA may trade between $0.16-$0.27 (conservative) and $0.27-$0.38 (optimistic), while ADA is projected at $0.35-$0.36 (conservative) and $0.36-$0.39 (optimistic). Mid-term projections for 2028-2029 estimate DIA's price range at $0.30-$0.51 during a potential growth phase, while ADA may consolidate between $0.23-$0.44. Long-term forecasts for 2030-2031 place DIA between $0.25-$0.45 (baseline) and $0.45-$0.53 (optimistic), with ADA ranging from $0.23-$0.47 (baseline) to $0.43-$0.65 (optimistic). These projections reflect potential ecosystem expansion, institutional capital inflows, and ETF developments, though actual outcomes depend on market conditions and technological adoption rates.
Q5: How does the Fear & Greed Index reading of 24 affect investment decisions for DIA and ADA?
The current Fear & Greed Index reading of 24 indicates "Extreme Fear" in the cryptocurrency market, historically associated with potential buying opportunities for contrarian investors. During extreme fear conditions, assets may trade below their fundamental value due to market pessimism, presenting accumulation opportunities for long-term investors. However, extreme fear can also signal genuine market uncertainty and potential further downside. For DIA and ADA, this environment suggests careful position sizing with consideration of dollar-cost averaging strategies to mitigate timing risk. Investors should balance the potential for discounted entry points against the possibility of continued market deterioration, while maintaining adequate risk management through diversified allocations and hedging instruments.
Q6: What are the primary risk factors that differentiate DIA from ADA as investment options?
Market risk differs substantially between the two assets, with DIA's lower trading volume of $25,318.72 indicating higher liquidity risk and potential price volatility compared to ADA's $4,017,702.33 in daily volume. Technical risks also vary: DIA faces scalability considerations and network stability factors related to its data infrastructure operations, while ADA confronts network expansion challenges and ongoing development implementation requirements. Regulatory risk may affect both assets differently based on their specific use cases, with DIA's focus on financial data verification potentially subject to data governance regulations, while ADA's smart contract platform positioning may face scrutiny related to securities regulations and decentralized application oversight. Both assets remain subject to evolving global regulatory frameworks for digital assets.
Q7: Which asset is more suitable for beginner investors entering the cryptocurrency market?
For beginner investors, starting with smaller allocations across both assets while monitoring market conditions is recommended, with particular emphasis on understanding the distinct use cases of each project. ADA may present a more accessible entry point due to its higher liquidity, longer operational history since 2017, and more established market presence. The lower trading volume of DIA requires greater attention to execution timing and position sizing. Beginners should prioritize education on DIA's decentralized data infrastructure focus versus ADA's research-driven blockchain platform approach. Initial allocations should remain modest, with gradual scaling based on market familiarity and risk tolerance development. Both assets require understanding of cryptocurrency market cycles, wallet security, and fundamental analysis principles before committing significant capital.
Q8: How do institutional investment considerations differ between DIA and ADA?
Institutional investors evaluating DIA versus ADA face distinct liquidity and strategic positioning considerations. ADA's significantly higher trading volume of $4,017,702.33 provides institutional-grade liquidity for larger position sizes with reduced market impact, making it more suitable for institutional portfolio allocations. DIA's lower volume of $25,318.72 presents challenges for institutional-scale deployments, though it offers specialized exposure to decentralized data infrastructure within digital asset frameworks. Strategic fit considerations include ADA's positioning as a research-oriented smart contract platform with established ecosystem development, while DIA provides niche exposure to oracle solutions and financial data verification mechanisms. Institutional investors should assess both assets within broader diversification strategies, considering correlation profiles with existing holdings, regulatory compliance requirements, and alignment with investment mandates focused on blockchain infrastructure or application layers.
* The information is not intended to be and does not constitute financial advice or any other recommendation of any sort offered or endorsed by Gate.