This comprehensive guide mastering Doji candle patterns equips traders with essential technical analysis skills for identifying market indecision and potential trend reversals. The article explores five Doji types—neutral, long-legged, four-price, dragonfly, and gravestone—each revealing distinct market psychology and trading opportunities. Learn proven trading strategies including confirmation techniques, support and resistance applications, volume analysis integration, and proper stop-loss placement across multiple timeframes. Discover how to combine Doji patterns with other technical indicators on Gate exchange and beyond to improve trade accuracy and timing. The guide addresses critical limitations, false signal prevention, and emotional discipline required for successful implementation. Master this powerful candlestick pattern through practical frameworks and risk management principles that separate consistently profitable traders from those chasing random signals.
What is a Doji Candle?
A Doji candle is a candlestick formation that indicates market neutrality, representing a state where buyers and sellers are in equilibrium. This balance results in virtually no net price change during a specific trading period, making it a crucial signal for traders to recognize potential market indecision.
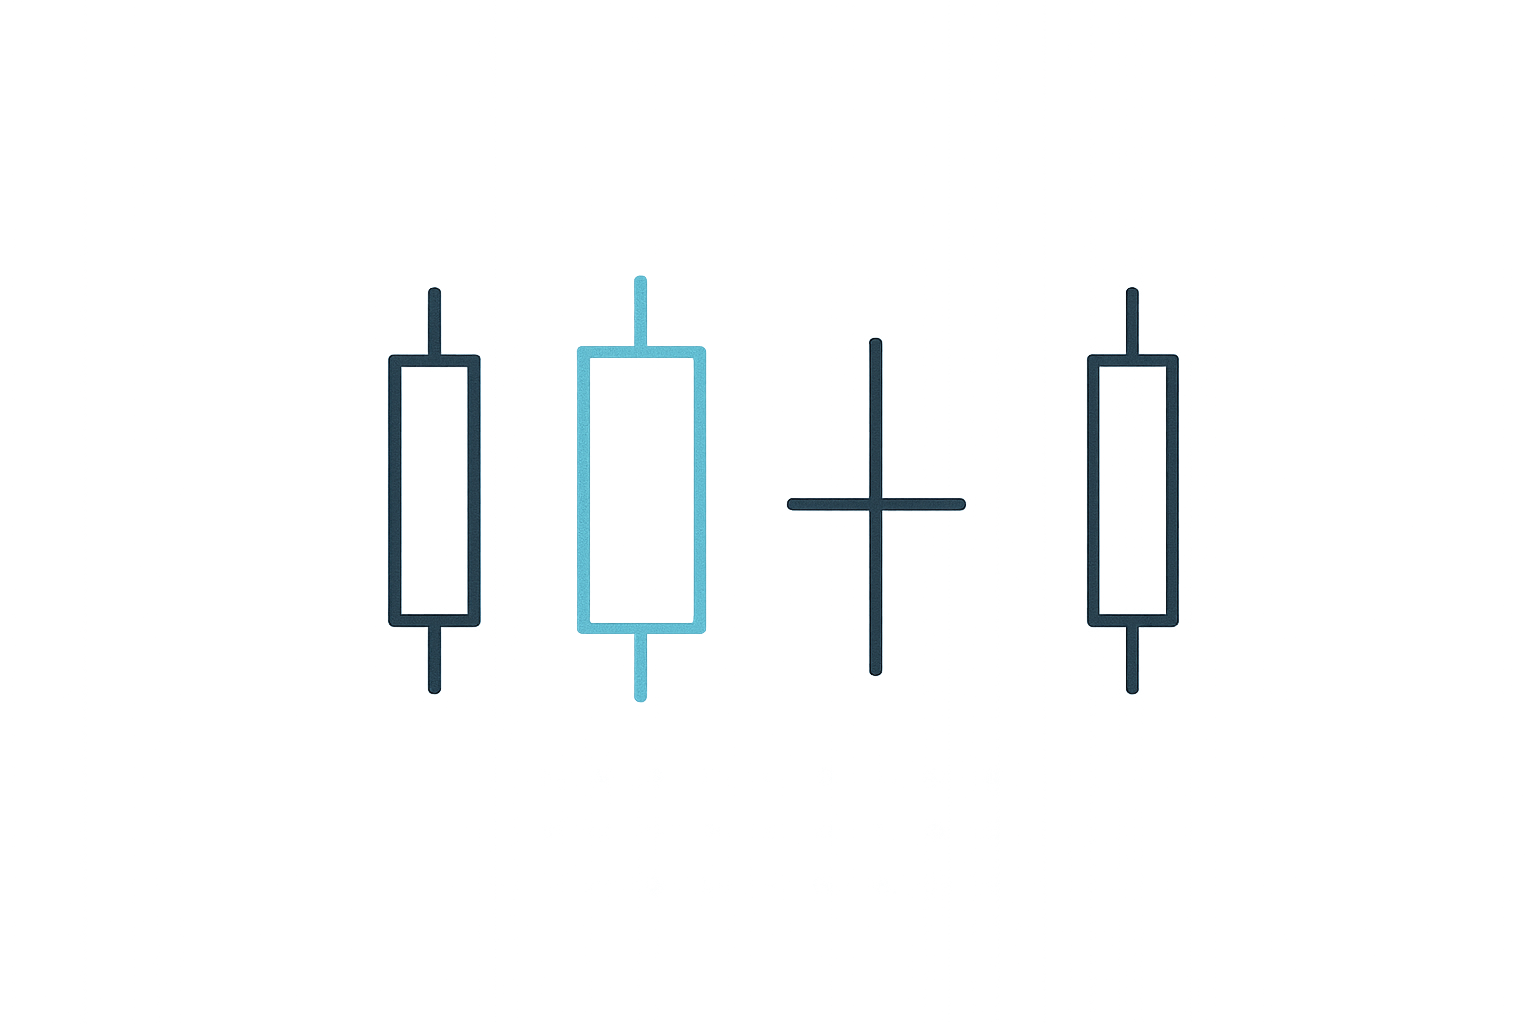
Candlestick patterns provide valuable information about price movements during a particular trading session. Each candle consists of four key data points that tell the story of market activity:
- Opening price at the start of the trading period (shown by the line at the top of the body)
- Closing price at the end of the period (shown by the line at the bottom of the body)
- The highest price during the period (indicated by the end of the upper wick or shadow)
- The lowest price during the period (indicated by the end of the lower wick or shadow)
When the opening and closing prices are very close together or identical, the candle is displayed with wicks but only a very thin line to show the open/close without a candle body. This distinctive formation is what traders call a Doji, and it serves as a powerful indicator of market uncertainty and potential trend changes.
History of Doji Candles
The concept of candlestick patterns originated in Japan, where rice traders developed this visual method to track price movements in the 18th century. The technique was introduced to Western trading by Steve Nison through his groundbreaking book "Japanese Candlestick Charting Techniques," which revolutionized technical analysis in modern markets.
In Japanese, the word "Doji" translates to "mistake" or "error." This naming convention was deliberately chosen for this specific candlestick type to indicate that it represents a kind of "mistake" or anomaly that traders should pay attention to. The term suggests that the market has failed to make a decisive move in either direction, which can be a critical warning sign for traders to reassess their positions and strategies.
Types of Doji Candles and What They Indicate
Neutral Doji
The neutral Doji, also known as the "Star Doji," is characterized by opening and closing prices that are identical or nearly identical. The equally long wicks above and below the body clearly demonstrate that price movements were balanced on both sides, creating a perfect symmetry in the candlestick formation.
During this trading period, neither the bullish nor bearish camp had a significant advantage over the other. Most trades effectively canceled each other out, creating a state of equilibrium. This pattern signals strong indecision in the market, often occurring at critical junctures where traders are uncertain about the next directional move. The neutral Doji is particularly significant when it appears after a prolonged trend, as it may indicate that the prevailing momentum is losing strength.
Long-Legged Doji
The Long-Legged Doji resembles the neutral Doji in its basic structure but features significantly longer wicks extending both above and below the open/close price level. This extended range indicates that considerably more volatility occurred between the high and low prices during the trading session compared to the neutral Doji.
The long wicks tell a story of intense battle between buyers and sellers throughout the period. Prices may have swung dramatically in both directions before ultimately settling back near the opening price. This heightened volatility, combined with the indecisive close, suggests extreme uncertainty and can be a powerful signal of an impending major price movement. Traders often view Long-Legged Dojis as stronger indicators of potential reversals than standard Dojis, especially when they appear at key support or resistance levels.
Four-Price Doji
The Four-Price Doji is the rarest form of Doji candle, appearing completely without any wicks. In this unusual formation, the opening, closing, high, and low prices all converge at a single point on the chart. This phenomenon is extremely uncommon, particularly in liquid markets, as it indicates virtually no price movement whatsoever during the entire trading session.
When a Four-Price Doji does appear, it typically occurs in very low-volume conditions or during periods of extreme market inactivity, such as holidays or overnight sessions in certain markets. While theoretically significant, its practical trading value is limited due to its rarity and the unusual market conditions that produce it.
Dragonfly Doji
A Dragonfly Doji displays opening and closing prices at the same level as the high price for the period, with little to no upper wick. The entire or predominant portion of the wick extends below the body, creating a shape that resembles a dragonfly or the letter "T."
Dragonfly Dojis frequently indicate that a directional change in the market may be imminent, particularly when they appear after a downtrend. This pattern demonstrates that traders rejected lower prices during the session, suggesting strong demand at those levels. The long lower wick shows that sellers pushed prices significantly lower during the period, but buyers stepped in forcefully to drive prices back up to the opening level by the close. This buyer strength can signal the beginning of a bullish reversal, making the Dragonfly Doji a valuable pattern for identifying potential bottoms in price action.
Gravestone Doji
The Gravestone Doji is the mirror opposite of the Dragonfly Doji, with opening and closing prices occurring at the low of the period and a long upper wick extending above. This formation resembles an upside-down "T" or a gravestone, hence its name.
When this pattern appears after an uptrend—which is its typical context—the Gravestone Doji can provide a bearish signal that warns of a potential reversal. The long upper wick indicates that buyers pushed prices significantly higher during the session, but sellers overwhelmed this buying pressure and drove prices back down to the opening level by the close. This rejection of higher prices demonstrates seller strength and waning bullish momentum, suggesting that the uptrend may be exhausting itself and a downward reversal could be approaching.
How to Trade Doji Candlesticks?
-
Wait for Confirmation: A Doji signals indecision and uncertainty in the market, but it is not an immediate trading signal on its own. Avoid entering trades directly after a Doji appears. Instead, exercise patience and wait for the following candle to confirm the direction. A strong bullish candle after a Dragonfly Doji, for example, confirms buying pressure, while a bearish candle following a Gravestone Doji confirms selling pressure. This confirmation reduces the risk of false signals and improves trade accuracy.
-
Use Dojis at Support and Resistance Levels: Dojis gain particular significance when they form at important price levels such as support, resistance, or key Fibonacci retracement levels. A Doji appearing near a strong support level may indicate that buyers are stepping in to defend that level, potentially leading to a bounce. Conversely, a Doji at resistance suggests sellers are active, possibly leading to a rejection. Context is crucial—the same Doji pattern can have different implications depending on where it appears on the chart.
-
Incorporate Volume and Technical Indicators: Combine Doji analysis with trading volume and other technical indicators to strengthen your trading decisions. A Doji accompanied by high trading volume carries more weight than one formed on low volume, as it indicates genuine market participation and indecision. Additionally, use indicators like the Relative Strength Index (RSI) to identify overbought or oversold conditions, or Moving Average Convergence Divergence (MACD) to confirm momentum shifts. This multi-indicator approach provides a more comprehensive view of market conditions.
-
Trade Star Patterns: Recognize and trade classic candlestick patterns that incorporate Dojis as their central element. The Morning Star pattern (bearish candle, Doji, bullish candle) signals a potential bullish reversal at the bottom of a downtrend. The Evening Star pattern (bullish candle, Doji, bearish candle) indicates a possible bearish reversal at the top of an uptrend. These three-candle patterns are among the most reliable trading signals in technical analysis, with the Doji serving as the pivotal middle candle that represents the transition point between trend directions.
-
Intraday Trading Applications: In day trading and scalping strategies, Dojis can be valuable tools for identifying short-term entry and exit points. On lower timeframes such as 5-minute or 15-minute charts, Dojis appear more frequently and can signal temporary pauses in momentum or minor reversals. Day traders can use these formations to time quick entries and exits, though they should be aware that Dojis on shorter timeframes are less reliable than those on daily or weekly charts and require stricter risk management.
-
Implement Proper Stop-Loss Placement: Effective risk management is essential when trading Doji patterns. Place stop-loss orders slightly beyond the extreme point (high or low) of the Doji candle to protect against adverse moves. For a bullish trade based on a Dragonfly Doji, set your stop-loss just below the Doji's low. For a bearish trade based on a Gravestone Doji, place your stop-loss just above the Doji's high. This placement allows the trade some breathing room while limiting potential losses if the pattern fails.
-
Consider Partial Positions and Trend Continuation: Recognize that not every Doji signals a reversal. In strong trending markets, a Doji may simply represent a temporary pause or consolidation before the trend resumes. In such cases, consider taking partial profits if you're already in a position, or use the Doji as an opportunity to add to existing positions in the direction of the prevailing trend once confirmation appears. Understanding the broader market context helps distinguish between reversal Dojis and continuation Dojis.
Psychology Behind Doji Candles
The power of the Doji candle lies in the psychological equilibrium it reveals between market participants. It marks a state of indecision among traders, where neither bulls nor bears have gained control. During the formation of a Doji, buyers temporarily push the price higher while sellers drive it lower, but ultimately the price closes at or very near the opening level. This outcome indicates that despite all the activity during the session, neither side has succeeded in establishing dominance, leaving the market in a state of uncertainty.
When a Doji appears after a sustained trend phase, it often suggests an impending shift in market sentiment and psychology. In an uptrend, a Doji reveals that bullish momentum is waning and bearish resistance is growing stronger. Bulls who have been in control are finding it increasingly difficult to push prices higher, while bears are becoming more aggressive in their selling. This tug-of-war results in the indecisive close characteristic of a Doji.
Conversely, in a downtrend, a Doji indicates that bearish dominance is diminishing and early buyers are beginning to test the market. The sellers who have been driving prices lower are losing their conviction, while opportunistic buyers sense that prices may have fallen too far and begin accumulating positions. This shift in psychology can mark the transition from a downtrend to a potential reversal.
Experienced traders understand that the psychological message of a Doji is incomplete without confirmation. They never trade solely based on the appearance of a Doji but instead wait for the next candle to validate the signal. This confirmation candle reveals which side—bulls or bears—has seized the initiative coming out of the period of indecision. A strong bullish candle following a Doji confirms that buyers have won the psychological battle, while a strong bearish candle confirms seller dominance. This patience in waiting for confirmation is what separates successful Doji traders from those who act prematurely on incomplete signals.
Limitations of Doji Candles – When Not to Use Them
-
Not a Standalone Guarantee: A Doji is not a guaranteed predictor of a reversal or significant price movement. Many Dojis appear without leading to any meaningful change in trend direction. Traders who rely exclusively on Dojis without considering other factors will experience numerous false signals and disappointing results. The Doji should always be viewed as one piece of evidence within a larger analytical framework.
-
False Signals in Low Liquidity Markets: In illiquid markets or on very low timeframes, Dojis frequently form due to random "market noise" rather than genuine indecision among informed traders. These noise-generated Dojis have little predictive value and can lead traders astray. Markets with thin volume, such as certain cryptocurrency pairs during off-hours or small-cap stocks, are particularly prone to producing meaningless Doji formations that should be treated with skepticism.
-
Overabundance in Sideways Markets: During consolidation phases and sideways price action, Dojis become commonplace and therefore lose their significance. When a market is range-bound, the constant back-and-forth between support and resistance naturally produces many Doji candles, but these don't signal anything beyond the ongoing consolidation that is already evident. In such conditions, Dojis provide little actionable information and can distract traders from the more important task of identifying when the range will break.
-
Speed of Action Trade-Off: Waiting for confirmation after a Doji, while prudent for risk management, sometimes costs traders a better entry price. By the time the confirmation candle completes, the price may have moved significantly in the anticipated direction, reducing the potential profit or increasing the risk-to-reward ratio. This trade-off between confirmation reliability and entry timing is an inherent limitation that traders must accept when using Doji-based strategies.
-
Risk of Confusion with Similar Candle Types: It's important to clearly distinguish Dojis from other candlestick patterns that may appear similar but have different implications. Spinning tops, for instance, have small bodies and long wicks but aren't true Dojis because their opening and closing prices are noticeably different. Misidentifying these patterns can lead to incorrect trading decisions. Traders must develop a precise understanding of what constitutes a true Doji versus other indecisive candle formations.
-
Only One Component of Comprehensive Analysis: Dojis should never form the sole basis of trading decisions but must always be integrated into a broader analytical approach. Effective trading requires consideration of multiple timeframes, trend analysis, support and resistance levels, volume patterns, and fundamental factors where applicable. A Doji that appears compelling in isolation may be contradicted by other technical or fundamental evidence, and traders who ignore this context are setting themselves up for losses.
-
Emotional Bias and Projection: Traders often fall into the psychological trap of projecting their own wishes and biases onto Doji patterns. A trader who is hoping for a bullish reversal may see a Dragonfly Doji and immediately interpret it as confirmation of their desired outcome, ignoring contrary evidence. Similarly, a trader with a bearish bias may over-interpret a Gravestone Doji while dismissing bullish indicators. This emotional distortion of objective analysis is a significant limitation not of the Doji itself, but of how traders use it. Maintaining objectivity and emotional discipline is essential when incorporating Dojis into trading strategies.
Conclusion
Doji candles, when viewed in isolation, are not an all-powerful indicator or magical signal that guarantees trading success. However, when properly employed within the context of comprehensive market analysis, they can serve as valuable tools for anticipating trend changes and providing compelling reasons for deeper investigation of market conditions.
A Doji should never be interpreted as a definitive buy or sell signal with 100% certainty. Instead, it functions as an important warning sign that demands closer attention from traders. It signals that the previous momentum has paused and that a new impulse may be developing. This pause in the action is precisely when markets are most vulnerable to directional changes, making the Doji a useful early warning system.
The true value of Doji candles lies not in their predictive power alone, but in their ability to alert traders to changing market dynamics. When a Doji appears, especially at significant price levels or after extended trends, it tells traders to heighten their awareness, reassess their positions, and prepare for potential shifts in market direction. By combining Doji analysis with other technical tools, volume analysis, and proper risk management, traders can incorporate these patterns into robust trading strategies that improve their overall market timing and decision-making capabilities.
Ultimately, mastering Doji candles requires practice, patience, and a commitment to viewing them as part of a holistic trading approach rather than as standalone signals. Traders who develop this balanced perspective will find Dojis to be valuable additions to their technical analysis toolkit.
FAQ
What is a Doji Candle and what does it represent in technical analysis?
A Doji candle is a candlestick pattern where opening and closing prices are equal, signaling market equilibrium between buyers and sellers. It indicates potential trend reversal or consolidation, representing neutral market sentiment and indecision.
How to identify and confirm Doji patterns? What are the different types of Doji?
Doji is a candlestick with minimal or no body, indicating market indecision. Identify it by observing equal or nearly equal open and close prices. Main types include Long-legged Doji with equal upper and lower wicks, Gravestone Doji with long upper wick, and Dragonfly Doji with long lower wick.
How should I trade when Doji candles appear? What are specific trading strategies?
When Doji candles appear, combine with other technical indicators to observe subsequent price movements. If Doji is followed by clear trend reversal signals, consider entering positions. Use support/resistance levels and volume confirmation for validation.
What is the difference between Doji patterns and other candlestick patterns such as Hammer and Hanging Man?
Doji has minimal or zero real body with equal upper and lower wicks, indicating indecision. Hammer and Hanging Man feature longer lower wicks and represent potential trend reversals, but appear in different market contexts—Hammer after downtrends, Hanging Man after uptrends.
How do Doji trading signals differ across different market trends (uptrend, downtrend, consolidation)?
In uptrends or downtrends, Doji signals potential trend reversal. In consolidation phases, Doji indicates the market awaits directional breakthrough. Each trend context produces distinct trading signals from Doji patterns.
What risks should I be aware of when trading Doji, and how do I set a stop loss?
Trading Doji carries reversal failure risk; price may not reverse as expected. Set stop losses based on your risk tolerance, typically 1-2% below entry. Avoid low timeframes where Doji signals contain excessive noise. Always define your maximum loss per trade before entering.
Are there differences in the application of Doji candles across different markets such as forex, stocks, and cryptocurrencies?
Doji candles apply similarly across forex, stocks, and cryptocurrencies. The basic interpretation remains consistent, though specific trading strategies may vary slightly based on market characteristics and volatility levels.
How to combine other technical indicators such as moving averages and support resistance levels to improve the success rate of Doji trading?
Combine moving averages with support and resistance levels to confirm Doji reversals. Use MA crossovers to identify trend strength, and place Doji formations near key support/resistance zones for higher probability trades with better risk-reward ratios.
* The information is not intended to be and does not constitute financial advice or any other recommendation of any sort offered or endorsed by Gate.