This comprehensive guide compares Polkadot (DOT) and Synthetix (SNX), two leading DeFi ecosystem tokens with distinct use cases. DOT operates as a cross-chain interoperability infrastructure with parachain architecture, while SNX functions as a decentralized synthetic asset protocol. The analysis covers historical price trends showing both tokens declined significantly from 2021 peaks, current market status with DOT at $2.135 and SNX at $0.472, and key factors including tokenomics, institutional adoption, and technical development. Price forecasts through 2031 suggest DOT consolidation patterns and SNX potential growth phases. The article provides tailored investment strategies for different investor profiles, identifies market, technical, and regulatory risks, and addresses whether DOT or SNX represents the better investment opportunity based on individual risk tolerance and investment horizons. Check real-time prices on Gate for the latest market data.
Introduction: Investment Comparison Between DOT and SNX
In the cryptocurrency market, the comparison between Polkadot (DOT) and Synthetix (SNX) has been a topic of interest for investors. The two projects differ significantly in market cap ranking, application scenarios, and price performance, representing distinct positioning within the crypto asset space.
Polkadot (DOT): Launched in 2017, it has gained market recognition through its interoperability infrastructure connecting private chains, consortium chains, public chains, open networks, and oracles.
Synthetix (SNX): Introduced in 2018, it serves as a decentralized synthetic asset protocol supporting various composite assets including fiat currencies pegged to USD, precious metals, indices, and other cryptocurrencies.
This article will provide a comprehensive analysis of the investment value comparison between DOT and SNX, covering historical price trends, supply mechanisms, institutional adoption, technical ecosystems, and future forecasts, attempting to address the question investors care about most:
"Which is the better buy right now?"
I. Historical Price Comparison and Current Market Status
Historical Price Trends of DOT (Coin A) and SNX (Coin B)
-
2021: DOT experienced significant price movement, reaching an all-time high of $54.98 in November 2021. During this period, the token benefited from increased adoption of cross-chain infrastructure and parachain auctions on the Polkadot network.
-
2021: SNX saw notable volatility, achieving its all-time high of $28.53 in February 2021. This surge was driven by growing interest in decentralized synthetic assets and the expansion of the DeFi ecosystem.
-
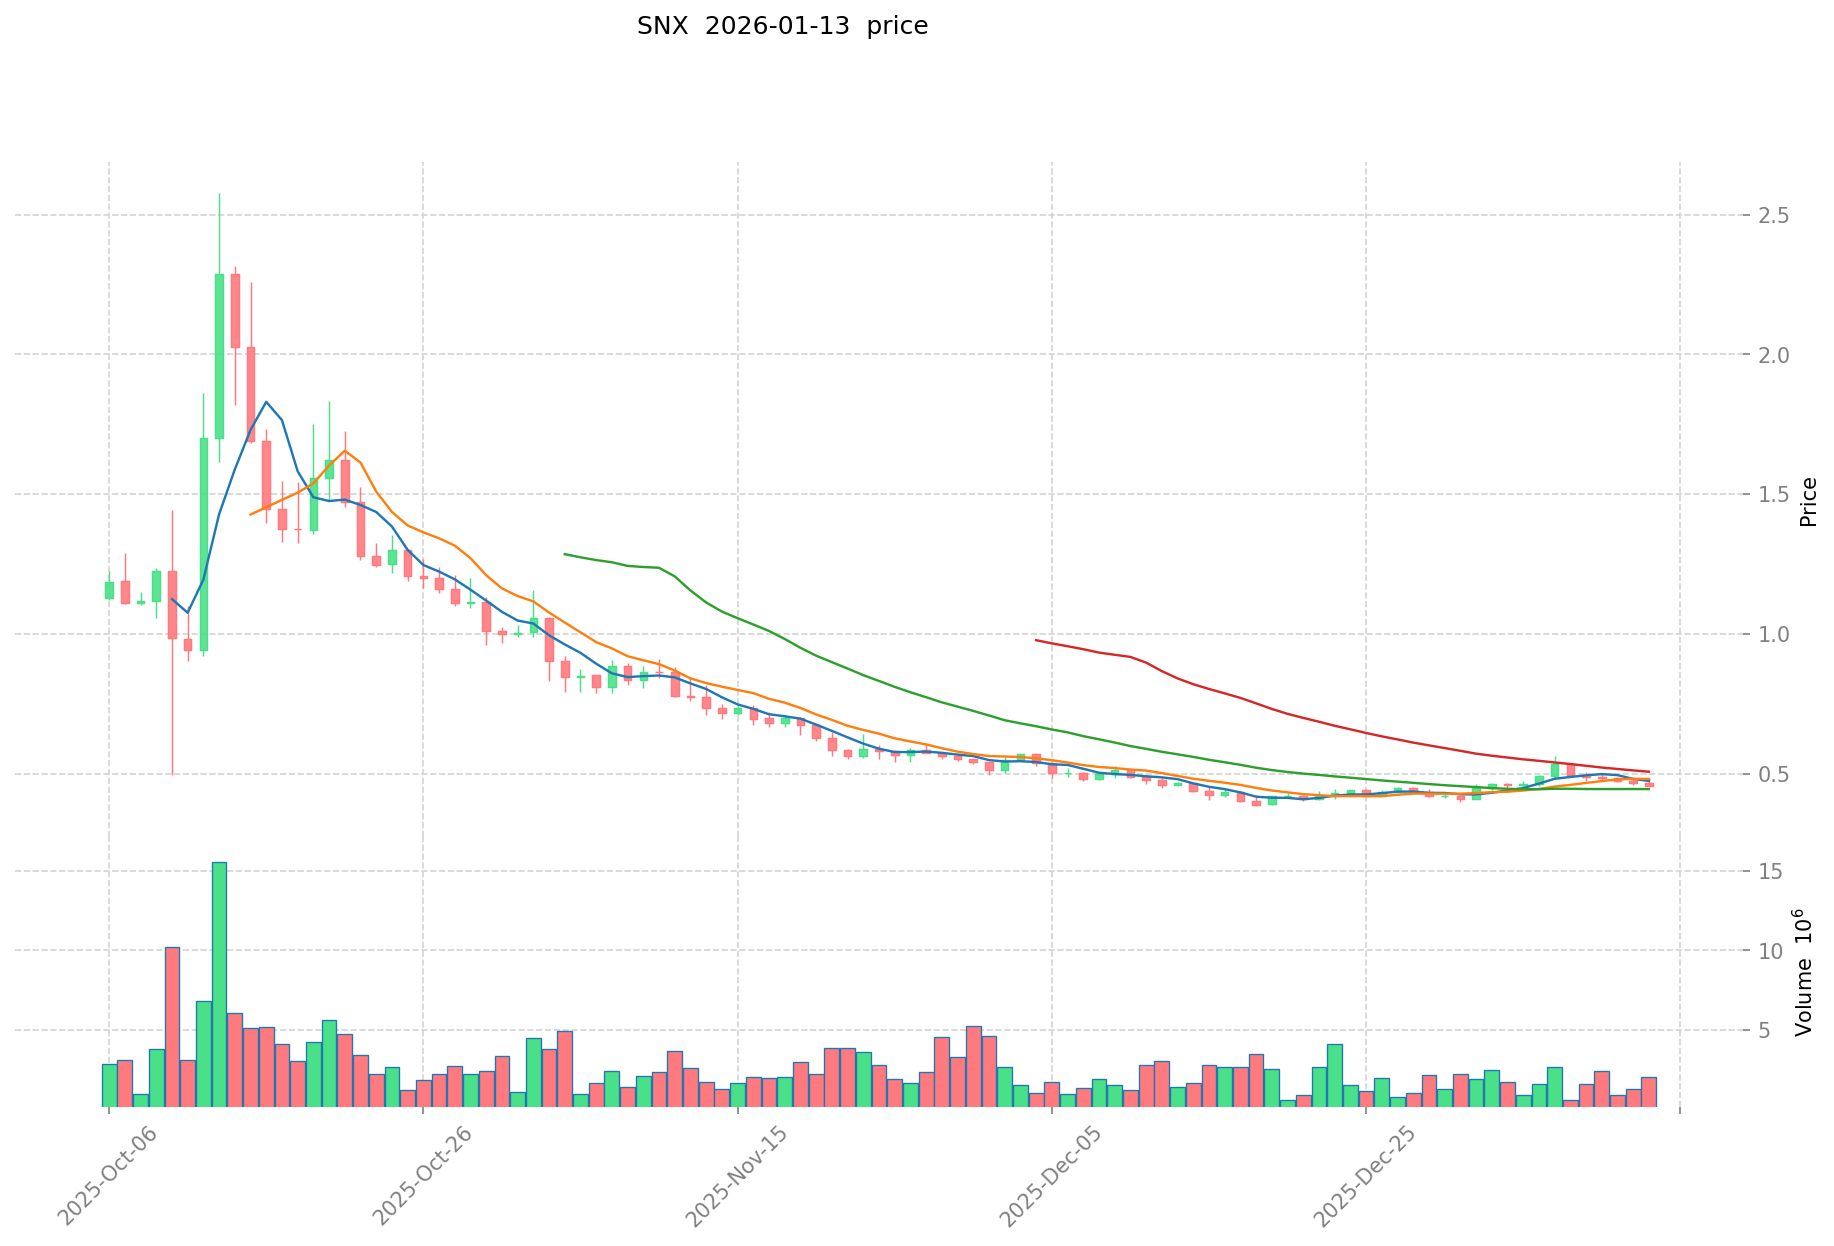
Comparative analysis: During the broader crypto market downturn from 2021 to 2025, DOT declined from its peak of $54.98 to a low of $1.66 in December 2025, representing a substantial correction. Meanwhile, SNX experienced a similar pattern, falling from its high of $28.53 to a low of $0.0347864 in January 2019, demonstrating even more pronounced volatility across market cycles.
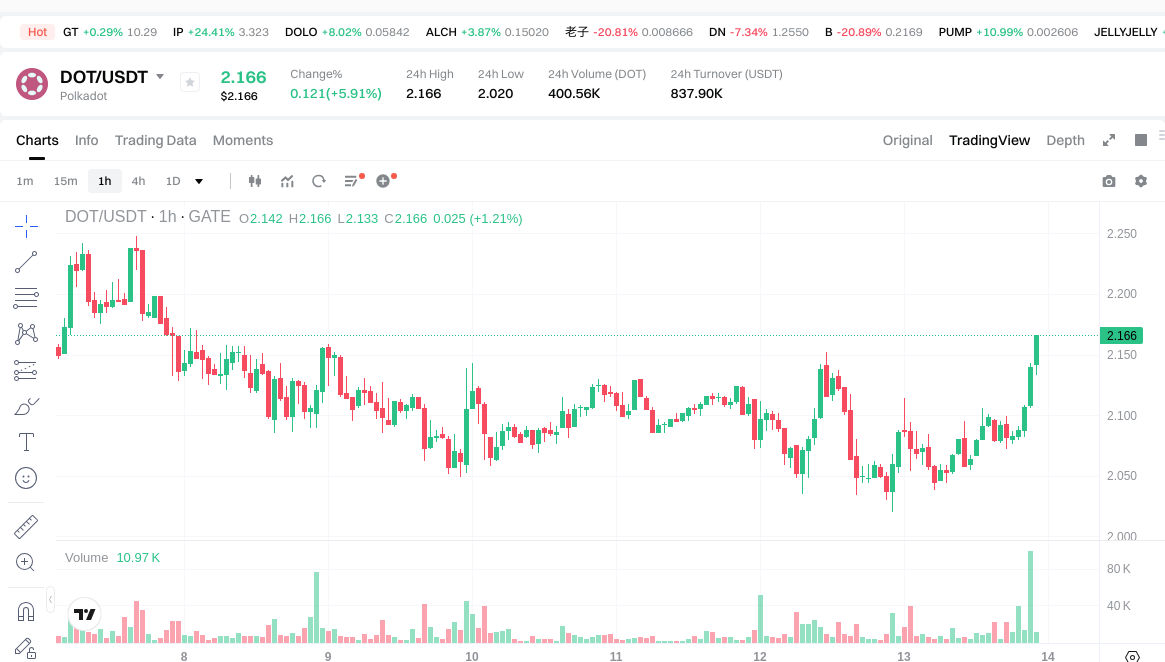
Current Market Status (2026-01-13)
- DOT current price: $2.135
- SNX current price: $0.472
- 24-hour trading volume: DOT recorded $821,566,864.88 compared to SNX's $1,074,297.80
- Market Sentiment Index (Fear & Greed Index): 26 (Fear)
Check real-time prices:
II. Core Factors Influencing DOT vs SNX Investment Value
Supply Mechanism Comparison (Tokenomics)
- DOT: Polkadot employs an inflationary model with dynamic supply adjustments based on network staking participation and governance decisions.
- SNX: Synthetix features a supply mechanism tied to its protocol requirements, where tokens are used for collateralizing synthetic assets within the DeFi ecosystem.
- 📌 Historical Pattern: Supply mechanisms influence price cycles through their impact on token circulation, staking incentives, and protocol utility demand.
Institutional Adoption and Market Application
- Institutional Holdings: Market data suggests varying levels of institutional interest in both assets, with factors including protocol maturity and use case clarity playing significant roles.
- Enterprise Adoption: DOT serves primarily in cross-chain interoperability infrastructure, while SNX functions within decentralized synthetic asset protocols, each serving distinct market segments.
- Regulatory Landscape: Different jurisdictions maintain evolving regulatory frameworks that affect both assets' accessibility and compliance requirements.
Technical Development and Ecosystem Building
- DOT Technical Development: Polkadot continues developing its parachain architecture and cross-chain communication capabilities, potentially expanding its interoperability use cases.
- SNX Technical Evolution: Synthetix focuses on enhancing its synthetic asset protocol, collateralization mechanisms, and decentralized exchange functionality.
- Ecosystem Comparison: DOT emphasizes cross-chain infrastructure and parachain ecosystems, while SNX concentrates on DeFi protocol applications, particularly in synthetic asset creation and trading. Both tokens demonstrate practical utility within their respective protocols rather than serving solely as speculative instruments, with adoption rates and liquidity being key factors in their market positioning.
Macroeconomic Environment and Market Cycles
- Performance in Inflationary Environments: Both assets exhibit characteristics influenced by broader crypto market dynamics and their specific protocol adoption trends.
- Macroeconomic Monetary Policy: Interest rate adjustments, dollar index movements, and global liquidity conditions affect risk asset allocation, including both tokens.
- Geopolitical Factors: Cross-border transaction requirements and international regulatory developments may influence demand for decentralized protocols and interoperability solutions.
III. 2026-2031 Price Forecast: DOT vs SNX
Short-term Forecast (2026)
- DOT: Conservative $1.44-$2.15 | Optimistic $2.15-$2.34
- SNX: Conservative $0.42-$0.47 | Optimistic $0.47-$0.68
Mid-term Forecast (2028-2029)
- DOT may enter a consolidation phase, with projected prices ranging from $2.25 to $3.43
- SNX may enter a growth phase, with projected prices ranging from $0.56 to $1.09
- Key drivers: institutional capital inflows, ETF developments, ecosystem expansion
Long-term Forecast (2030-2031)
- DOT: Baseline scenario $2.32-$3.18 | Optimistic scenario $3.18-$3.44
- SNX: Baseline scenario $0.76-$1.04 | Optimistic scenario $1.04-$1.16
View detailed price predictions for DOT and SNX
Disclaimer
DOT:
| Year |
Predicted High Price |
Predicted Average Price |
Predicted Low Price |
Price Change |
| 2026 |
2.3435 |
2.15 |
1.4405 |
0 |
| 2027 |
3.05558 |
2.24675 |
1.2357125 |
5 |
| 2028 |
3.20790965 |
2.651165 |
2.25349025 |
24 |
| 2029 |
3.42755867025 |
2.929537325 |
2.37292523325 |
37 |
| 2030 |
3.432831837435 |
3.178547997625 |
2.32034003826625 |
48 |
| 2031 |
3.4379175142312 |
3.30568991753 |
2.644551934024 |
54 |
SNX:
| Year |
Predicted High Price |
Predicted Average Price |
Predicted Low Price |
Price Change |
| 2026 |
0.681552 |
0.4733 |
0.416504 |
0 |
| 2027 |
0.82571918 |
0.577426 |
0.4041982 |
22 |
| 2028 |
0.7647141231 |
0.70157259 |
0.561258072 |
48 |
| 2029 |
1.085052167694 |
0.73314335655 |
0.5938461188055 |
55 |
| 2030 |
1.16364513551616 |
0.909097762122 |
0.76364212018248 |
92 |
| 2031 |
1.119281164724606 |
1.03637144881908 |
0.880915731496218 |
119 |
IV. Investment Strategy Comparison: DOT vs SNX
Long-term vs Short-term Investment Strategies
- DOT: May be suitable for investors focused on cross-chain infrastructure development and parachain ecosystem expansion, with consideration for longer holding periods to capture potential protocol adoption growth.
- SNX: May be suitable for investors interested in DeFi synthetic asset protocols and decentralized exchange functionality, with attention to protocol utilization metrics and collateralization dynamics.
Risk Management and Asset Allocation
- Conservative investors: DOT 30-40% vs SNX 10-20%, with remaining allocation to stablecoins and established assets
- Aggressive investors: DOT 40-50% vs SNX 20-30%, with higher exposure to protocol-specific developments
- Hedging tools: stablecoin allocations, diversified portfolio construction across multiple protocols, and consideration of correlation patterns with broader crypto markets
V. Potential Risk Comparison
Market Risk
- DOT: Subject to volatility associated with cross-chain infrastructure adoption rates, parachain auction dynamics, and competitive positioning within interoperability solutions. Trading volume patterns indicate exposure to broader crypto market sentiment shifts.
- SNX: Exposed to volatility related to DeFi protocol usage, synthetic asset demand fluctuations, and collateralization ratio changes. Market performance reflects dependencies on decentralized exchange activity and synthetic asset market conditions.
Technical Risk
- DOT: Considerations include network scalability as parachain adoption increases, consensus mechanism performance, and cross-chain communication protocol stability.
- SNX: Considerations include protocol smart contract security, collateralization mechanism stability, oracle reliability for synthetic asset pricing, and decentralized exchange infrastructure performance.
Regulatory Risk
- Global regulatory frameworks continue evolving for both interoperability infrastructure (DOT) and synthetic asset protocols (SNX), with different jurisdictions maintaining varying approaches to cross-chain solutions and DeFi protocols. Compliance requirements and accessibility may be affected by regulatory developments in key markets.
VI. Conclusion: Which Is the Better Buy?
📌 Investment Value Summary:
- DOT Characteristics: Focuses on cross-chain interoperability infrastructure with parachain ecosystem development. Price forecasts suggest potential consolidation patterns through 2026-2031, with protocol adoption serving as a key metric.
- SNX Characteristics: Operates within DeFi synthetic asset protocol space with decentralized exchange functionality. Forecast models indicate potential growth phases tied to protocol utilization and synthetic asset market expansion.
✅ Investment Considerations:
- New investors: Consider starting with smaller allocations while studying protocol fundamentals, use cases, and market dynamics. Diversification across multiple assets and stablecoin holdings may help manage volatility exposure.
- Experienced investors: Evaluate protocol development progress, ecosystem metrics, and technical roadmaps alongside market positioning. Consider allocation strategies based on risk tolerance and investment timeframes.
- Institutional investors: Assess protocol maturity, liquidity depth, custody solutions, regulatory compliance frameworks, and correlation patterns with broader digital asset markets when determining position sizing.
⚠️ Risk Disclosure: Cryptocurrency markets exhibit high volatility. This content does not constitute investment advice. Conduct thorough research and consider consulting financial professionals before making investment decisions.
VII. FAQ
Q1: What are the main differences between DOT and SNX in terms of their use cases?
DOT focuses on cross-chain interoperability infrastructure, while SNX operates as a DeFi synthetic asset protocol. Polkadot (DOT) serves as the foundational layer connecting private chains, consortium chains, public chains, open networks, and oracles through its parachain architecture. Synthetix (SNX), on the other hand, enables users to create and trade synthetic assets including fiat currencies, precious metals, indices, and cryptocurrencies within the decentralized finance ecosystem. These distinct use cases mean DOT investors are betting on cross-chain infrastructure adoption, whereas SNX investors are focused on synthetic asset market growth and DeFi protocol utilization.
Q2: How have DOT and SNX performed historically compared to their all-time highs?
Both tokens have experienced substantial corrections from their peaks, with DOT declining approximately 96% and SNX falling over 98% from all-time highs. DOT reached its all-time high of $54.98 in November 2021 and has since declined to its current price of $2.135 (as of January 13, 2026), representing a significant correction during the broader crypto market downturn. SNX achieved its peak of $28.53 in February 2021 and currently trades at $0.472, demonstrating even more pronounced volatility. These historical patterns highlight the substantial risk and volatility inherent in both assets, which investors should carefully consider when evaluating entry points.
Q3: Which token is better suited for long-term holding versus short-term trading?
The choice depends on your investment strategy and risk tolerance, with different characteristics favoring each approach. DOT may be more suitable for long-term investors focused on cross-chain infrastructure development and parachain ecosystem expansion, requiring patience to capture potential protocol adoption growth over extended periods. SNX might appeal to investors interested in DeFi protocol dynamics and synthetic asset market trends, with shorter-term opportunities tied to protocol utilization metrics and collateralization changes. Conservative investors might consider DOT allocations of 30-40% versus SNX at 10-20%, while aggressive investors could increase exposure to 40-50% DOT and 20-30% SNX, always maintaining diversification with stablecoins and established assets.
Q4: What are the price forecasts for DOT and SNX through 2031?
Price projections suggest different trajectories, with DOT showing consolidation patterns and SNX indicating potential growth phases. For 2026, DOT forecasts range from $1.44-$2.34 (conservative to optimistic), while SNX projects $0.42-$0.68. By 2031, DOT's baseline scenario suggests $2.32-$3.44, representing a 54% increase from 2026 levels, whereas SNX's baseline projects $0.76-$1.16, indicating a 119% increase over the same period. These forecasts are based on protocol adoption trends, ecosystem expansion, and institutional capital inflows, though actual outcomes may vary significantly due to market volatility and unforeseen developments.
Q5: What are the primary risks associated with investing in DOT versus SNX?
Both tokens face distinct risk profiles related to their specific protocol functions and market positions. DOT risks include cross-chain infrastructure adoption uncertainty, parachain auction dynamics, network scalability challenges as adoption increases, and competitive pressure from other interoperability solutions. SNX faces risks tied to DeFi protocol usage fluctuations, synthetic asset demand volatility, collateralization mechanism stability, smart contract security vulnerabilities, and oracle reliability for pricing synthetic assets. Additionally, both tokens are exposed to broader cryptocurrency market volatility, evolving regulatory frameworks across different jurisdictions, and macroeconomic factors affecting risk asset allocation.
Q6: How do the supply mechanisms of DOT and SNX affect their investment value?
The tokenomics of each project creates different supply dynamics that influence long-term value propositions. DOT employs an inflationary model with dynamic supply adjustments based on network staking participation and governance decisions, meaning token supply can expand or contract according to protocol requirements. This mechanism incentivizes network participation through staking but may create inflationary pressure. SNX features a supply mechanism tied to its protocol's collateralization requirements, where tokens are locked to mint synthetic assets within the DeFi ecosystem. These distinct supply models affect token circulation, staking incentives, and protocol utility demand, ultimately influencing price cycles and investment returns differently for each asset.
Q7: What level of institutional adoption do DOT and SNX currently have?
Institutional interest varies between the two projects based on protocol maturity and use case clarity. Market data suggests different levels of institutional participation, with DOT serving enterprise-level cross-chain interoperability needs and SNX functioning within the DeFi institutional landscape. DOT's focus on infrastructure may attract institutions seeking blockchain interoperability solutions, while SNX appeals to those interested in synthetic asset exposure and decentralized exchange functionality. Institutional considerations include protocol maturity, liquidity depth (DOT's 24-hour volume of $821.5M significantly exceeds SNX's $1.07M), custody solutions, regulatory compliance frameworks, and correlation patterns with broader digital asset markets—all factors that affect institutional position sizing and adoption rates.
Q8: Should new investors start with DOT or SNX?
New investors should consider starting with smaller allocations while thoroughly studying both protocols' fundamentals before committing significant capital. DOT may be more accessible for beginners due to its clearer infrastructure narrative and higher liquidity ($821.5M daily volume versus SNX's $1.07M), which typically means lower slippage and easier entry/exit. However, both tokens require understanding of complex protocol mechanics—cross-chain architecture for DOT and synthetic asset collateralization for SNX. A prudent approach involves diversifying across multiple assets including stablecoins to manage volatility exposure, starting with educational research on use cases and market dynamics, and gradually increasing positions as familiarity grows. Consider consulting financial professionals and never invest more than you can afford to lose given the high volatility of cryptocurrency markets.
* The information is not intended to be and does not constitute financial advice or any other recommendation of any sort offered or endorsed by Gate.