This comprehensive guide compares DYDX and XLM, two leading blockchain assets with distinct market positions and utility functions. DYDX operates as a governance token for decentralized derivatives trading, while XLM facilitates cross-border payments through institutional partnerships. The analysis covers historical price trends, current market status as of January 2026, and tokenomics comparison, revealing XLM's larger market capitalization of $7.38 billion versus DYDX's $162.08 million. Key investment factors include institutional adoption patterns, technology development, supply mechanisms, and macroeconomic influences affecting both assets. Price forecasts through 2031 indicate potential appreciation for both tokens, with XLM projecting $0.363-$0.560 and DYDX targeting $0.316-$0.436. Investment strategy recommendations vary by risk profile, from conservative XLM-weighted allocations to aggressive diversified approaches, alongside comprehensive risk assessment across market, technical, and regulatory dimen
Introduction: Investment Comparison Between DYDX and XLM
In the cryptocurrency market, the comparison between DYDX vs XLM continues to be a topic of interest for investors. Both assets show notable differences in market cap ranking, application scenarios, and price performance, representing distinct positioning within the crypto asset landscape.
DYDX: Launched in 2021, this governance token has gained market recognition through its positioning in decentralized derivatives trading and perpetual contract exchange infrastructure.
XLM (Stellar): Operating since 2014, it has established itself as a facilitator of cross-border value transfer, enabling fast and low-cost asset movement between banks, payment institutions, and individuals.
This article will provide a comprehensive analysis of DYDX vs XLM investment value comparison, covering historical price trends, supply mechanisms, institutional adoption, technical ecosystem, and future projections, attempting to address investors' key question:
"Which is the better buy right now?"
I. Historical Price Comparison and Current Market Status
DYDX and XLM Historical Price Trends
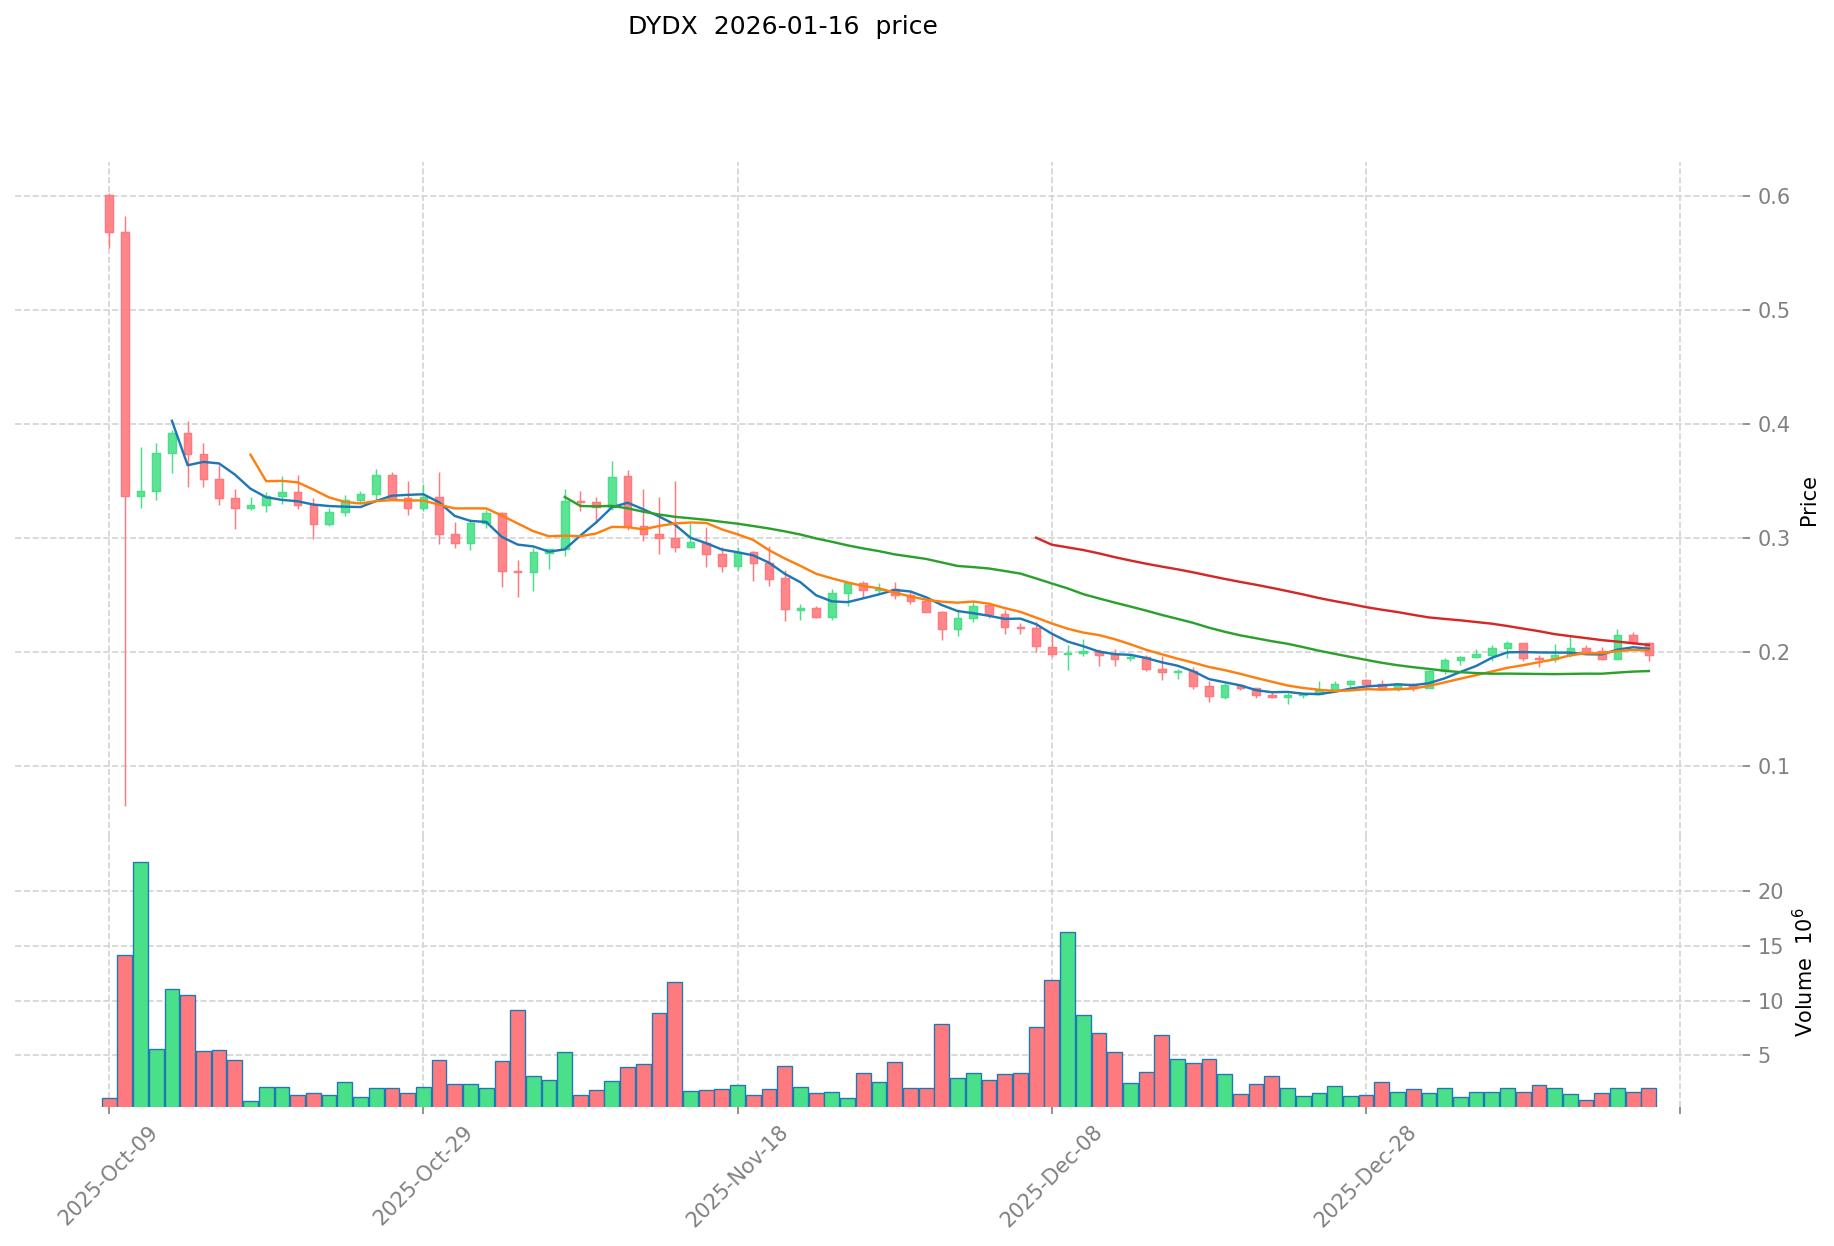
- 2024: DYDX experienced significant volatility, with its price reaching a notable high of $4.52 on March 8, 2024. However, the token has since declined substantially from this peak.
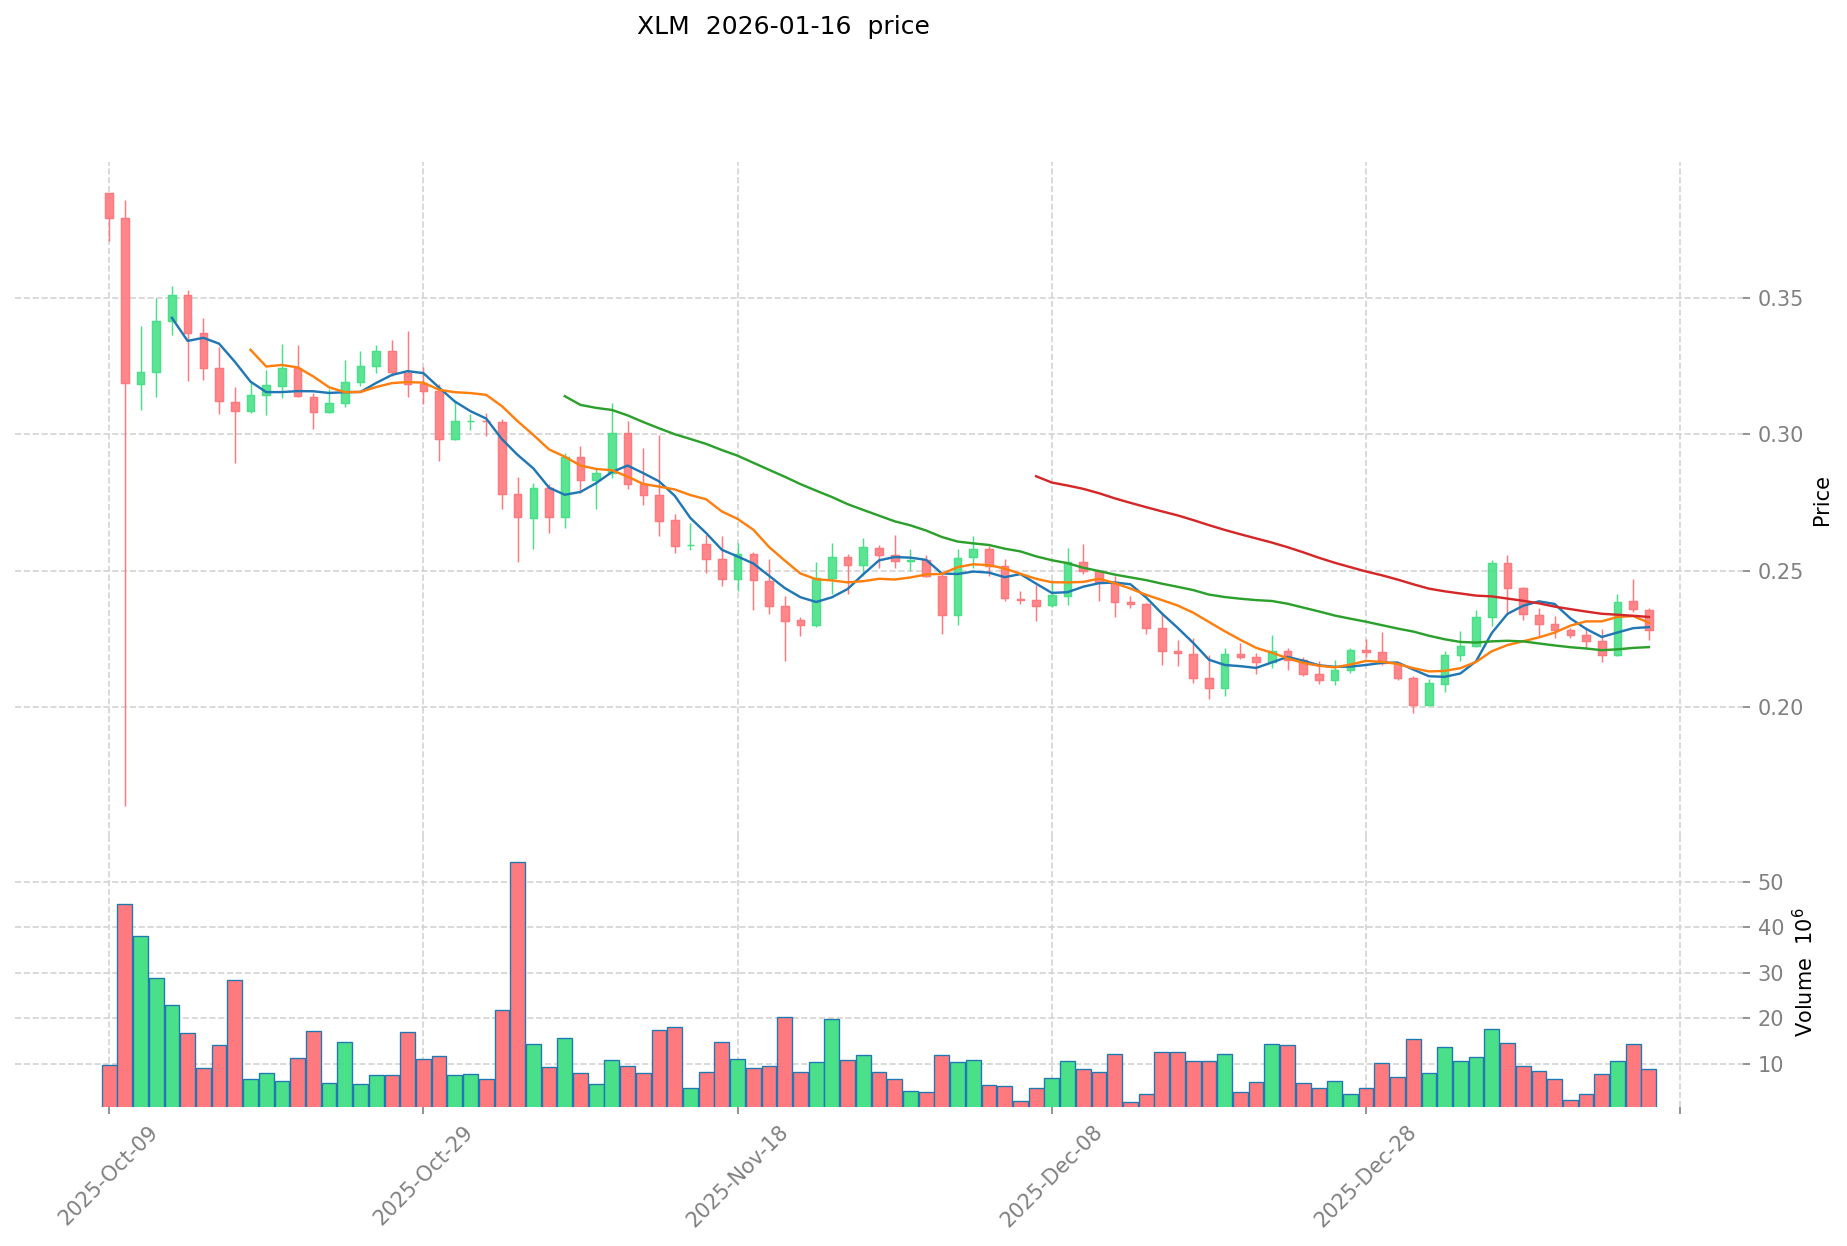
- 2018: XLM saw considerable appreciation during the broader cryptocurrency market rally, reaching its all-time high of $0.875563 on January 3, 2018. The token demonstrated resilience during various market cycles.
- 2025: DYDX recorded its historical low price of $0.126201 on October 11, 2025, reflecting significant downward pressure throughout the year.
- Comparative Analysis: During recent market cycles, DYDX has declined from its March 2024 peak of $4.52 to current levels around $0.1976, representing substantial depreciation. In comparison, XLM has maintained relative stability, trading within a more moderate range despite market fluctuations.
Current Market Status (January 16, 2026)
- DYDX Current Price: $0.1976
- XLM Current Price: $0.22769
- 24-Hour Trading Volume: DYDX recorded $372.76 million compared to XLM's $1.90 billion
- Market Capitalization: DYDX stands at $162.08 million, while XLM maintains a significantly larger market cap of $7.38 billion
- Market Sentiment Index (Fear & Greed Index): 49 (Neutral)
View Real-Time Prices:
- Check DYDX Current Price Market Price
- Check XLM Current Price Market Price
II. Core Factors Influencing DYDX vs XLM Investment Value
Supply Mechanism Comparison (Tokenomics)
-
DYDX: The token supply mechanism relates to its governance and staking functions within the derivatives trading platform. Market sentiment and trading activity on the dYdX platform may influence token demand dynamics.
-
XLM: Stellar operates with a pre-mined supply model. The Stellar Development Foundation (SDF) holds a portion of the total XLM supply, and any distribution strategy changes could impact market dynamics and token valuation.
-
📌 Historical Pattern: Supply mechanisms tend to influence price cycles through token distribution events, staking incentives, and circulation changes that affect market liquidity.
Institutional Adoption and Market Application
-
Institutional Holdings: XLM has attracted attention from institutional players through partnerships with entities such as IBM and Mercado Libre, enhancing its credibility in cross-border payment solutions. DYDX's institutional interest primarily stems from derivatives trading applications.
-
Enterprise Adoption: XLM focuses on facilitating fast and low-cost cross-border transactions, particularly in remittance markets and financial inclusion initiatives. DYDX serves the decentralized derivatives trading sector, offering perpetual contracts and margin trading capabilities.
-
National Policies: Regulatory environments significantly impact both assets. Clear and supportive regulatory frameworks for blockchain-based financial services can boost investor confidence in XLM, while regulatory uncertainty may pose challenges. DYDX faces regulatory considerations related to derivatives trading and decentralized finance protocols.
Technology Development and Ecosystem Building
-
DYDX Technology Development: The platform's evolution centers on enhancing derivatives trading infrastructure, including orderbook functionality, margin trading mechanisms, and decentralized exchange features.
-
XLM Technology Advancement: Stellar's development includes improvements to the Stellar Consensus Protocol (SCP), which ensures fast finality and scalability. Network updates aim to enhance token scalability, security, and competitiveness against alternatives such as Ripple (XRP) and traditional payment systems.
-
Ecosystem Comparison: XLM's ecosystem emphasizes cross-border payments, remittances, and financial institution integration. DYDX operates within the DeFi derivatives trading space. Both assets participate in their respective sectors with varying degrees of smart contract utilization and decentralized application development.
Macroeconomic Environment and Market Cycles
-
Performance in Inflationary Environments: Market volatility affects both assets through broader cryptocurrency trends and investor sentiment shifts influenced by macroeconomic conditions.
-
Macroeconomic Monetary Policy: Interest rate changes and monetary policy adjustments can influence cryptocurrency market dynamics. Regulatory clarity or restrictions in key markets may impact adoption rates and trading volumes for both DYDX and XLM.
-
Geopolitical Factors: Cross-border transaction demand may benefit XLM given its focus on international payments and financial inclusion. DYDX's value relates more closely to derivatives market activity and trading sentiment within the cryptocurrency sector.
III. 2026-2031 Price Forecast: DYDX vs XLM
Short-term Forecast (2026)
- DYDX: Conservative $0.183-$0.197 | Optimistic $0.197-$0.215
- XLM: Conservative $0.179-$0.227 | Optimistic $0.227-$0.234
Mid-term Forecast (2028-2029)
- DYDX may enter a consolidation phase with estimated price range of $0.184-$0.325
- XLM may enter a growth phase with estimated price range of $0.182-$0.318
- Key drivers: institutional capital inflows, ETF developments, ecosystem expansion
Long-term Forecast (2030-2031)
- DYDX: Baseline scenario $0.236-$0.340 | Optimistic scenario $0.340-$0.436
- XLM: Baseline scenario $0.165-$0.378 | Optimistic scenario $0.378-$0.560
View detailed price predictions for DYDX and XLM
Disclaimer
DYDX:
| Year |
Predicted High Price |
Predicted Average Price |
Predicted Low Price |
Price Change |
| 2026 |
0.214948 |
0.1972 |
0.183396 |
0 |
| 2027 |
0.2988073 |
0.206074 |
0.19370956 |
4 |
| 2028 |
0.2600138695 |
0.25244065 |
0.1842816745 |
27 |
| 2029 |
0.3254086198825 |
0.25622725975 |
0.15373635585 |
29 |
| 2030 |
0.389696039353775 |
0.29081793981625 |
0.235562531251162 |
47 |
| 2031 |
0.435528946668816 |
0.340256989585012 |
0.316439000314061 |
72 |
XLM:
| Year |
Predicted High Price |
Predicted Average Price |
Predicted Low Price |
Price Change |
| 2026 |
0.2339027 |
0.22709 |
0.1794011 |
0 |
| 2027 |
0.3388296345 |
0.23049635 |
0.1728722625 |
1 |
| 2028 |
0.3045894017075 |
0.28466299225 |
0.18218431504 |
25 |
| 2029 |
0.31819629273705 |
0.29462619697875 |
0.274002363190237 |
29 |
| 2030 |
0.450424529941113 |
0.3064112448579 |
0.165462072223266 |
34 |
| 2031 |
0.560058473351269 |
0.378417887399506 |
0.363281171903526 |
66 |
IV. Investment Strategy Comparison: DYDX vs XLM
Long-term vs Short-term Investment Strategies
-
DYDX: May appeal to investors focused on decentralized derivatives trading infrastructure and DeFi ecosystem development. The token's performance correlates with derivatives market activity and platform adoption trends.
-
XLM: May attract investors interested in cross-border payment solutions and financial inclusion initiatives. The asset's value relates to institutional partnerships and adoption in remittance markets.
Risk Management and Asset Allocation
-
Conservative Investors: Consider balanced allocation approaches, such as DYDX: 30-40% vs XLM: 60-70%, reflecting XLM's relatively larger market capitalization and established institutional presence.
-
Aggressive Investors: May explore alternative allocation structures, such as DYDX: 50-60% vs XLM: 40-50%, depending on risk tolerance and market outlook for derivatives trading platforms.
-
Hedging Tools: Portfolio diversification strategies may include stablecoin allocations, derivatives instruments, and cross-asset combinations to manage volatility exposure.
V. Potential Risk Comparison
Market Risk
-
DYDX: Subject to volatility related to derivatives trading volume fluctuations, DeFi market sentiment shifts, and competition from alternative decentralized exchange platforms. The token experienced substantial price decline from $4.52 in March 2024 to current levels around $0.1976.
-
XLM: Exposed to market dynamics affecting payment-focused cryptocurrencies, competitive pressures from alternative cross-border payment solutions, and shifts in institutional partnership developments.
Technical Risk
-
DYDX: Platform scalability considerations, orderbook functionality reliability, and network stability factors may influence user adoption and token utility.
-
XLM: Network performance requirements for transaction processing, consensus mechanism efficiency, and potential security considerations warrant ongoing monitoring.
Regulatory Risk
-
Global regulatory frameworks for derivatives trading platforms may impact DYDX's operational environment and market access.
-
Cross-border payment regulations and financial services compliance requirements could affect XLM's adoption trajectory and institutional partnerships.
-
Regulatory clarity variations across jurisdictions create different operational contexts for both assets.
VI. Conclusion: Which Is the Better Buy?
📌 Investment Value Summary
-
DYDX Characteristics: Positioned within decentralized derivatives trading infrastructure; current market cap of $162.08 million; 24-hour trading volume of $372.76 million; price forecast range for 2031: $0.316-$0.436.
-
XLM Characteristics: Established presence in cross-border payment solutions; market cap of $7.38 billion; 24-hour trading volume of $1.90 billion; institutional partnerships with entities including IBM; price forecast range for 2031: $0.363-$0.560.
✅ Investment Considerations
-
Beginning Investors: May consider starting with assets having larger market capitalizations and established use cases. Portfolio diversification across multiple assets and thorough research remain important considerations.
-
Experienced Investors: Could evaluate both assets based on specific investment objectives, risk tolerance levels, and market outlook for their respective sectors. Technical analysis and fundamental research may inform allocation decisions.
-
Institutional Investors: May assess both assets through comprehensive due diligence processes, considering factors such as liquidity profiles, regulatory compliance frameworks, and alignment with institutional investment mandates.
⚠️ Risk Disclaimer: The cryptocurrency market demonstrates substantial volatility characteristics. This analysis does not constitute investment advice. Market participants should conduct independent research and consider consulting financial professionals before making investment decisions.
VII. FAQ
Q1: What are the main differences between DYDX and XLM in terms of use cases?
DYDX focuses on decentralized derivatives trading infrastructure, while XLM specializes in cross-border payment solutions. DYDX operates as a governance token for a perpetual contract exchange platform, serving traders seeking decentralized margin trading and derivatives products. XLM facilitates fast, low-cost international transactions between banks, payment institutions, and individuals, with institutional partnerships including IBM and Mercado Libre. The fundamental distinction lies in their target markets: DYDX serves the DeFi derivatives sector, whereas XLM addresses financial inclusion and remittance needs.
Q2: How do the market capitalizations of DYDX and XLM compare?
XLM maintains a significantly larger market capitalization at $7.38 billion compared to DYDX's $162.08 million as of January 16, 2026. This 45x difference reflects XLM's established presence since 2014 and broader institutional adoption, while DYDX, launched in 2021, operates within a more specialized DeFi derivatives niche. The larger market cap typically suggests greater liquidity, lower volatility risk, and potentially more conservative investment characteristics for XLM relative to DYDX.
Q3: What are the price forecast ranges for DYDX and XLM by 2031?
DYDX forecasts range from $0.316 (conservative) to $0.436 (optimistic) by 2031, representing potential growth from current levels of $0.1976. XLM projections span $0.363 (baseline) to $0.560 (optimistic) by 2031 from its current price of $0.22769. Both assets show potential appreciation over the forecast period, though XLM demonstrates a higher absolute price target. These projections depend on factors including institutional adoption rates, regulatory developments, ecosystem expansion, and broader cryptocurrency market conditions.
Q4: Which asset experienced greater price volatility historically?
DYDX demonstrated substantially higher volatility, declining approximately 95.6% from its March 2024 peak of $4.52 to its October 2025 low of $0.126201, then recovering to current levels around $0.1976. XLM, while experiencing market cycles, has shown more moderate price fluctuations since reaching its all-time high of $0.875563 in January 2018. This volatility difference reflects DYDX's shorter market history, smaller market capitalization, and concentrated exposure to derivatives trading sentiment versus XLM's broader institutional base and established use cases.
Q5: What regulatory risks affect DYDX versus XLM?
DYDX faces regulatory considerations specific to decentralized derivatives trading platforms, including potential scrutiny of perpetual contracts, margin trading operations, and DeFi protocol classifications. XLM encounters regulatory frameworks governing cross-border payments, financial services compliance, and remittance regulations across multiple jurisdictions. Both assets operate in evolving regulatory environments, though XLM's institutional partnerships may provide clearer compliance pathways, while DYDX navigates the less-defined regulatory landscape surrounding decentralized derivatives markets.
Q6: How do institutional adoption patterns differ between DYDX and XLM?
XLM demonstrates broader institutional adoption through partnerships with established entities including IBM and Mercado Libre, focusing on payment infrastructure and financial inclusion initiatives. DYDX's institutional interest primarily stems from participants in derivatives trading and DeFi investment sectors. The 24-hour trading volume comparison—$1.90 billion for XLM versus $372.76 million for DYDX—reflects this adoption difference. XLM's longer operational history (since 2014) and payment-focused use case have facilitated more extensive institutional integration compared to DYDX's specialized derivatives platform positioning.
Q7: What allocation strategies might suit different investor profiles for DYDX vs XLM?
Conservative investors might consider allocating 30-40% to DYDX and 60-70% to XLM, reflecting XLM's larger market capitalization and established institutional presence. Aggressive investors with higher risk tolerance could explore 50-60% DYDX and 40-50% XLM allocations, depending on market outlook for derivatives trading platforms. Beginning investors may prioritize assets with larger market caps like XLM for initial exposure, while experienced investors might evaluate both based on specific investment objectives, technical analysis, and sector outlook. Portfolio diversification across multiple assets and thorough independent research remain essential regardless of allocation strategy.
Q8: What technological developments differentiate DYDX from XLM?
DYDX's technological focus centers on enhancing derivatives trading infrastructure, including orderbook functionality, margin trading mechanisms, and decentralized exchange features. XLM develops improvements to the Stellar Consensus Protocol (SCP), emphasizing fast finality, scalability, and transaction processing efficiency for payment applications. DYDX operates within DeFi trading protocols requiring sophisticated smart contract functionality, while XLM prioritizes network performance for high-volume, low-cost international transactions. These technological distinctions reflect their respective market positions: DYDX as a specialized trading platform versus XLM as a payment network infrastructure.
* The information is not intended to be and does not constitute financial advice or any other recommendation of any sort offered or endorsed by Gate.