This comprehensive guide compares ELA and THETA, two distinct blockchain platforms with divergent market positioning and investment profiles. ELA operates as a Web 3.0 infrastructure platform focused on decentralized SmartWeb development since 2018, while THETA functions as a decentralized video streaming network launched in 2017. The article analyzes historical price performance, current market status (ELA at $0.8407 vs THETA at $0.3048), tokenomics, institutional adoption, and technological ecosystems. Both assets experienced significant price compression from historical peaks, with ELA declining 99% from $89.14 and THETA dropping 98% from $15.72. Price forecasts through 2031 suggest potential recovery trajectories, with THETA offering superior liquidity and market capitalization ($304.8M), while ELA presents higher volatility with recovery potential. The guide provides tailored investment strategies for conservative to aggressive investors, comprehensive risk analysis, and addresses critical decision facto
Introduction: Investment Comparison Between ELA and THETA
In the cryptocurrency market, the comparison between ELA vs THETA has consistently been a topic that investors cannot overlook. The two not only exhibit notable differences in market capitalization ranking, application scenarios, and price performance, but also represent distinct positioning within the crypto asset landscape.
Elastos (ELA): Launched in 2018, it has gained market recognition through its positioning as a next-generation Web 3.0 platform dedicated to building a decentralized SmartWeb based on blockchain technology.
Theta (THETA): Since its launch in 2017, it has been recognized as a decentralized video streaming platform, leveraging blockchain technology to incentivize bandwidth sharing and reduce content delivery costs.
This article will comprehensively analyze the investment value comparison of ELA vs THETA around historical price trends, supply mechanisms, institutional adoption, technological ecosystems, and future projections, attempting to address investors' most pressing question:
"Which is the better buy right now?"
I. Historical Price Comparison and Current Market Status
Historical Price Trends of ELA (Coin A) and THETA (Coin B)
- 2018: ELA reached a price peak of $89.14 on February 24, following its initial platform development momentum.
- 2021: THETA achieved a historical high of $15.72 on April 16, driven by growing adoption in decentralized video streaming.
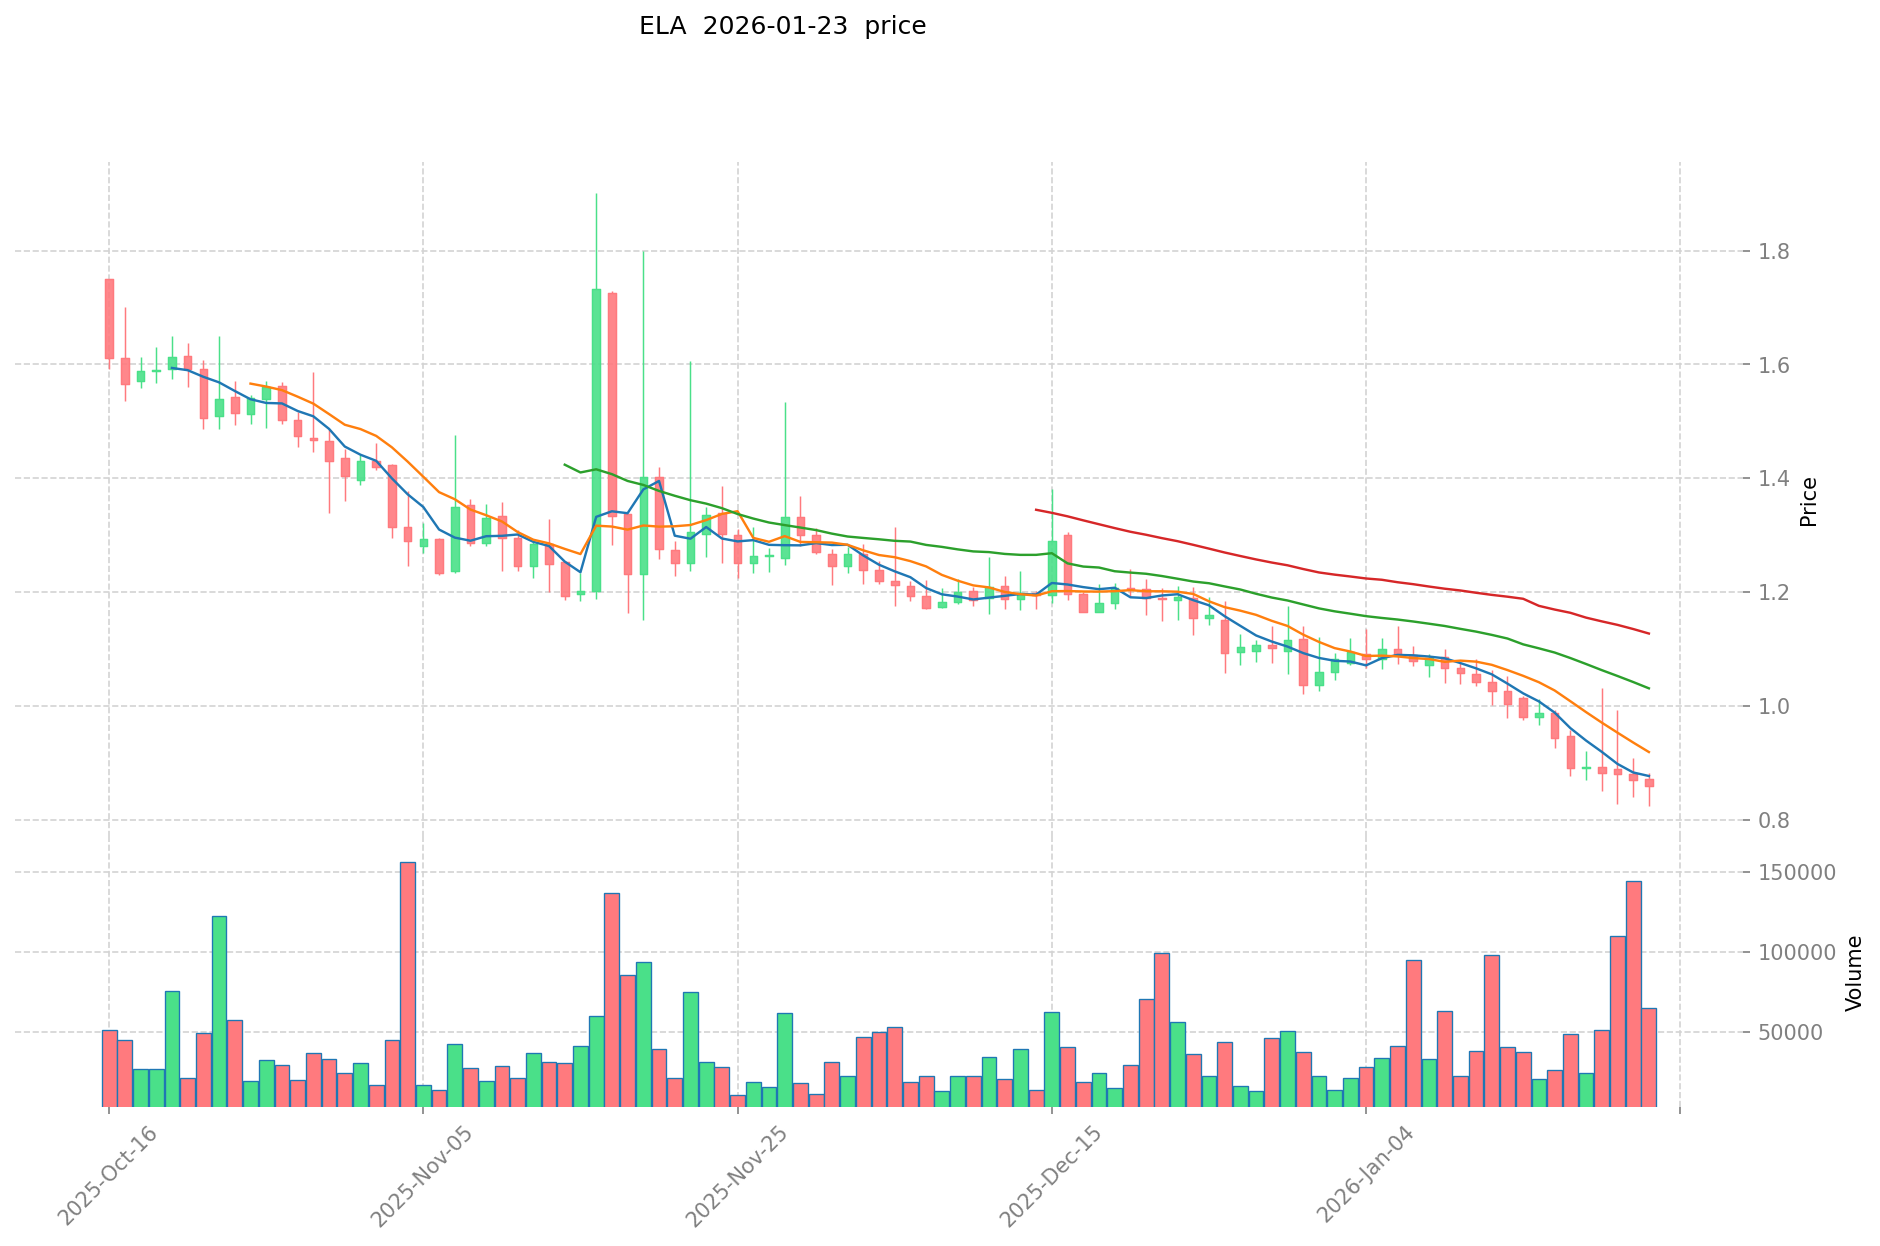
- 2023: ELA experienced significant downward pressure, recording a low of $0.793867 on January 8.
- 2020: THETA marked its historical bottom at $0.04039979 on March 13, during broader market volatility.
- Comparative Analysis: During recent market cycles, ELA declined from its peak of $89.14 to $0.793867, representing substantial price compression, while THETA dropped from $15.72 to $0.04039979, showing similar downward trajectory patterns.
Current Market Status (January 23, 2026)
- ELA current price: $0.8407
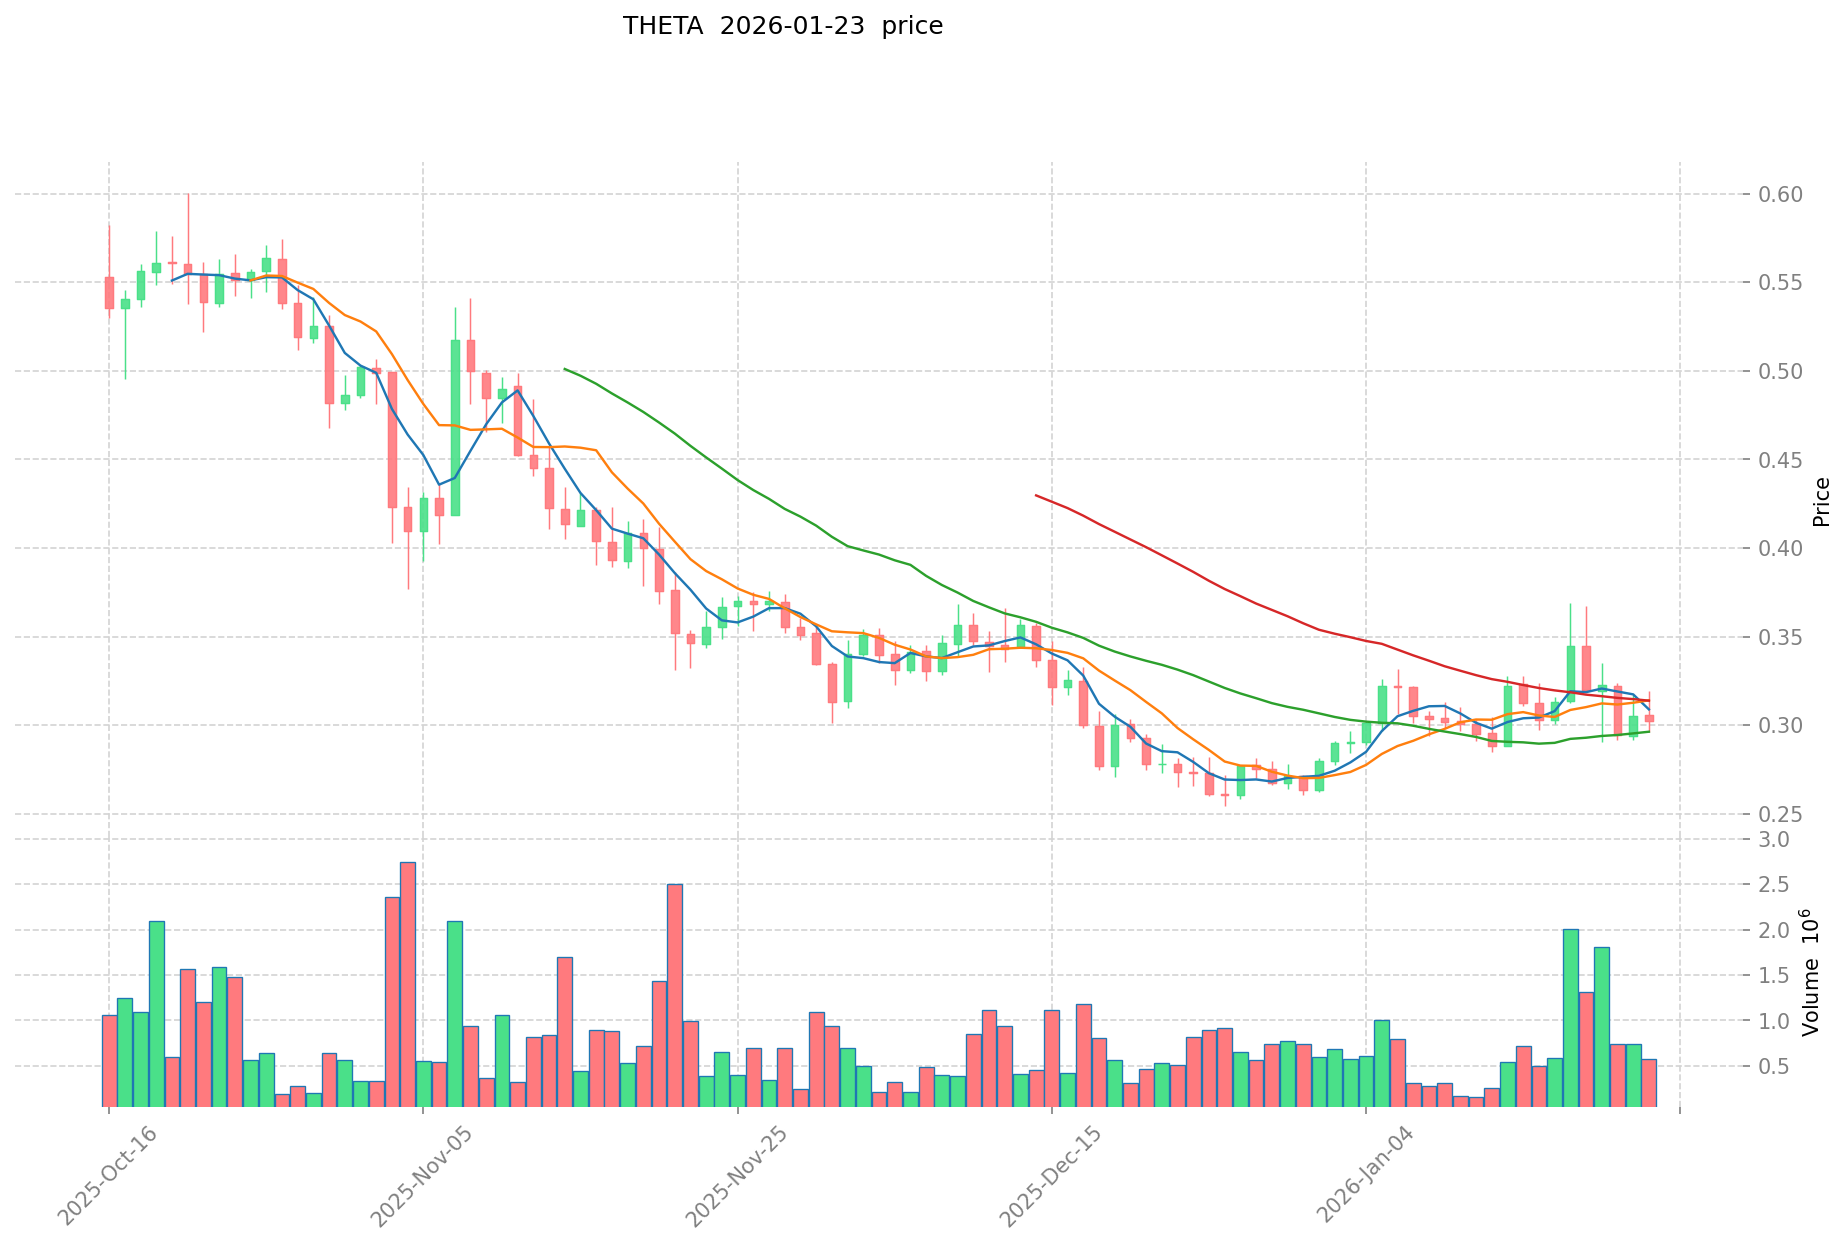
- THETA current price: $0.3048
- 24-hour trading volume: $57,308.40 (ELA) vs $151,270.54 (THETA)
- Market sentiment index (Fear & Greed Index): 24 (Extreme Fear)
- Recent price performance: ELA shows -2.04% change over 24 hours, while THETA records -0.42% change over the same period.
- Market capitalization: ELA stands at $19,390,699.26 with THETA at $304,800,000.00.
View real-time prices:
II. Core Factors Affecting ELA vs THETA Investment Value
Supply Mechanism Comparison (Tokenomics)
Due to the absence of detailed supply mechanism information in the provided materials, a comprehensive comparison of tokenomics between ELA and THETA cannot be established at this time.
Institutional Adoption and Market Applications
Without specific data regarding institutional holdings, enterprise adoption, or national policy frameworks for ELA and THETA in the reference materials, a substantive analysis of their comparative market positioning and regulatory treatment across jurisdictions cannot be provided.
Technical Development and Ecosystem Construction
The provided materials do not contain information about recent technical upgrades, development roadmaps, or ecosystem activities for either ELA or THETA. Consequently, a comparison of their respective technological advancement trajectories and ecosystem maturity levels in areas such as DeFi, NFT, payment solutions, or smart contract implementations cannot be conducted.
Macroeconomic Environment and Market Cycles
In the absence of historical performance data and correlation analyses between these assets and macroeconomic indicators, their comparative behaviors under varying inflation environments, monetary policy conditions, interest rate fluctuations, or geopolitical scenarios remain indeterminate based on the available materials.
III. 2026-2031 Price Forecast: ELA vs THETA
Short-term Forecast (2026)
- ELA: Conservative $0.810144 - $0.8352 | Optimistic $0.8352 - $1.177632
- THETA: Conservative $0.253565 - $0.3055 | Optimistic $0.3055 - $0.44603
Medium-term Forecast (2028-2029)
- ELA may enter a gradual growth phase, with estimated prices ranging from $0.9324947448 to $1.393382952 in 2028, and $0.924455997 to $1.57773823488 in 2029
- THETA may experience moderate expansion, with projected prices between $0.25557656475 and $0.5614304865 in 2028, and $0.323534792295 to $0.5882450769 in 2029
- Key drivers: institutional capital inflows, ETF developments, ecosystem expansion
Long-term Forecast (2030-2031)
- ELA: Baseline scenario $1.2365523415872 - $1.40517311544 (2030) | Optimistic scenario $1.5667680237156 - $2.240478273913308 (2031)
- THETA: Baseline scenario $0.3343192853715 - $0.539224653825 (2030) | Optimistic scenario $0.34618222775565 - $0.773140308654285 (2031)
View detailed price predictions for ELA and THETA
Disclaimer
ELA:
| Year |
Predicted High Price |
Predicted Average Price |
Predicted Low Price |
Price Change |
| 2026 |
1.177632 |
0.8352 |
0.810144 |
0 |
| 2027 |
1.13725008 |
1.006416 |
0.72461952 |
19 |
| 2028 |
1.393382952 |
1.07183304 |
0.9324947448 |
27 |
| 2029 |
1.57773823488 |
1.232607996 |
0.924455997 |
46 |
| 2030 |
1.7283629319912 |
1.40517311544 |
1.2365523415872 |
67 |
| 2031 |
2.240478273913308 |
1.5667680237156 |
0.94006081422936 |
86 |
THETA:
| Year |
Predicted High Price |
Predicted Average Price |
Predicted Low Price |
Price Change |
| 2026 |
0.44603 |
0.3055 |
0.253565 |
0 |
| 2027 |
0.46219095 |
0.375765 |
0.25927785 |
23 |
| 2028 |
0.5614304865 |
0.418977975 |
0.25557656475 |
37 |
| 2029 |
0.5882450769 |
0.49020423075 |
0.323534792295 |
60 |
| 2030 |
0.6147161053605 |
0.539224653825 |
0.3343192853715 |
76 |
| 2031 |
0.773140308654285 |
0.57697037959275 |
0.34618222775565 |
88 |
IV. Investment Strategy Comparison: ELA vs THETA
Long-term vs Short-term Investment Strategies
- ELA: May suit investors focused on Web 3.0 infrastructure development and decentralized SmartWeb ecosystem potential, particularly those with longer investment horizons willing to navigate recovery from historical price compression
- THETA: May appeal to investors interested in decentralized video streaming applications and content delivery networks, with attention to bandwidth sharing incentive mechanisms
Risk Management and Asset Allocation
- Conservative investors: ELA 30% vs THETA 70% allocation may be considered, given THETA's relatively higher market capitalization and trading volume
- Aggressive investors: ELA 60% vs THETA 40% allocation could be explored, reflecting ELA's potential recovery trajectory from lower price levels
- Hedging instruments: stablecoin reserves, options strategies, cross-asset portfolio diversification
V. Potential Risk Comparison
Market Risks
- ELA: Exhibits significant historical volatility, declining from $89.14 peak to current levels around $0.8407, representing substantial price compression that may continue under adverse market conditions
- THETA: Demonstrates considerable price fluctuation history, moving from $15.72 high to current $0.3048 levels, subject to broader cryptocurrency market sentiment shifts
Technical Risks
- ELA: Scalability considerations and network stability factors associated with SmartWeb infrastructure development
- THETA: Bandwidth distribution network reliability, content delivery architecture resilience
Regulatory Risks
- Global regulatory policy developments may affect both assets differently based on their respective application domains, with decentralized infrastructure platforms and video streaming networks potentially facing distinct compliance frameworks across jurisdictions
VI. Conclusion: Which Is the Better Buy?
📌 Investment Value Summary:
- ELA Advantages: Positioned in Web 3.0 infrastructure space with SmartWeb development focus, currently trading at substantially reduced levels from historical peaks, potentially offering recovery upside
- THETA Advantages: Operates in decentralized video streaming sector with established market presence since 2017, maintains higher market capitalization ($304.8M vs $19.4M) and trading volume, suggesting relatively greater liquidity
✅ Investment Recommendations:
- Novice investors: Consider beginning with smaller position sizes in THETA given its higher market capitalization and liquidity characteristics, while maintaining diversified portfolio approach
- Experienced investors: May explore tactical allocation strategies balancing ELA's recovery potential against THETA's established market positioning, with attention to risk tolerance and investment timeframes
- Institutional investors: Conduct thorough due diligence on ecosystem development progress, regulatory compliance status, and liquidity depth before position establishment in either asset
⚠️ Risk Disclosure: The cryptocurrency market exhibits extreme volatility characteristics. This content does not constitute investment advice.
VII. FAQ
Q1: What are the key differences between ELA and THETA's market positioning?
ELA positions itself as a Web 3.0 infrastructure platform building a decentralized SmartWeb, while THETA operates as a decentralized video streaming network focused on bandwidth sharing and content delivery. ELA launched in 2018 targeting broader blockchain-based internet infrastructure, whereas THETA (launched 2017) addresses specific video streaming industry challenges. Their market capitalizations reflect this distinction significantly: THETA maintains $304.8M versus ELA's $19.4M as of January 2026.
Q2: How do their historical price performances compare?
Both assets experienced substantial downward pressure from their peaks. ELA declined from its February 2018 high of $89.14 to current levels around $0.8407, representing approximately 99% retracement. THETA dropped from its April 2021 peak of $15.72 to $0.3048, showing roughly 98% decline. However, their trajectories differ: ELA peaked earlier during initial platform development momentum, while THETA's high occurred during 2021's broader cryptocurrency market rally.
Q3: Which cryptocurrency shows better liquidity characteristics?
THETA demonstrates superior liquidity with 24-hour trading volume of $151,270.54 compared to ELA's $57,308.40 as of January 23, 2026. THETA's market capitalization of $304.8M substantially exceeds ELA's $19.4M, providing deeper order books and potentially lower slippage for larger transactions. This liquidity advantage may benefit investors seeking easier entry and exit positions.
Q4: What are the projected price ranges for 2026-2031?
For 2026, ELA's conservative forecast ranges $0.810144-$0.8352 (optimistic $0.8352-$1.177632), while THETA projects $0.253565-$0.3055 (optimistic $0.3055-$0.44603). By 2031, ELA's baseline scenario estimates $1.5667680237156-$2.240478273913308, whereas THETA forecasts $0.34618222775565-$0.773140308654285. These projections suggest ELA may experience higher percentage growth from current levels, though absolute price recovery remains uncertain.
Q5: What allocation strategy should different investor types consider?
Conservative investors might consider a 30% ELA / 70% THETA allocation, favoring THETA's higher market capitalization and established liquidity. Aggressive investors could explore 60% ELA / 40% THETA positioning, reflecting ELA's potential recovery trajectory from compressed price levels. All investors should maintain diversified portfolios with stablecoin reserves and implement appropriate risk management strategies including position sizing, stop-loss mechanisms, and regular portfolio rebalancing.
Q6: What are the primary risks associated with each asset?
ELA faces risks from its substantial historical volatility (99% decline from peak), SmartWeb infrastructure scalability challenges, and relatively low liquidity profile. THETA confronts bandwidth distribution network reliability concerns, content delivery architecture dependencies, and sensitivity to video streaming industry adoption rates. Both assets remain subject to cryptocurrency market volatility, regulatory developments affecting their respective sectors, and broader macroeconomic conditions impacting risk asset valuations.
Q7: How does current market sentiment affect investment decisions?
The Fear & Greed Index stands at 24 (Extreme Fear) as of January 2026, indicating widespread market pessimism. ELA shows -2.04% 24-hour change versus THETA's -0.42% decline, suggesting both assets face negative near-term pressure. This extreme fear environment may present accumulation opportunities for long-term investors with strong risk tolerance, though timing market bottoms remains challenging. Investors should consider dollar-cost averaging strategies rather than attempting to identify precise entry points during periods of elevated fear.
Q8: Which cryptocurrency better suits novice versus experienced investors?
Novice investors may find THETA more suitable given its higher market capitalization ($304.8M), superior liquidity (2.6x higher trading volume), and established presence since 2017 in the recognizable video streaming sector. Experienced investors might explore ELA's recovery potential from extreme price compression, though this requires tolerance for lower liquidity, higher volatility, and longer development timelines associated with Web 3.0 infrastructure buildout. Both investor types should conduct thorough due diligence and never allocate capital exceeding their risk tolerance thresholds.
* The information is not intended to be and does not constitute financial advice or any other recommendation of any sort offered or endorsed by Gate.