This comprehensive guide compares ENJ and AAVE, two prominent cryptocurrency tokens serving different blockchain sectors. ENJ, launched in 2017, positions itself as a gaming-focused NFT platform with fixed 1 billion token supply, currently trading at $0.03288 on Gate. AAVE, transformed from LEND in 2020, leads decentralized lending protocols with ~16 million tokens in circulation at $172.95 on Gate. The article analyzes historical price trends, tokenomics, institutional adoption, and technology ecosystems, revealing AAVE's superior value retention and established DeFi infrastructure versus ENJ's higher volatility gaming sector exposure. Through 2031 price forecasts, investment allocation strategies, and risk assessments, this resource helps investors evaluate which token better aligns with their portfolio goals—whether prioritizing established DeFi infrastructure or gaming ecosystem growth potential.
Introduction: ENJ vs AAVE Investment Comparison
In the cryptocurrency market, the comparison between ENJ vs AAVE has always been a topic that investors cannot avoid. The two not only show significant differences in market cap ranking, application scenarios, and price performance, but also represent different crypto asset positioning.
ENJ (Enjin Coin): Launched in 2009 and entering blockchain in 2017, it has gained market recognition by positioning itself as a gaming-focused virtual goods platform.
AAVE: Since its launch in 2020 through the transformation from LEND, it has been recognized as a leading decentralized lending protocol, providing deposit and lending services for users.
This article will comprehensively analyze the investment value comparison of ENJ vs AAVE around historical price trends, supply mechanisms, institutional adoption, technical ecosystems, and future predictions, attempting to answer the question that investors are most concerned about:
"Which is the better buy right now?"
I. Historical Price Comparison and Current Market Status
Historical Price Trends of ENJ (Coin A) and AAVE (Coin B)
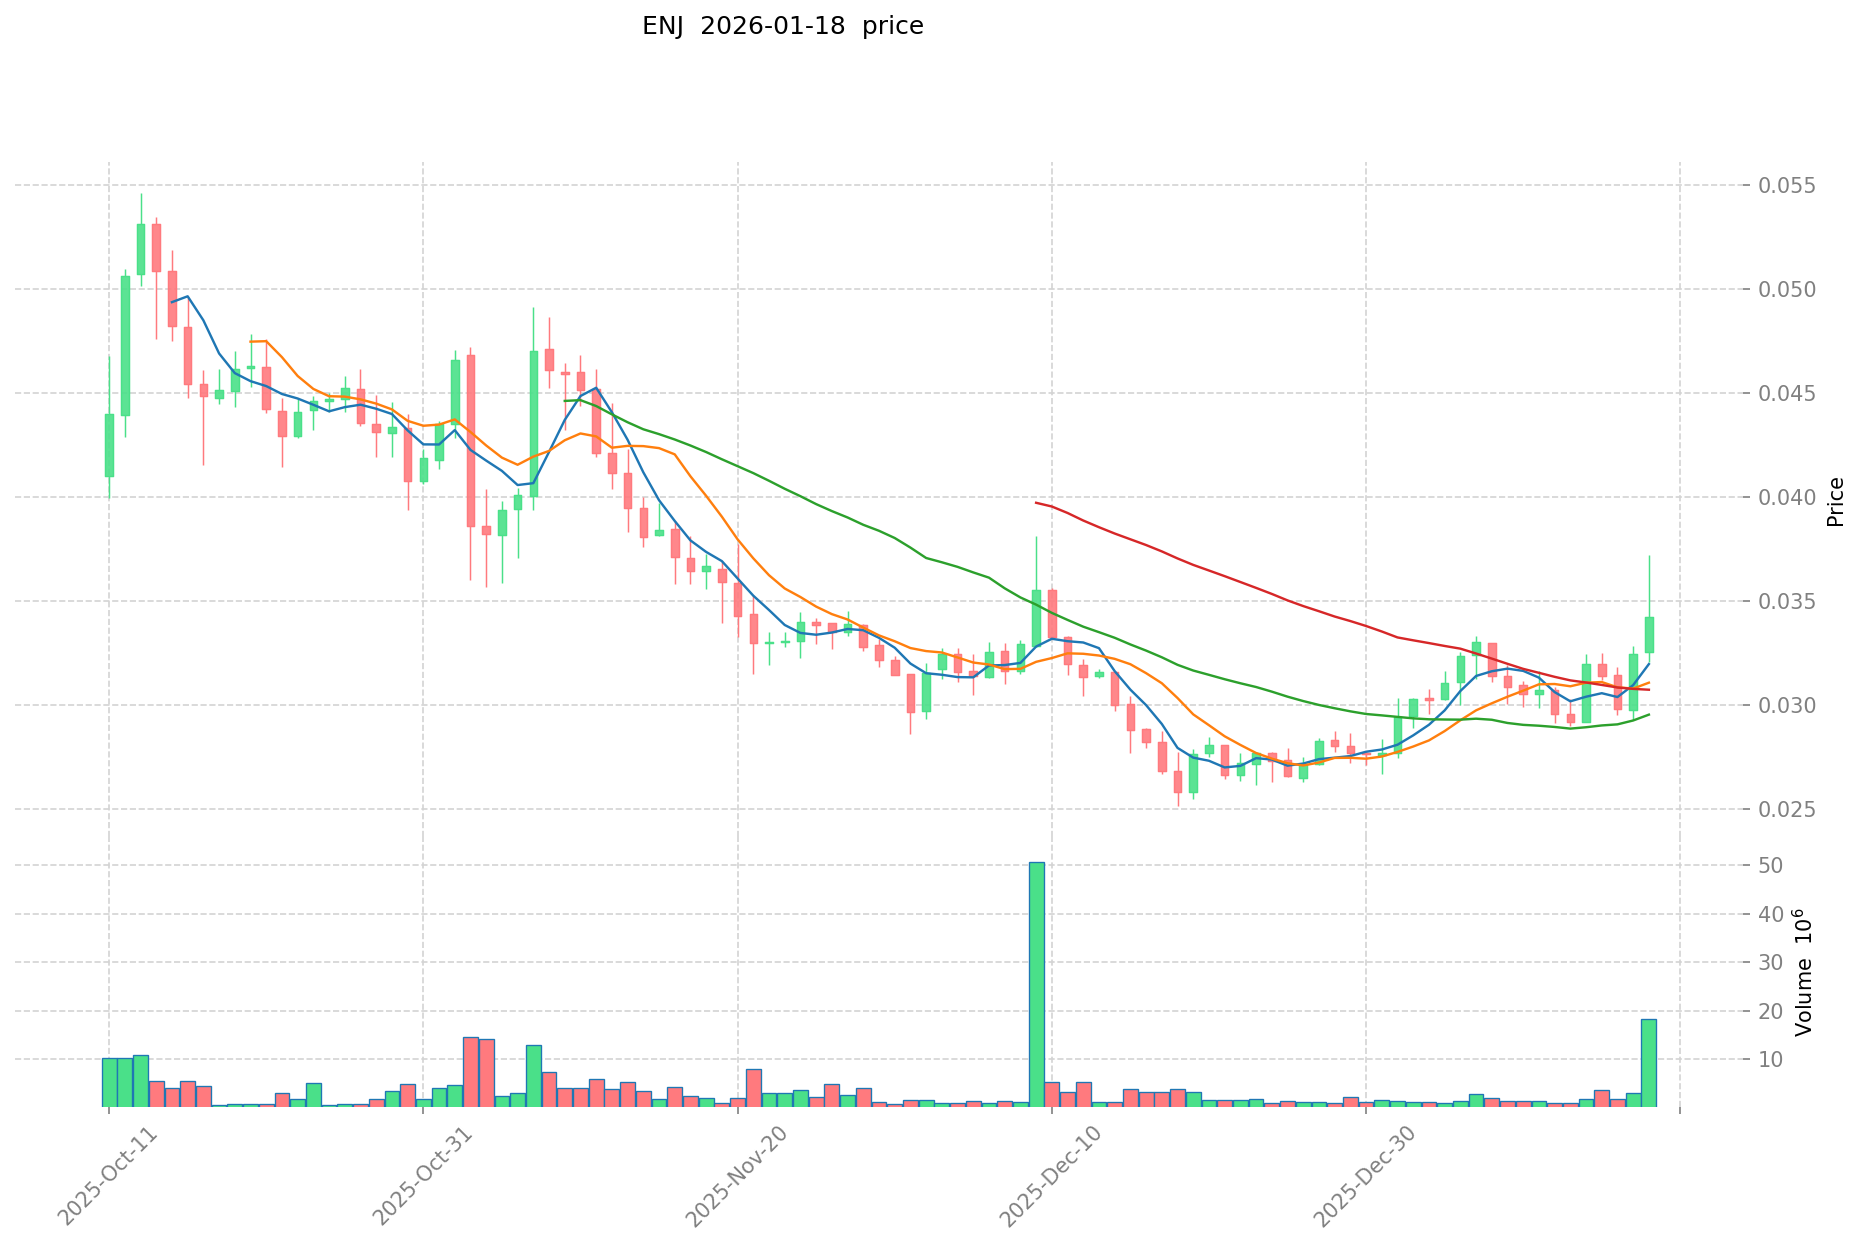
- 2021: ENJ experienced notable price movements, reaching an all-time high of $4.82 in November 2021, driven by growing interest in NFT gaming and metaverse applications.
- 2021: AAVE reached its historical peak of $661.69 in May 2021, benefiting from the DeFi boom and increased institutional interest in decentralized lending protocols.
- Comparative Analysis: During the crypto market cycle from 2021 to 2026, ENJ declined from its peak of $4.82 to the current level of $0.03288, while AAVE dropped from $661.69 to $172.95, showing AAVE maintained relatively stronger value retention.
Current Market Status (2026-01-18)
- ENJ Current Price: $0.03288
- AAVE Current Price: $172.95
- 24-Hour Trading Volume: ENJ $583,458.98 vs AAVE $2,094,118.57
- Market Sentiment Index (Fear & Greed Index): 49 (Neutral)
View Real-Time Prices:
II. Core Factors Influencing ENJ vs AAVE Investment Value
Supply Mechanism Comparison (Tokenomics)
-
ENJ: ENJ operates with a fixed maximum supply of 1 billion tokens, featuring a deflationary model where tokens can be locked into NFTs and removed from circulation. This creates scarcity dynamics as gaming assets utilizing ENJ reduce available market supply.
-
AAVE: AAVE implements a capped supply model with approximately 16 million tokens in circulation. The protocol incorporates a Safety Module where tokens can be staked, effectively reducing liquid supply. Token burns from protocol fees introduce mild deflationary pressure.
-
📌 Historical Pattern: Supply mechanisms demonstrate influence on price cycles through periods of token lock-up and release. Gaming asset creation periods for ENJ and DeFi protocol expansion phases for AAVE have historically correlated with supply-side pressure shifts.
Institutional Adoption and Market Application
-
Institutional Holdings: AAVE demonstrates stronger institutional positioning within DeFi lending infrastructure. ENJ attracts attention from gaming industry investors and blockchain gaming-focused funds.
-
Enterprise Adoption: AAVE has been integrated into various DeFi protocols for lending and borrowing infrastructure, while ENJ focuses on gaming ecosystem partnerships and NFT marketplace integrations. Cross-border payment applications remain limited for both assets compared to primary use cases.
-
Regulatory Landscape: Different jurisdictions maintain varying approaches toward gaming tokens versus DeFi lending protocols. AAVE has obtained certain operational licenses in specific regions, while ENJ operates primarily within gaming ecosystem frameworks.
Technology Development and Ecosystem Building
-
ENJ Technology Evolution: Development focuses on blockchain gaming infrastructure, NFT standards, and cross-game asset interoperability. Platform upgrades aim to enhance scalability and reduce transaction costs for gaming applications.
-
AAVE Technology Progress: Protocol development emphasizes lending mechanism optimization, risk parameter adjustments, and multi-chain deployment strategies. Layer 2 integration efforts target transaction efficiency improvements.
-
Ecosystem Comparison: AAVE maintains strong positioning in DeFi lending with established market presence. ENJ concentrates on gaming and NFT sectors with limited DeFi protocol integration. Smart contract deployment differs significantly - AAVE operates primarily as financial infrastructure while ENJ functions within gaming asset frameworks.
Macroeconomic Factors and Market Cycles
-
Inflation Environment Performance: Both assets demonstrate correlation with broader cryptocurrency market trends rather than serving as traditional inflation hedges. Historical data suggests limited independent anti-inflation characteristics compared to established store-of-value assets.
-
Macroeconomic Monetary Policy: Interest rate environments and dollar index movements impact cryptocurrency markets broadly. Risk appetite shifts influenced by monetary policy changes affect both tokens through general market sentiment rather than isolated fundamentals.
-
Geopolitical Considerations: Cross-border transaction demand remains modest for both assets relative to primary use cases. International developments influence broader cryptocurrency adoption patterns, with indirect effects on gaming and DeFi sectors.
III. 2026-2031 Price Forecast: ENJ vs AAVE
Short-term Forecast (2026)
- ENJ: Conservative $0.0247 - $0.0329 | Optimistic $0.0329 - $0.0484
- AAVE: Conservative $152.29 - $173.06 | Optimistic $173.06 - $200.75
Mid-term Forecast (2028-2029)
- ENJ may enter a consolidation phase with projected prices ranging from $0.0348 to $0.0546 by 2028, potentially reaching $0.0364 to $0.0519 in 2029
- AAVE may enter an expansion phase with projected prices ranging from $172.36 to $267.46 by 2028, potentially reaching $207.18 to $344.53 in 2029
- Key drivers: institutional capital flows, ETF developments, ecosystem expansion
Long-term Forecast (2030-2031)
- ENJ: Baseline scenario $0.0397 - $0.0509 (2030) to $0.0358 - $0.0534 (2031) | Optimistic scenario $0.0560 (2030) to $0.0705 (2031)
- AAVE: Baseline scenario $176.08 - $288.66 (2030) to $296.66 - $344.95 (2031) | Optimistic scenario $401.24 (2030) to $386.34 (2031)
View detailed price predictions for ENJ and AAVE
Disclaimer
ENJ:
| Year |
Predicted High Price |
Predicted Average Price |
Predicted Low Price |
Price Change |
| 2026 |
0.0483924 |
0.03292 |
0.02469 |
0 |
| 2027 |
0.049600564 |
0.0406562 |
0.026833092 |
23 |
| 2028 |
0.05460534222 |
0.045128382 |
0.03474885414 |
37 |
| 2029 |
0.0518615365944 |
0.04986686211 |
0.0364028093403 |
51 |
| 2030 |
0.05595061928742 |
0.0508641993522 |
0.039674075494716 |
54 |
| 2031 |
0.070497780302149 |
0.05340740931981 |
0.035782964244272 |
62 |
AAVE:
| Year |
Predicted High Price |
Predicted Average Price |
Predicted Low Price |
Price Change |
| 2026 |
200.7496 |
173.06 |
152.2928 |
0 |
| 2027 |
209.333376 |
186.9048 |
164.476224 |
8 |
| 2028 |
267.4607688 |
198.119088 |
172.36360656 |
14 |
| 2029 |
344.529094032 |
232.7899284 |
207.183036276 |
34 |
| 2030 |
401.23672059024 |
288.659511216 |
176.08230184176 |
66 |
| 2031 |
386.3418898114944 |
344.94811590312 |
296.6553796766832 |
99 |
IV. Investment Strategy Comparison: ENJ vs AAVE
Long-term vs Short-term Investment Strategies
-
ENJ: Suitable for investors focused on gaming ecosystem growth and NFT marketplace expansion. The gaming-focused positioning appeals to those seeking exposure to blockchain gaming sector development with longer time horizons to absorb volatility.
-
AAVE: Suitable for investors seeking exposure to DeFi infrastructure growth and decentralized lending protocol adoption. The established market position in lending protocols attracts those prioritizing fundamental protocol utility over speculative growth.
Risk Management and Asset Allocation
-
Conservative Investors: ENJ 20% vs AAVE 80% - weighted toward established DeFi infrastructure with proven protocol adoption
-
Aggressive Investors: ENJ 45% vs AAVE 55% - balanced exposure reflecting gaming sector potential alongside DeFi lending fundamentals
-
Hedging Tools: stablecoin allocations for liquidity management, options strategies for downside protection, cross-asset combinations incorporating broader cryptocurrency market exposure
V. Potential Risk Comparison
Market Risks
-
ENJ: Gaming sector adoption cycles create concentrated exposure to NFT market sentiment shifts and blockchain gaming development timelines. Market capitalization relative to established assets increases volatility sensitivity during broader market downturns.
-
AAVE: DeFi lending protocol competition and yield farming trend shifts impact protocol adoption rates. Smart contract risk exposure through lending mechanisms creates dependency on borrower behavior and collateral value maintenance.
Technical Risks
-
ENJ: Scalability requirements for gaming applications demand continued infrastructure development. Network stability depends on blockchain gaming adoption rates and cross-game interoperability implementation success.
-
AAVE: Protocol security considerations involve smart contract audit dependencies and multi-chain deployment complexity. Lending mechanism optimization requires ongoing risk parameter adjustments to maintain protocol solvency.
Regulatory Risks
- Global regulatory frameworks demonstrate varying approaches toward gaming tokens versus DeFi lending protocols. Gaming asset classification faces different regulatory scrutiny compared to financial service protocols. Jurisdictional differences in blockchain gaming regulations impact ENJ operational frameworks, while DeFi lending oversight affects AAVE protocol compliance requirements across different regions.
VI. Conclusion: Which Is the Better Buy?
📌 Investment Value Summary:
-
ENJ Strengths: Gaming ecosystem positioning provides exposure to blockchain gaming sector growth. NFT infrastructure development offers participation in digital asset marketplace expansion. Fixed supply mechanism with deflationary token utility through gaming asset creation.
-
AAVE Strengths: Established DeFi lending infrastructure demonstrates proven protocol adoption. Multi-chain deployment strategy provides diversified blockchain ecosystem exposure. Institutional positioning within decentralized finance sector offers fundamental utility value.
✅ Investment Recommendations:
-
Beginning Investors: Consider starting with established protocols demonstrating proven market adoption before exploring sector-specific tokens. Diversification across different blockchain use cases reduces concentrated exposure risks.
-
Experienced Investors: Evaluate portfolio allocation based on risk tolerance and sector conviction. Gaming ecosystem exposure through ENJ complements DeFi infrastructure positioning via AAVE for diversified cryptocurrency sector participation.
-
Institutional Investors: Assess protocol fundamentals, regulatory compliance frameworks, and ecosystem integration capabilities. DeFi lending infrastructure may align with institutional adoption timelines, while gaming sector exposure requires sector-specific expertise evaluation.
⚠️ Risk Disclaimer: Cryptocurrency markets demonstrate substantial volatility characteristics. This analysis does not constitute investment advice. Conduct independent research and consult qualified financial advisors before making investment decisions.
VII. FAQ
Q1: What are the main differences between ENJ and AAVE in terms of use cases?
ENJ serves primarily as a gaming-focused token for NFT creation and virtual goods within blockchain gaming ecosystems, while AAVE functions as a decentralized lending protocol token enabling deposit and borrowing services in DeFi. ENJ operates with a deflationary model where tokens are locked into gaming assets, whereas AAVE utilizes a staking mechanism through its Safety Module. The fundamental distinction lies in their target markets: ENJ targets gaming industry adoption and NFT marketplace integration, while AAVE focuses on financial infrastructure for decentralized lending and borrowing.
Q2: Which token shows better price retention since the 2021 market peak?
AAVE demonstrates significantly stronger value retention, declining from $661.69 to $172.95 (approximately 74% decline), compared to ENJ's drop from $4.82 to $0.03288 (approximately 99% decline). This substantial difference reflects AAVE's established positioning within DeFi infrastructure and continued protocol utility, while ENJ has experienced greater volatility tied to blockchain gaming sector adoption cycles and NFT market sentiment shifts.
Q3: How do the supply mechanisms of ENJ and AAVE differ?
ENJ operates with a fixed maximum supply of 1 billion tokens featuring a deflationary model where tokens can be permanently locked into NFTs and removed from circulation. AAVE implements a capped supply of approximately 16 million tokens with a Safety Module staking system and protocol fee burns introducing mild deflationary pressure. ENJ's supply reduction occurs through gaming asset creation, while AAVE's supply dynamics depend on staking participation and protocol revenue generation.
Q4: What are the projected price ranges for ENJ and AAVE through 2031?
For ENJ, conservative projections suggest $0.0247-$0.0329 in 2026, expanding to $0.0358-$0.0534 by 2031, with optimistic scenarios reaching $0.0705 in 2031. AAVE shows conservative projections of $152.29-$173.06 in 2026, potentially reaching $296.66-$344.95 by 2031, with optimistic scenarios approaching $386.34 in 2031. These forecasts reflect different growth trajectories: ENJ dependent on gaming sector expansion and AAVE tied to DeFi infrastructure adoption and institutional integration.
Q5: Which token is more suitable for conservative versus aggressive investors?
Conservative investors may consider an 80% AAVE and 20% ENJ allocation, weighted toward established DeFi infrastructure with proven protocol adoption and fundamental utility value. Aggressive investors might prefer a more balanced 55% AAVE and 45% ENJ split, seeking exposure to both gaming sector growth potential and DeFi lending fundamentals. The distinction reflects AAVE's institutional positioning and protocol maturity versus ENJ's higher volatility gaming ecosystem exposure.
Q6: What are the primary technical risks associated with each token?
ENJ faces scalability requirements for gaming applications, network stability dependencies on blockchain gaming adoption rates, and cross-game interoperability implementation challenges. AAVE confronts smart contract security considerations, multi-chain deployment complexity, and lending mechanism optimization requirements to maintain protocol solvency. ENJ's technical risks center on gaming infrastructure development, while AAVE's challenges focus on protocol security and financial mechanism stability.
Q7: How do regulatory considerations differ between ENJ and AAVE?
ENJ operates within gaming asset frameworks subject to jurisdictional blockchain gaming regulations and NFT classification approaches varying across regions. AAVE faces DeFi lending protocol oversight with compliance requirements for financial service regulations in different jurisdictions. Gaming tokens encounter different regulatory scrutiny compared to decentralized lending protocols, with AAVE having obtained certain operational licenses in specific regions while ENJ primarily functions within gaming ecosystem regulatory frameworks.
Q8: What factors should institutional investors prioritize when evaluating ENJ versus AAVE?
Institutional investors should assess protocol fundamentals, regulatory compliance frameworks, and ecosystem integration capabilities for both tokens. AAVE's established DeFi lending infrastructure may align better with institutional adoption timelines and compliance requirements, while ENJ's gaming sector exposure demands sector-specific expertise evaluation. Key considerations include market liquidity, protocol utility demonstration, multi-chain deployment capabilities, and institutional custody solution availability for each asset.
* The information is not intended to be and does not constitute financial advice or any other recommendation of any sort offered or endorsed by Gate.