This comprehensive guide compares ERG and GMX, two prominent decentralized finance assets with distinct market positioning. ERG operates as a foundational DeFi blockchain infrastructure launched in 2019, while GMX functions as a decentralized perpetual exchange capturing 30% of platform fees. The article analyzes historical price trends, current market status as of January 2026, tokenomics, institutional adoption, and technical ecosystems to help investors make informed decisions. Detailed price forecasts through 2031 suggest varied growth trajectories for both assets, with long-term projections indicating potential appreciation. Investment strategies are tailored for conservative, aggressive, and institutional investors, emphasizing risk management through portfolio diversification. The comparison addresses critical factors including market volatility, regulatory risks, and technical considerations, providing actionable insights for evaluating ERG versus GMX within your investment framework.
Introduction: ERG vs GMX Investment Comparison
In the cryptocurrency market, the comparison between ERG vs GMX has become a topic that investors cannot avoid. The two not only show significant differences in market cap ranking, application scenarios, and price performance, but also represent different positioning in the crypto asset space.
ERG (Ergo): Launched in 2019 with its mainnet going live on July 1, ERG has gained market recognition through its positioning as a foundational public blockchain for decentralized finance (DeFi) applications, focusing on providing efficient, secure, and simplified implementation of financial contracts.
GMX: Since its establishment, GMX has been positioned as a decentralized perpetual exchange, where the GMX token serves as both a utility and governance token while accruing 30% of platform-generated fees.
This article will comprehensively analyze the investment value comparison between ERG vs GMX, focusing on historical price trends, supply mechanisms, technical ecosystems, and future forecasts, attempting to address the question that investors are most concerned about:
"Which is the better buy right now?"
I. Historical Price Comparison and Current Market Status
Historical Price Trends of ERG (Coin A) and GMX (Coin B)
- 2021: ERG reached a price peak of $18.72 on September 3, demonstrating notable growth during the broader cryptocurrency market expansion.
- 2020: ERG experienced its lowest price point at $0.094191 on March 13, reflecting early-stage market conditions.
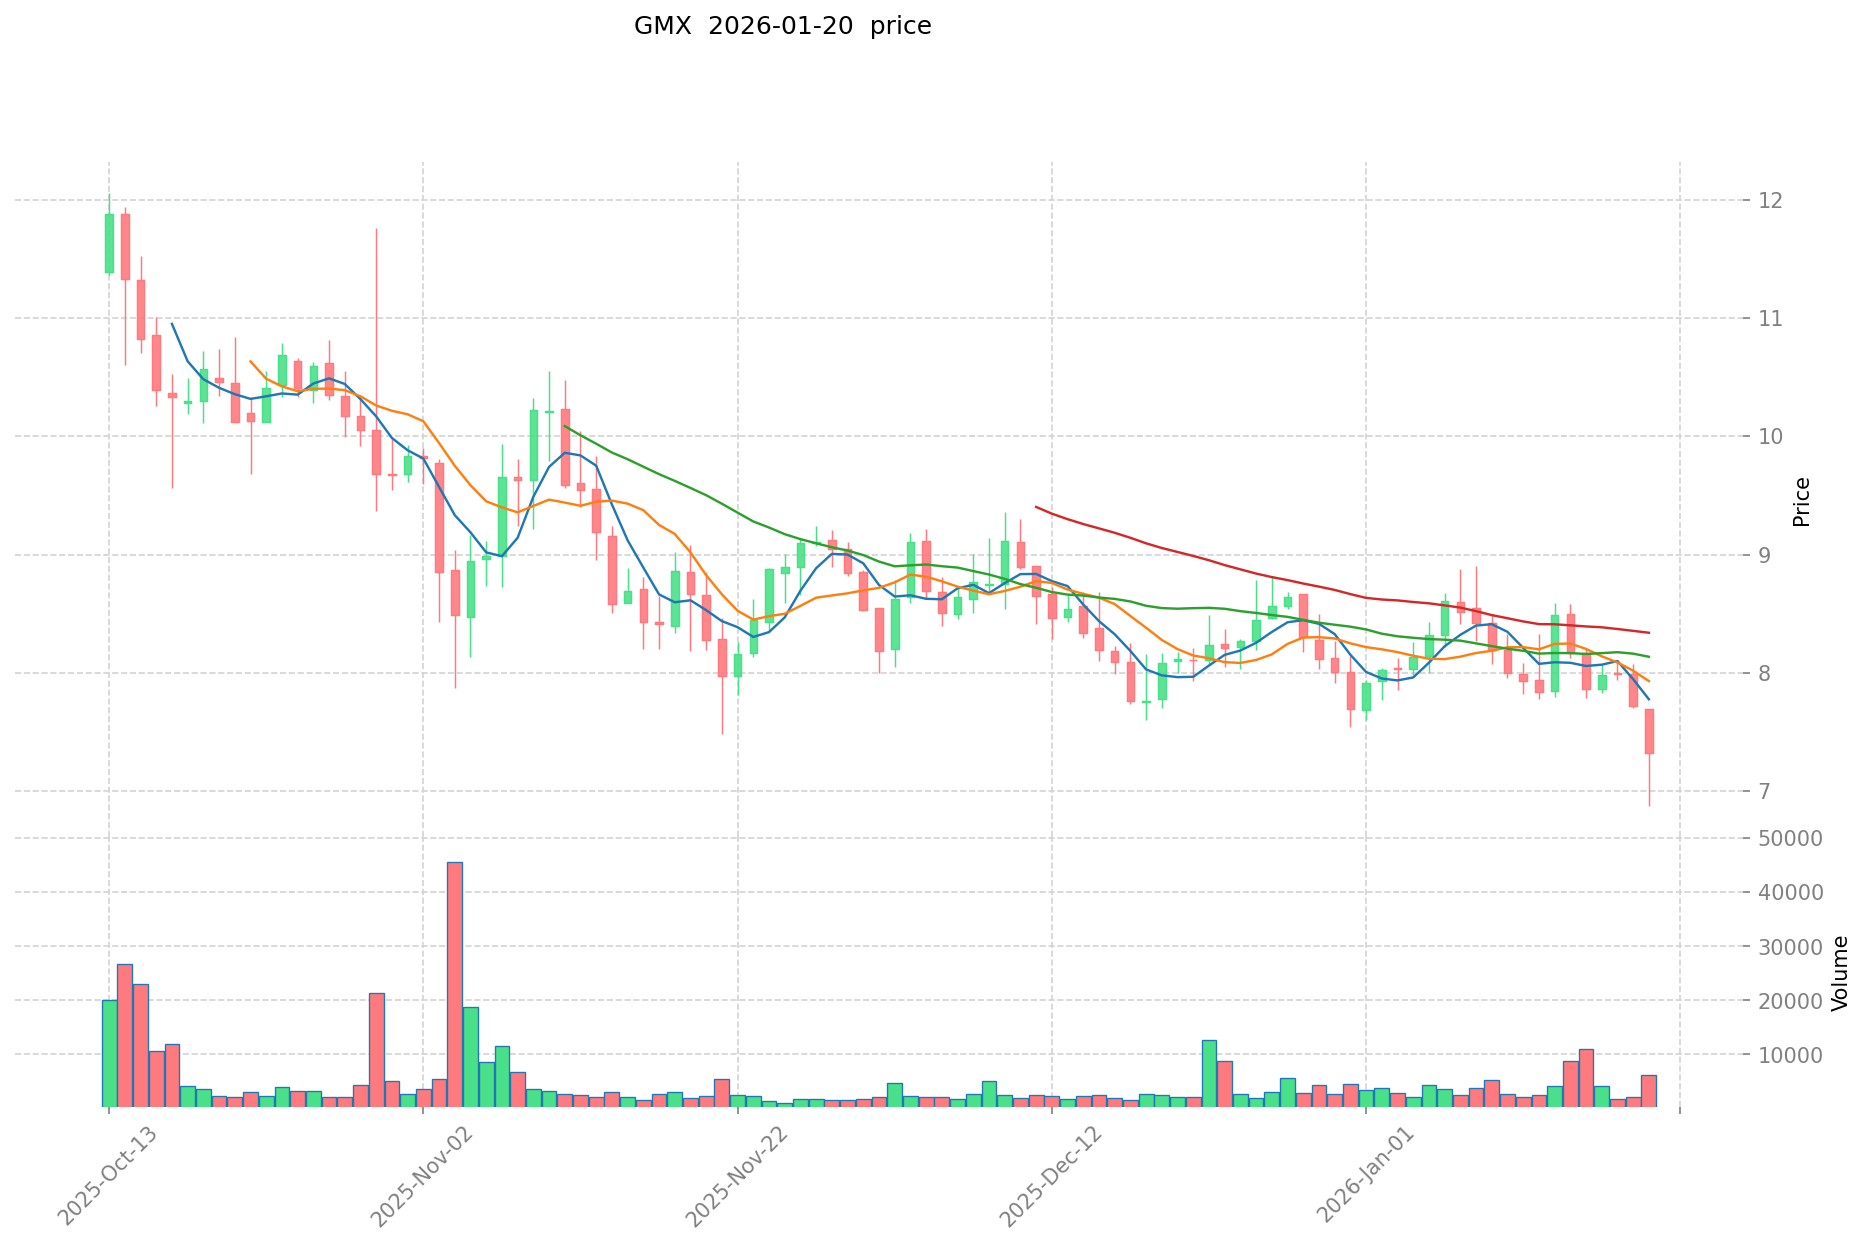
- 2023: GMX achieved its historical high of $91.07 on April 18, influenced by increased activity in decentralized perpetual trading platforms.
- 2025: GMX recorded its lowest price at $6.92 on October 11, representing a significant correction from previous levels.
- Comparative Analysis: During the market cycle spanning 2021-2026, ERG declined from its peak of $18.72 to the current level of $0.4414, representing substantial downward movement. Meanwhile, GMX declined from $91.07 to $7.167, showing a different trajectory but similarly experiencing considerable price adjustment.
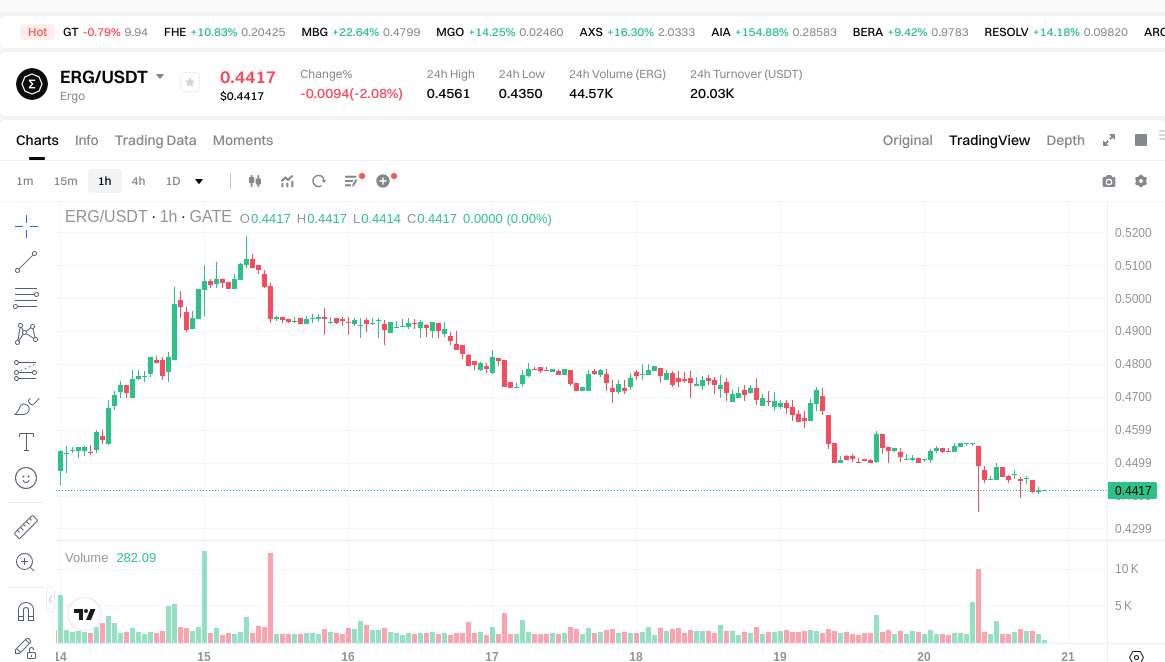
Current Market Status (2026-01-20)
- ERG Current Price: $0.4414
- GMX Current Price: $7.167
- 24-Hour Trading Volume: ERG $20,180.52 vs GMX $15,734.41
- Market Sentiment Index (Fear & Greed Index): 32 (Fear)
- 24-Hour Price Change: ERG -2.83% vs GMX -1.00%
- 7-Day Price Change: ERG -0.2% vs GMX -8.74%
- 30-Day Price Change: ERG -10.66% vs GMX -12.22%
- 1-Year Price Change: ERG -72.84% vs GMX -68.74%
View real-time prices:
II. Core Factors Affecting ERG vs GMX Investment Value
Supply Mechanism Comparison (Tokenomics)
Due to limited available data on the specific supply mechanisms of ERG and GMX, a comprehensive comparison cannot be provided at this time. Investors are advised to consult official project documentation for detailed tokenomics information.
Institutional Adoption and Market Application
Insufficient data is available regarding institutional holdings, enterprise adoption patterns, and regulatory attitudes across different jurisdictions for ERG and GMX. Market participants should conduct independent research through official channels and regulatory filings.
Technology Development and Ecosystem Building
Without specific information on recent technical upgrades, development roadmaps, or ecosystem applications for either ERG or GMX, a meaningful comparison of their technology trajectories and ecosystem maturity cannot be established.
Macroeconomic Factors and Market Cycles
The relationship between macroeconomic conditions and the performance of ERG and GMX remains unclear based on available information. Factors such as inflation dynamics, monetary policy shifts, interest rate environments, and geopolitical developments may influence cryptocurrency markets broadly, though specific impacts on these assets cannot be determined without supporting data.
III. 2026-2031 Price Forecast: ERG vs GMX
Short-term Forecast (2026)
- ERG: Conservative $0.428-$0.442 | Optimistic $0.442-$0.587
- GMX: Conservative $4.95-$7.17 | Optimistic $7.17-$9.68
Mid-term Forecast (2028-2029)
- ERG may enter a growth phase with projected price range of $0.37-$0.94
- GMX may enter an expansion phase with projected price range of $7.47-$12.42
- Key drivers: institutional capital inflows, ETF developments, ecosystem expansion
Long-term Forecast (2030-2031)
- ERG: Base scenario $0.44-$0.82 | Optimistic scenario $0.96-$1.09
- GMX: Base scenario $10.55-$12.16 | Optimistic scenario $12.85-$17.02
View detailed price predictions for ERG and GMX
Disclaimer
ERG:
| Year |
Predicted High Price |
Predicted Average Price |
Predicted Low Price |
Price Change |
| 2026 |
0.587461 |
0.4417 |
0.428449 |
0 |
| 2027 |
0.632934015 |
0.5145805 |
0.385935375 |
16 |
| 2028 |
0.83768559595 |
0.5737572575 |
0.372942217375 |
29 |
| 2029 |
0.93860949754425 |
0.705721426725 |
0.65632092685425 |
59 |
| 2030 |
1.093480064639051 |
0.822165462134625 |
0.443969349552697 |
86 |
| 2031 |
1.024870356823916 |
0.957822763386838 |
0.718367072540128 |
116 |
GMX:
| Year |
Predicted High Price |
Predicted Average Price |
Predicted Low Price |
Price Change |
| 2026 |
9.6822 |
7.172 |
4.94868 |
0 |
| 2027 |
10.618146 |
8.4271 |
5.814699 |
17 |
| 2028 |
11.52237383 |
9.522623 |
9.14171808 |
32 |
| 2029 |
12.4165481297 |
10.522498415 |
7.47097387465 |
46 |
| 2030 |
12.845866065032 |
11.46952327235 |
10.551961410562 |
60 |
| 2031 |
17.0207725361674 |
12.157694668691 |
11.67138688194336 |
69 |
IV. Investment Strategy Comparison: ERG vs GMX
Long-term vs Short-term Investment Strategies
- ERG: May appeal to investors interested in DeFi infrastructure development and foundational blockchain technology applications, with consideration for higher volatility patterns.
- GMX: May suit investors seeking exposure to decentralized exchange platforms and derivatives trading ecosystems, with attention to platform utility dynamics.
Risk Management and Asset Allocation
- Conservative Investors: ERG 30% vs GMX 70% - emphasizing platforms with established trading utility
- Aggressive Investors: ERG 50% vs GMX 50% - balanced exposure to infrastructure and application layers
- Hedging Tools: stablecoin allocation, options strategies, cross-asset portfolio diversification
V. Potential Risk Comparison
Market Risk
- ERG: Experienced a 72.84% decline over the past year, reflecting substantial price volatility and sensitivity to broader market conditions.
- GMX: Recorded a 68.74% decline over the past year, indicating similar exposure to market downturns despite different fundamental positioning.
Technical Risk
- ERG: Considerations include network scalability development, ecosystem expansion progress, and smart contract platform stability.
- GMX: Factors involve platform liquidity depth, trading mechanism resilience, and smart contract security architecture.
Regulatory Risk
- Global regulatory developments may impact both assets differently: DeFi infrastructure platforms face evolving compliance frameworks, while decentralized exchange protocols encounter specific derivatives trading regulations across jurisdictions.
VI. Conclusion: Which Is the Better Buy?
📌 Investment Value Summary:
- ERG Characteristics: Positioning in DeFi foundational infrastructure with current price at $0.4414, representing potential exposure to smart contract platform development.
- GMX Characteristics: Focus on decentralized perpetual trading with current price at $7.167, offering exposure to derivatives exchange ecosystem growth.
✅ Investment Considerations:
- Novice Investors: Consider starting with smaller positions in either asset, prioritizing understanding of platform fundamentals and risk tolerance assessment before allocation.
- Experienced Investors: May evaluate portfolio diversification through measured exposure to both infrastructure (ERG) and application layer (GMX) assets, with attention to risk-adjusted positioning.
- Institutional Investors: Should conduct comprehensive due diligence on platform architecture, ecosystem metrics, and regulatory compliance frameworks before considering allocation.
⚠️ Risk Disclosure: Cryptocurrency markets exhibit substantial volatility. This content does not constitute investment advice.
VII. FAQ
Q1: What are the main differences between ERG and GMX in terms of their market positioning?
ERG positions itself as a foundational public blockchain focused on DeFi infrastructure, emphasizing efficient and secure implementation of financial contracts since its 2019 mainnet launch. GMX, conversely, operates as a decentralized perpetual exchange where the token functions as both a utility and governance instrument while capturing 30% of platform-generated fees. This fundamental distinction means ERG serves as infrastructure-layer technology supporting broader DeFi applications, while GMX represents an application-layer protocol specifically designed for derivatives trading.
Q2: How have ERG and GMX performed historically compared to their all-time highs?
Both assets have experienced substantial declines from their respective peaks. ERG reached its historical high of $18.72 on September 3, 2021, and currently trades at $0.4414, representing a significant downward movement from its peak. GMX achieved its all-time high of $91.07 on April 18, 2023, and currently trades at $7.167. Over the past year specifically, ERG has declined 72.84% while GMX has fallen 68.74%, indicating both assets have faced considerable price pressure despite their different market cycles and peak timing.
Q3: What are the current short-term price projections for ERG and GMX in 2026?
For 2026, ERG shows conservative price projections ranging from $0.428 to $0.442, with optimistic scenarios extending to $0.442-$0.587. GMX presents conservative estimates between $4.95 and $7.17, with optimistic projections reaching $7.17-$9.68. These forecasts suggest ERG may experience relatively modest price movements in the near term, while GMX demonstrates wider potential price ranges reflecting its current market positioning and trading dynamics.
Q4: How should different investor types approach portfolio allocation between ERG and GMX?
Conservative investors might consider a 30% ERG and 70% GMX allocation, emphasizing platforms with established trading utility and operational track records. Aggressive investors may prefer a 50-50 split, balancing exposure between infrastructure development (ERG) and application-layer protocols (GMX). All allocation strategies should incorporate appropriate risk management tools including stablecoin reserves, options hedging mechanisms, and cross-asset diversification to mitigate the substantial volatility both assets have demonstrated.
Q5: What are the primary risk factors investors should evaluate for ERG and GMX?
Market risk remains significant for both assets, as evidenced by their respective 72.84% (ERG) and 68.74% (GMX) annual declines. Technical risks differ by platform: ERG faces considerations around network scalability, ecosystem expansion, and smart contract stability, while GMX must address liquidity depth, trading mechanism resilience, and security architecture. Regulatory risk affects both assets but manifests differently—ERG encounters evolving DeFi infrastructure compliance frameworks, whereas GMX faces specific derivatives trading regulations across multiple jurisdictions.
Q6: What timeframe shows the most promising growth potential for ERG versus GMX?
Long-term projections for 2030-2031 suggest both assets may experience growth trajectories. ERG's base scenario forecasts $0.44-$0.82 with optimistic scenarios reaching $0.96-$1.09, potentially representing a 116% increase from current levels by 2031. GMX projects a base scenario of $10.55-$12.16 with optimistic scenarios extending to $12.85-$17.02, suggesting potential 69% growth by 2031. These projections indicate mid-to-long-term holding periods may be necessary for meaningful appreciation, though substantial uncertainty remains given current market conditions.
Q7: How does the current market sentiment affect investment decisions between ERG and GMX?
The current Fear & Greed Index stands at 32 (Fear territory), reflecting cautious market sentiment. Recent performance shows ERG declining 2.83% in 24 hours and 0.2% over 7 days, while GMX fell 1.00% in 24 hours and 8.74% over 7 days. This fearful sentiment environment typically presents both heightened risk and potential accumulation opportunities for longer-term investors. However, the sustained negative momentum across multiple timeframes (30-day and 1-year periods) for both assets suggests careful position sizing and staged entry strategies may be prudent rather than concentrated single-entry positions.
Q8: What information gaps should investors be aware of when comparing ERG and GMX?
Critical data limitations exist for comprehensive evaluation. Specific tokenomics details, supply mechanisms, and distribution schedules remain unclear for both assets. Institutional adoption patterns, enterprise integration metrics, and regulatory compliance status across jurisdictions lack sufficient documentation. Technical development roadmaps, ecosystem application growth, and recent upgrade implementations also require further research through official project channels. Investors should acknowledge these information gaps and conduct independent due diligence before making allocation decisions, recognizing that incomplete data increases investment uncertainty.
* The information is not intended to be and does not constitute financial advice or any other recommendation of any sort offered or endorsed by Gate.