This comprehensive Ethereum price forecast analyzes ETH's critical technical juncture at $3,160, trapped within a contracting symmetrical triangle pattern since August highs. The article examines key resistance levels, particularly the pivotal $3,653 threshold crucial for bullish reversal confirmation. It evaluates current momentum weakness with RSI at 34, outlines detailed support zones from $3,060 to $2,192, and explores both bearish breakdown and bullish breakout scenarios. Technical analysis incorporates moving averages, candlestick patterns, and volume confirmation signals. The forecast provides traders with clearly defined entry/exit strategies and risk management levels for navigating Ethereum's imminent directional breakout from consolidation.
Ethereum Price Prediction: Critical Technical Juncture
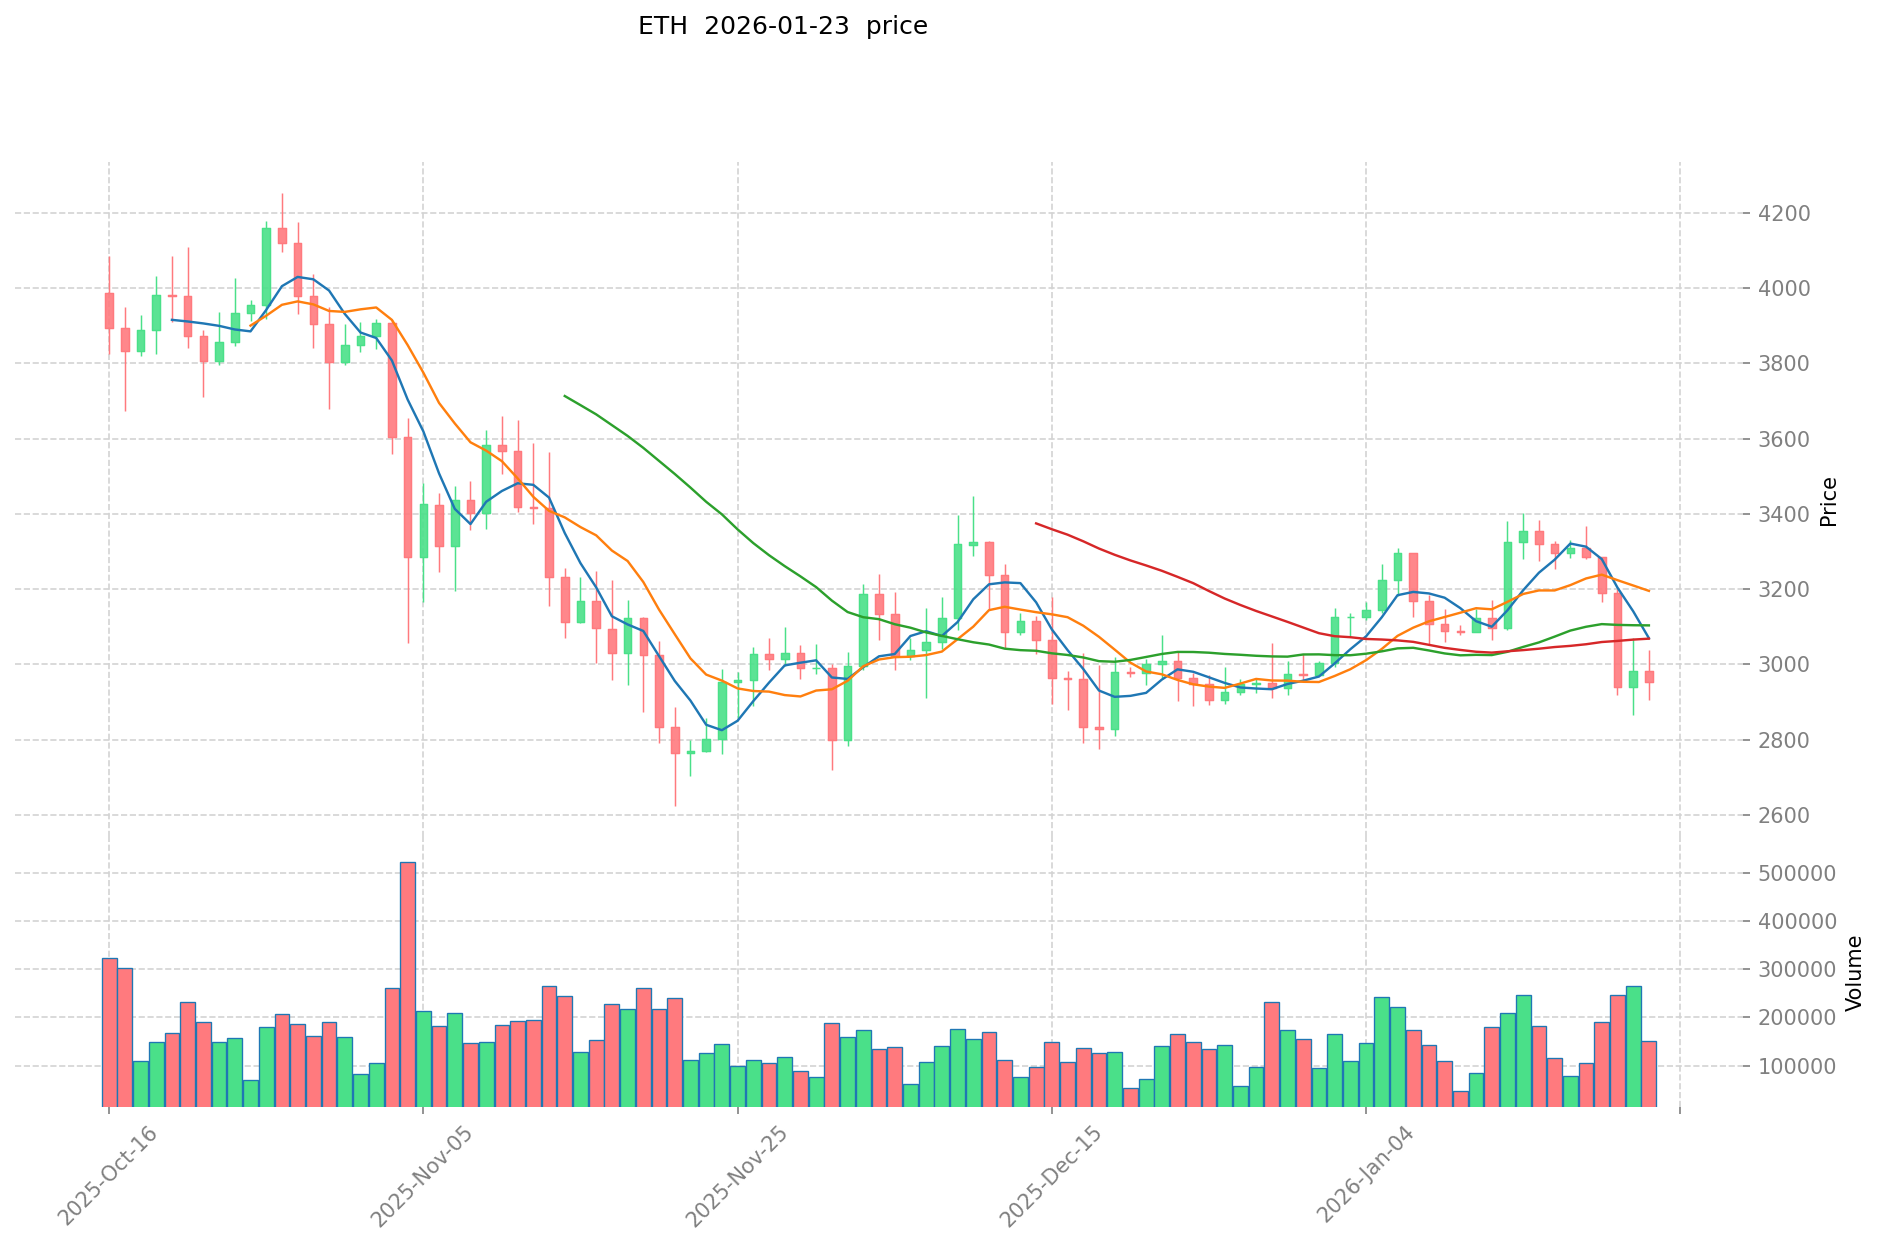
Ethereum recently entered a critical trading phase, with the price hovering around $3,160 after a modest gain in recent trading sessions. As the second-largest cryptocurrency by market capitalization, valued at approximately $381.6 billion, ETH finds itself compressed within one of its most significant technical structures observed in recent years: a broad symmetrical triangle pattern that has been contracting since the August highs.
This moment represents a pivotal juncture due to the convergence of two major trendlines. The long-term rising trendline, which originated from the April breakout, continues to function as crucial structural support. Meanwhile, a firm descending trendline has consistently rejected every rally attempt over nearly three months. ETH is currently positioned directly at this apex—a technical point where markets historically demonstrate difficulty maintaining neutrality for extended periods.
The symmetrical triangle pattern is particularly significant in technical analysis as it represents a period of consolidation before a decisive breakout. When price action compresses near the apex of such formations, volatility typically increases dramatically as market participants position themselves for the next major move. The longer the consolidation period, the more explosive the eventual breakout tends to be.
Recent price action reflects considerable market uncertainty. Long lower wicks on candlestick formations indicate that buyers are actively defending the $3,060 demand zone, suggesting strong accumulation interest at these levels. However, small-bodied recovery candles signal hesitation and lack of conviction near the descending trendline. Additionally, the 20-day Exponential Moving Average (EMA) has turned lower, creating dynamic resistance that sellers continue to utilize as a reference point for short positions.
The interplay between these technical elements creates a high-stakes environment where either bulls or bears will likely gain decisive control in the near term. Understanding this technical setup is crucial for traders and investors attempting to navigate Ethereum's next significant price movement.
Momentum Weakens as ETH Approaches Breakout Zone
ETH's momentum profile currently leans bearish, with the Relative Strength Index (RSI) positioned at 34—firmly below the neutral midline of 50 but not yet reaching oversold territory or forming bullish divergence. This alignment between price action and momentum indicators suggests that sellers maintain influence over market direction, rather than showing signs of exhaustion that might precede a reversal.
The RSI is a momentum oscillator that measures the speed and magnitude of price movements. When RSI readings fall below 40, it indicates that selling pressure has been dominant, though not necessarily extreme. The current RSI level of 34 suggests moderate bearish momentum without the panic selling that would push the indicator into deeply oversold territory below 30.
Historically, Ethereum has demonstrated the capacity to stage significant recoveries from similar RSI levels, but these reversals have typically required confirmation from price action at key trendline support levels. The absence of bullish divergence—where RSI makes higher lows while price makes lower lows—means that momentum has not yet shifted in favor of buyers, making any recovery attempt more challenging.
Key near-term technical levels that traders should monitor include:
Support Levels:
- $3,060: The immediate support zone representing the current demand area where buyers have consistently stepped in. A break below this level would invalidate the current consolidation structure.
- $2,632: The secondary support level that would come into play if the primary support fails. This level corresponds to a previous consolidation zone and represents a 16% decline from current levels.
- $2,192: A major support shelf that aligns with longer-term moving averages and represents a critical psychological level. Reaching this point would constitute a 30% correction from current prices.
Resistance Levels:
- $3,485: The upper boundary of the symmetrical triangle pattern, representing the first significant hurdle for any bullish breakout attempt.
- $3,653: The critical resistance level that would formally flip the bearish structure. A daily close above this level would signal a structural reversal and confirm bullish momentum.
- $4,242: A major resistance shelf representing the next significant target in a bullish scenario. This level corresponds to previous consolidation areas and would represent a 34% gain from current levels.
Structure Trigger: A confirmed daily close above $3,653 would break the prevailing bearish pattern and potentially initiate a new uptrend phase.
ETH's current positioning inside the triangle formation suggests that a decisive directional move is approaching. Symmetrical triangles typically resolve when price reaches 70-75% of the distance from the base to the apex, and Ethereum appears to be nearing this critical zone. If buyers successfully defend the $3,060 support level and produce a bullish engulfing candlestick pattern—where a green candle completely engulfs the prior red candle—the first upside target would be the triangle's upper boundary near $3,485.
Following a breakout above $3,485, attention would shift to the critical $3,653 level, which represents both a technical and psychological barrier. Successfully reclaiming this level would allow ETH to recover the 20-day EMA, retest the descending trendline from above (converting previous resistance into support), and potentially accelerate toward the $4,242 resistance shelf. Such a move would likely attract momentum traders and could trigger stop-loss orders from short positions, further fueling upward momentum.
Ethereum Forecast: ETH's Next Move Could Be Sudden
Ethereum's price prediction appears neutral in the immediate term as the symmetrical triangle pattern continues to develop. However, the compressed nature of current price action suggests that when a breakout occurs, it will likely be swift and decisive. Symmetrical triangles are known for producing explosive moves once price escapes the consolidation pattern, with the magnitude of the move often corresponding to the height of the triangle at its widest point.
In a bearish scenario, a clean breakdown below the $3,060 support level would snap the long-term rising trendline that has provided structural support since April. This would represent a significant technical development, exposing ETH to a deeper pullback targeting $2,632 initially, followed by $2,192—the next two major liquidity zones visible on the daily chart. These levels represent areas where substantial buy and sell orders are likely concentrated, making them natural targets for price discovery.
Given the tight compression of price action within the triangle, any violation of support could trigger a fast, momentum-driven decline. This is because stop-loss orders from long positions would likely cluster just below the $3,060 level, and their triggering could create a cascade effect. Additionally, algorithmic trading systems programmed to recognize triangle breakdowns might add selling pressure, amplifying the initial move.
The bearish scenario would be further confirmed if accompanied by increasing volume on the breakdown, RSI breaking below 30 into oversold territory, and the 20-day EMA continuing to slope downward. Traders watching for such a breakdown should also monitor Bitcoin's price action, as Ethereum often correlates strongly with the broader cryptocurrency market leader.
Conversely, if ETH successfully reclaims the $3,653 level with a confirmed daily close, the market narrative would flip instantly. This level represents both structural reversal and a psychological shift back in favor of buyers. A close above $3,653 would confirm a bullish breakout from the symmetrical triangle, setting the stage for a renewed uptrend phase that could extend into the following weeks or months.
In the bullish scenario, several technical confirmations would strengthen the case for continued upside:
- Volume expansion on the breakout, indicating genuine buying interest rather than a false breakout
- RSI climbing back above 50, confirming momentum shift to bullish territory
- The 20-day EMA turning upward and providing dynamic support
- Price successfully retesting the $3,653 level from above, converting previous resistance into support
Traders and investors should prepare for increased volatility as Ethereum approaches the resolution of this technical pattern. Position sizing should account for the potential for rapid price movements in either direction. Those with existing positions might consider using the clearly defined support and resistance levels for stop-loss placement and profit-taking strategies.
The coming trading sessions will be crucial in determining whether Ethereum can mount a sustainable recovery or if further consolidation or decline is necessary before the next major uptrend can develop. Market participants should closely monitor volume patterns, momentum indicators, and the broader cryptocurrency market environment for additional context on Ethereum's likely direction.
Regardless of the immediate outcome, the symmetrical triangle pattern suggests that Ethereum is building energy for its next significant move. Patience and disciplined risk management will be essential for navigating this critical technical juncture in Ethereum's price action.
FAQ
What is the current price of Ethereum (ETH)? What is the significance of the $3,653 price level?
ETH's price fluctuates in real-time markets. The $3,653 level is a critical resistance point; reclaiming it would break bearish structure and signal potential bullish momentum reversal for continued upward movement.
What is Bullish/Bearish Structure? What does it mean that Ethereum needs to break through $3,653 to change the bearish structure?
Bullish/Bearish Structure refers to price patterns showing market direction. When ETH breaks $3,653, it signals a shift from bearish to bullish momentum, indicating potential upward price movement and stronger buyer control in the market.
In Ethereum's technical analysis, is $3,653 a key support or resistance level?
$3,653 functions as a critical resistance level for ETH. Breaking above this price would invalidate the bearish structure and signal a potential bullish reversal. This level represents a significant barrier that traders are closely monitoring.
What factors are typically used in Ethereum price predictions? How to conduct technical analysis?
Ethereum price predictions rely on key factors: market sentiment, trading volume, on-chain metrics, macroeconomic conditions, and regulatory news. Technical analysis involves studying support/resistance levels, moving averages, RSI indicators, and chart patterns to identify trend reversals and price targets like the critical $3,653 resistance level.
If Ethereum fails to reclaim $3,653, what price level could it drop to and how significant is the risk?
If ETH fails to reclaim $3,653, it could test $3,200-$3,000 support levels. The risk is substantial as breaking below this zone may trigger further downside toward $2,800, representing a 23% decline from current levels and confirming bearish structure continuation.
What is the relationship between recent Ethereum trends and Bitcoin? What impact do macroeconomic factors have on ETH price?
ETH typically moves in correlation with Bitcoin as both are driven by market sentiment and macroeconomic factors. Interest rate changes, inflation data, and risk appetite significantly influence ETH price movements. When Bitcoin strengthens, ETH often follows, though ETH can outperform during altseason periods driven by DeFi and ecosystem developments.
* The information is not intended to be and does not constitute financial advice or any other recommendation of any sort offered or endorsed by Gate.