This comprehensive guide compares EVAA Protocol and Kava, two leading blockchain validation platforms with distinct market positioning and technical architectures. EVAA, launched in 2025 within the TON ecosystem, focuses on lending and yield generation with open-source smart contracts and Pyth Oracle integration, currently trading at $0.83. Kava, operational since 2019, functions as established cross-chain DeFi infrastructure with dual-chain architecture combining Cosmos Co-Chain and EVM Co-Chain, trading at $0.08 on Gate. The article analyzes historical price performance, tokenomics mechanisms, institutional adoption channels, technical ecosystems, and investment value propositions. Long-term forecasts through 2031 suggest different growth trajectories, with EVAA positioned for emerging DeFi protocols and Kava offering mature cross-chain infrastructure exposure. Strategic allocation frameworks range from 30% EVAA/70% Kava for conservative investors to 60% EVAA/40% Kava for aggressive portfolios, considering
Introduction: Investment Comparison Between EVAA and KAVA
In the cryptocurrency market, the comparison between EVAA vs KAVA has been a topic that investors cannot avoid. Both show significant differences in market cap ranking, application scenarios, and price performance, representing distinct positioning in the crypto asset landscape.
EVAA Protocol (EVAA): Launched in 2025, it has gained market recognition through its focus on lending and yield generation within the TON ecosystem, featuring open-source smart contracts and Pyth Oracle integrations.
Kava (KAVA): Since its launch in 2019, it has been positioned as a cross-chain DeFi platform providing collateralized lending and stablecoin services for mainstream digital assets, forming a decentralized bank infrastructure for digital assets.
This article will provide a comprehensive analysis of the investment value comparison between EVAA vs KAVA, covering historical price trends, supply mechanisms, institutional adoption, technical ecosystems, and future predictions, attempting to answer the most pressing question for investors:
"Which is the better buy right now?"
I. Historical Price Comparison and Market Status
EVAA and KAVA Historical Price Trends
-
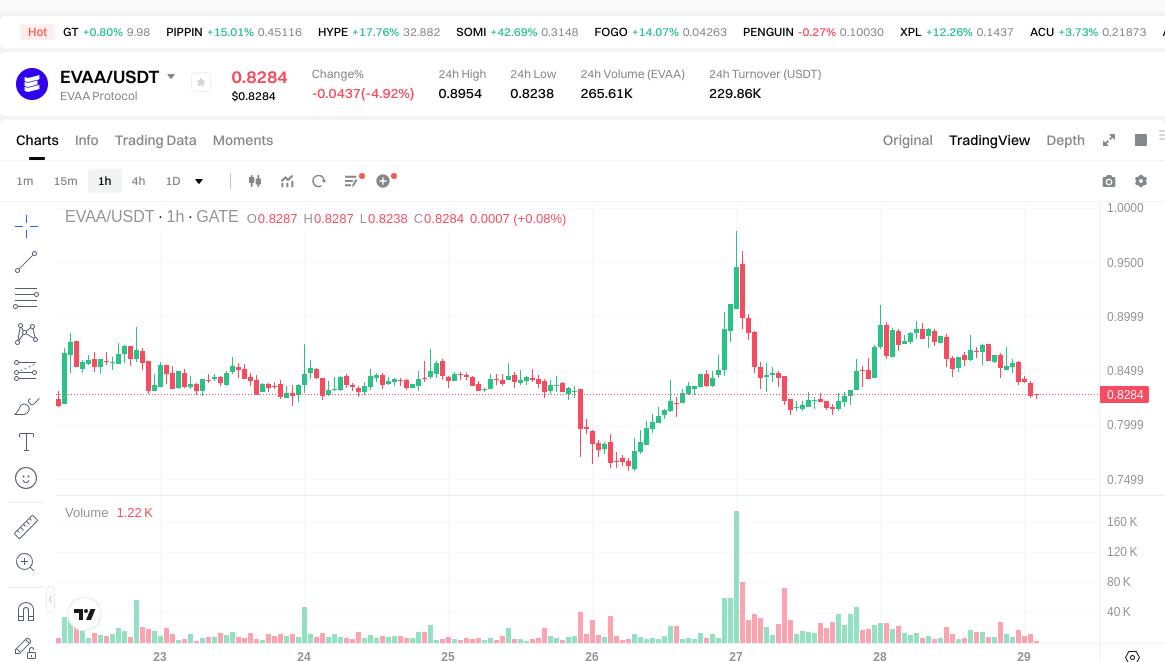
EVAA Protocol reached its peak price of $13.71 in October 2025, representing a significant valuation milestone shortly after its launch period. Subsequently, the token experienced substantial volatility, declining to a low of $0.61 by December 2025.
-
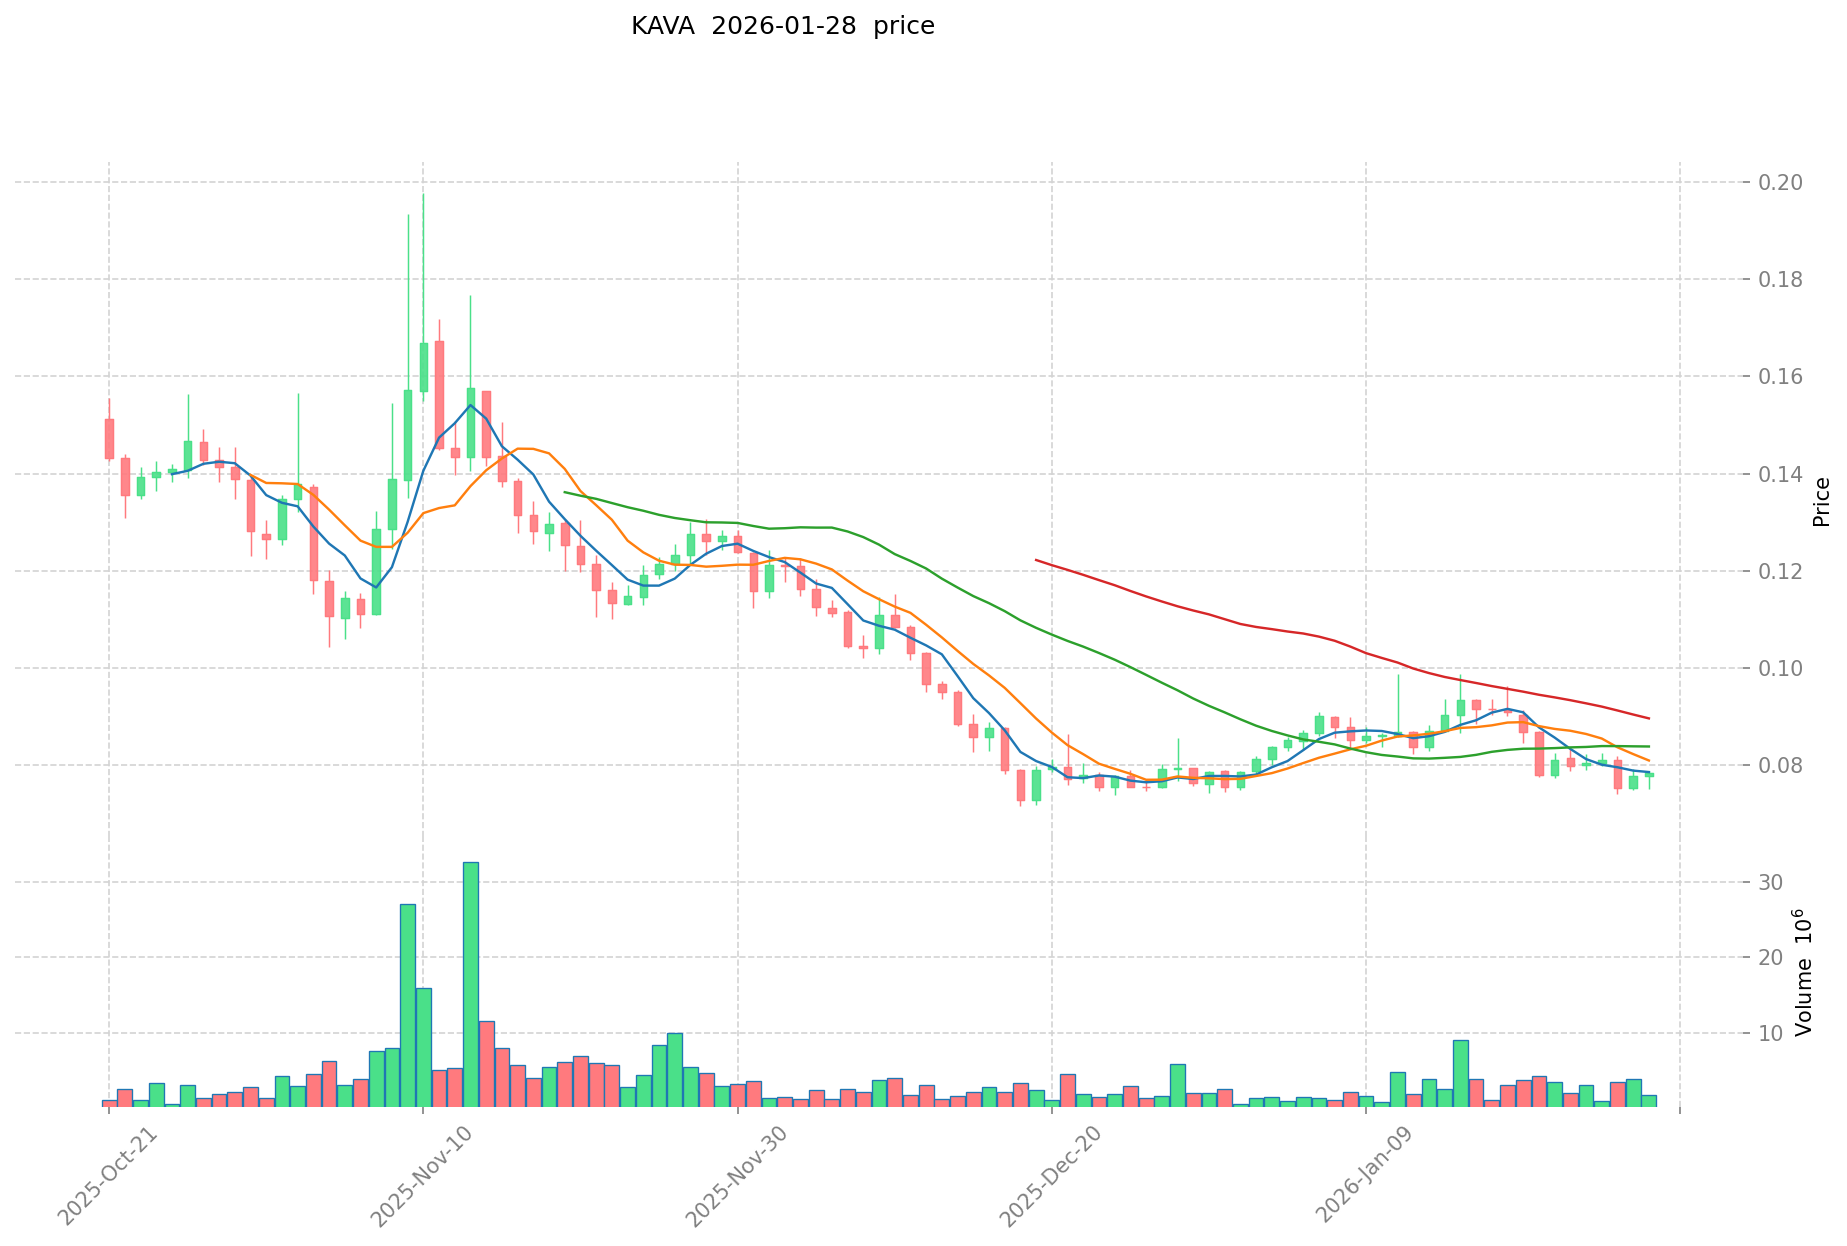
Kava's price history shows a broader timeframe, with its all-time high of $9.12 recorded in August 2021 during a period of elevated market activity. The token reached its historical low of $0.07 in December 2025.
-
Comparative analysis: EVAA Protocol, as a newer market entrant with its token generation event occurring in October 2025, has exhibited different price dynamics compared to Kava's longer market presence since 2019. EVAA's price movement from $13.71 to $0.61 over a few months reflects initial volatility patterns, while Kava's trajectory from $9.12 to current levels demonstrates a longer-term market cycle adjustment.
Current Market Status (January 29, 2026)
- EVAA Protocol current price: $0.83
- Kava current price: $0.08
- 24-hour trading volume: EVAA recorded $230,760 compared to Kava's $125,813
- Market sentiment index (Fear & Greed Index): 29 (Fear)
View real-time prices:
- Check EVAA current price Market Price
- Check KAVA current price Market Price
II. Core Factors Influencing EVAA vs KAVA Investment Value
Supply Mechanism Comparison (Tokenomics)
-
EVAA: The reference materials indicate that ecosystem development progress and market liquidity influence EVAA pricing. The protocol appears to operate within a framework where token value correlates with platform growth and trader participation levels.
-
KAVA: KAVA implements a buyback-and-burn mechanism as part of its value capture strategy, using operational profits to systematically reduce circulating supply. This deflationary approach aims to create long-term value through supply compression.
-
📌 Historical Pattern: Supply mechanisms with systematic reduction components have historically demonstrated correlation with price appreciation during growth phases, though the magnitude depends on protocol revenue generation and market conditions.
Institutional Adoption and Market Application
-
Institutional Holdings: Reference materials highlight KAVA's strategic partnerships with major centralized exchanges, suggesting stronger institutional integration channels. The platform has established collaborations aimed at expanding accessibility and operational workflows.
-
Enterprise Adoption: KAVA positions itself as a cross-chain financial infrastructure connecting DeFi and CeFi environments. The platform focuses on optimizing user experience to facilitate institutional and retail participation. EVAA's enterprise adoption status remains less documented in available materials.
-
Regulatory Landscape: Both projects operate within evolving regulatory frameworks. KAVA's approach emphasizes compliance integration and partnership-based expansion, though specific jurisdictional regulatory stances are not detailed in the reference materials.
Technical Development and Ecosystem Construction
-
KAVA Technical Architecture: The platform employs a dual-chain structure combining Cosmos Co-Chain for high-performance consensus and cross-chain communication with an EVM Co-Chain for Ethereum developer compatibility. The Translator module facilitates interoperability between these environments.
-
EVAA Technical Development: Available materials indicate EVAA operates as a lending protocol with emphasis on ecosystem integration, though specific technical upgrade details are limited in the reference materials.
-
Ecosystem Comparison: KAVA has launched developer incentive programs following its mainnet upgrades, with reported ecosystem projects approaching significant scale. The platform demonstrates activity across DeFi infrastructure, particularly in lending and cross-chain asset management. EVAA's ecosystem positioning centers on liquidity provision and lending services, with development progress serving as a key price influence factor.
Macroeconomic Context and Market Cycles
-
Performance in Inflationary Environments: Both projects position themselves within the DeFi infrastructure category, which historically shows sensitivity to broader crypto market cycles rather than direct inflation hedging characteristics. KAVA's cross-chain interoperability may provide diversification benefits across multiple blockchain economies.
-
Macroeconomic Monetary Policy: Both assets demonstrate correlation with risk asset sentiment, influenced by traditional financial market conditions including interest rate environments and liquidity dynamics. The crypto asset class broadly responds to shifts in global monetary policy stances.
-
Geopolitical Factors: KAVA's focus on cross-chain infrastructure and CeFi-DeFi integration positions it within the broader narrative of decentralized financial accessibility. Demand for cross-border settlement solutions and decentralized financial infrastructure may influence both projects' adoption trajectories, though specific geopolitical impacts are not quantified in available materials.
III. 2026-2031 Price Forecast: EVAA vs KAVA
Short-term Forecast (2026)
- EVAA: Conservative $0.447-$0.828 | Optimistic $0.828-$1.002
- KAVA: Conservative $0.050-$0.077 | Optimistic $0.077-$0.088
Mid-term Forecast (2028-2029)
- EVAA may enter a consolidation phase, with projected price range of $0.620-$1.484
- KAVA may enter a growth phase, with projected price range of $0.063-$0.116
- Key drivers: institutional capital inflows, ETF developments, ecosystem expansion
Long-term Forecast (2030-2031)
- EVAA: Baseline scenario $0.839-$1.465 | Optimistic scenario $1.398-$1.958
- KAVA: Baseline scenario $0.099-$0.143 | Optimistic scenario $0.127-$0.171
View detailed price forecasts for EVAA and KAVA
Disclaimer
EVAA:
| Year |
Predicted High Price |
Predicted Average Price |
Predicted Low Price |
Price Change |
| 2026 |
1.001759 |
0.8279 |
0.447066 |
0 |
| 2027 |
1.15268517 |
0.9148295 |
0.576342585 |
10 |
| 2028 |
1.3232093888 |
1.033757335 |
0.620254401 |
24 |
| 2029 |
1.484889035994 |
1.1784833619 |
1.143128861043 |
42 |
| 2030 |
1.4648548188417 |
1.331686198947 |
0.83896230533661 |
60 |
| 2031 |
1.95757871245209 |
1.39827050889435 |
0.992772061314988 |
68 |
KAVA:
| Year |
Predicted High Price |
Predicted Average Price |
Predicted Low Price |
Price Change |
| 2026 |
0.0881562 |
0.07733 |
0.0502645 |
0 |
| 2027 |
0.111703185 |
0.0827431 |
0.046336136 |
7 |
| 2028 |
0.117640002425 |
0.0972231425 |
0.063195042625 |
26 |
| 2029 |
0.1160260982595 |
0.1074315724625 |
0.08809388941925 |
39 |
| 2030 |
0.14301290926208 |
0.111728835361 |
0.09943866347129 |
45 |
| 2031 |
0.170676968897463 |
0.12737087231154 |
0.105717824018578 |
65 |
IV. Investment Strategy Comparison: EVAA vs KAVA
Long-term vs Short-term Investment Strategies
-
EVAA: May appeal to investors focusing on emerging DeFi lending protocols within the TON ecosystem. The protocol's relatively recent market entry (2025) and focus on yield generation suggest positioning for participants interested in early-stage DeFi infrastructure development. The price volatility observed since launch indicates characteristics more aligned with higher-risk, growth-oriented positioning.
-
KAVA: May suit investors seeking exposure to established cross-chain DeFi infrastructure with longer operational history since 2019. The platform's dual-chain architecture and focus on bridging CeFi-DeFi environments position it for participants interested in cross-chain interoperability narratives. The buyback-and-burn mechanism provides a systematic supply reduction component that may appeal to those examining longer-term tokenomics structures.
Risk Management and Asset Allocation
-
Conservative Investors: A potential allocation framework might consider 30% EVAA vs 70% KAVA, reflecting KAVA's longer operational track record and established ecosystem partnerships. This approach emphasizes exposure to more mature protocol infrastructure while maintaining limited allocation to newer market entrants.
-
Aggressive Investors: A potential allocation framework might consider 60% EVAA vs 40% KAVA, reflecting higher tolerance for volatility and focus on potential growth dynamics of emerging protocols. This approach increases exposure to earlier-stage projects while maintaining diversification across different ecosystem positions.
-
Hedging Tools: Implementation of stablecoin reserves for liquidity management, utilization of options instruments where available for downside protection, and cross-token portfolio construction to mitigate single-asset concentration risk.
V. Potential Risk Comparison
Market Risk
-
EVAA: The protocol demonstrates significant price volatility, with movements from $13.71 to $0.61 within months following its token generation event. Limited historical data constrains pattern analysis for market cycle behavior. Trading volume of $230,760 suggests developing liquidity conditions that may experience wider bid-ask spreads during market stress periods.
-
KAVA: Extended price decline from $9.12 to current levels reflects broader market cycle adjustments and competitive dynamics within the cross-chain DeFi sector. Trading volume of $125,813 indicates moderate liquidity depth. The platform faces ongoing competitive pressure from alternative cross-chain infrastructure solutions and Layer 2 scaling developments.
Technical Risk
-
EVAA: As a lending protocol with emphasis on oracle integration (Pyth Oracle), the platform faces technical dependencies on external data feeds for price accuracy. Limited documentation in reference materials regarding scalability parameters and network stress testing results. Smart contract security relies on open-source verification, though audit frequency and scope details are not specified in available materials.
-
KAVA: The dual-chain architecture introduces complexity in maintaining interoperability between Cosmos Co-Chain and EVM Co-Chain environments. Cross-chain bridge operations carry inherent security considerations common to multi-chain infrastructure. The Translator module's reliability becomes critical for maintaining seamless asset transfers between chain environments.
Regulatory Risk
- Both projects operate within evolving regulatory frameworks for decentralized finance protocols. EVAA's positioning within lending services may face scrutiny under securities regulations depending on jurisdictional interpretations of yield-generating mechanisms. KAVA's focus on bridging CeFi-DeFi environments and stablecoin services may encounter regulatory examination related to payment systems and collateralized lending activities. The cross-chain nature of KAVA's infrastructure may present additional compliance considerations across multiple jurisdictions where connected blockchain networks operate.
VI. Conclusion: Which Is the Better Buy?
📌 Investment Value Summary:
-
EVAA Advantages: Positioning within the TON ecosystem lending infrastructure, open-source smart contract framework with oracle integration, focus on emerging DeFi yield generation mechanisms. The protocol represents exposure to newer market segments with potential for ecosystem expansion as the TON platform develops.
-
KAVA Advantages: Established operational history since 2019 with demonstrated market cycle experience, dual-chain architecture enabling broad developer accessibility, systematic buyback-and-burn mechanism for supply management, strategic partnerships with centralized exchanges for institutional integration channels, cross-chain infrastructure positioning within DeFi-CeFi convergence narratives.
✅ Investment Recommendations:
-
Beginner Investors: Consider initiating exposure through smaller position sizing given current market sentiment (Fear Index: 29) and elevated volatility characteristics. Focus on understanding protocol fundamentals, tokenomics structures, and ecosystem development trajectories before establishing significant allocations. Maintain liquidity reserves and avoid concentration in single assets.
-
Experienced Investors: Evaluate allocation frameworks based on risk tolerance profiles and portfolio diversification objectives. Consider KAVA's longer operational track record and cross-chain positioning for more established infrastructure exposure, while assessing EVAA's potential within emerging TON ecosystem dynamics. Implement staged entry approaches during periods of elevated market uncertainty.
-
Institutional Investors: Conduct comprehensive due diligence on smart contract audits, liquidity depth analysis, and regulatory compliance frameworks. Assess KAVA's institutional partnership channels and cross-chain infrastructure maturity against investment mandates. Evaluate EVAA's protocol development roadmap and ecosystem integration progress. Consider correlation analysis with broader crypto market cycles and risk factor exposure within existing portfolio allocations.
⚠️ Risk Disclosure: Cryptocurrency markets demonstrate high volatility characteristics. This content does not constitute investment advice. Participants should conduct independent research and consult qualified financial advisors before making investment decisions.
VII. FAQ
Q1: What is the primary difference between EVAA and KAVA's technical architecture?
EVAA operates as a lending protocol within the TON ecosystem with oracle integration, while KAVA utilizes a dual-chain architecture combining Cosmos Co-Chain and EVM Co-Chain. EVAA focuses specifically on lending and yield generation services with Pyth Oracle integration for price feeds, representing a more specialized protocol design. KAVA's dual-chain structure enables both high-performance consensus through Cosmos and Ethereum developer compatibility through EVM, with a Translator module facilitating cross-chain interoperability. This architectural difference reflects EVAA's positioning as an ecosystem-specific lending platform versus KAVA's broader cross-chain DeFi infrastructure approach.
Q2: Which token has demonstrated greater price stability since launch?
KAVA has demonstrated greater price stability relative to its launch period, though both tokens have experienced significant volatility. EVAA launched in 2025 and experienced rapid price movement from $13.71 to $0.61 within months, representing approximately 95% decline in a short timeframe. KAVA, operational since 2019, declined from its $9.12 all-time high to current levels over a multi-year period, reflecting broader market cycle adjustments rather than concentrated volatility. The longer operational history and more gradual price adjustment pattern suggest KAVA exhibits characteristics more consistent with established market participants compared to EVAA's early-stage volatility profile.
Q3: How do the supply mechanisms of EVAA and KAVA differ?
KAVA implements a systematic buyback-and-burn mechanism using operational profits to reduce circulating supply, while EVAA's supply mechanism appears tied to ecosystem development and market liquidity. KAVA's deflationary approach creates programmatic supply compression intended to support long-term value capture as protocol revenue scales. EVAA's tokenomics structure correlates token value with platform growth and trader participation levels, though specific supply reduction mechanisms are not detailed in available materials. This fundamental difference means KAVA employs active supply management through burns, while EVAA's value proposition relates more directly to protocol adoption and ecosystem expansion metrics.
Q4: What is the current market sentiment for both tokens?
The current Fear & Greed Index stands at 29 (Fear), indicating cautious market sentiment affecting both tokens. EVAA trades at $0.83 with 24-hour volume of $230,760, while KAVA trades at $0.08 with volume of $125,813. The elevated fear sentiment suggests investors are exercising caution across crypto assets generally, which typically correlates with lower trading activity and increased price volatility. Both tokens are trading significantly below their historical peaks—EVAA down approximately 94% from its $13.71 high and KAVA down approximately 99% from its $9.12 peak. This market environment favors risk-aware positioning and staged entry strategies rather than concentrated single-asset allocations.
Q5: Which token offers better institutional adoption prospects?
KAVA demonstrates stronger documented institutional integration channels through strategic partnerships with major centralized exchanges and positioning as cross-chain financial infrastructure. The platform's focus on bridging DeFi-CeFi environments and seven-year operational track record provides established frameworks for institutional participation. KAVA's dual-chain architecture and compliance-oriented partnership approach align with institutional requirements for accessibility and operational workflows. EVAA's institutional adoption status remains less documented in available materials, with the protocol's recent 2025 launch and TON ecosystem positioning representing earlier-stage institutional engagement. For investors prioritizing institutional adoption indicators, KAVA's partnership infrastructure and longer market presence suggest more developed institutional channels.
Q6: What are the key risk factors specific to each token?
EVAA faces primary risks including limited operational history (launched 2025), significant early-stage price volatility (95% decline from peak), technical dependencies on external oracle systems, and developing liquidity conditions with $230,760 daily volume. KAVA's key risks include dual-chain architectural complexity requiring reliable cross-chain bridge operations, competitive pressure from alternative Layer 2 and cross-chain solutions, regulatory considerations around stablecoin services and collateralized lending, and extended price decline reflecting multi-year market cycle challenges. Both tokens face regulatory uncertainty in DeFi lending services, though KAVA's cross-chain infrastructure presents additional multi-jurisdictional compliance considerations. Market risk remains elevated for both assets given current Fear Index readings and distance from historical price peaks.
Q7: How do the 2026-2031 price forecasts compare between EVAA and KAVA?
EVAA's forecasted price range for 2026 spans $0.447-$1.002 (conservative to optimistic), with long-term 2031 projections reaching $0.839-$1.958. KAVA's 2026 forecast ranges from $0.050-$0.088, with 2031 projections of $0.099-$0.171. In percentage terms, EVAA's optimistic 2031 scenario represents approximately 136% appreciation from current $0.83 levels, while KAVA's optimistic scenario represents approximately 114% appreciation from current $0.08 levels. However, these forecasts assume various ecosystem development scenarios and market conditions. EVAA's projections reflect higher absolute price targets with corresponding volatility expectations, while KAVA's forecasts suggest gradual appreciation aligned with established infrastructure maturation. Both projections incorporate assumptions about institutional capital inflows, ETF developments, and ecosystem expansion that remain uncertain.
Q8: What allocation strategy best balances exposure to both tokens?
Conservative investors might consider 30% EVAA / 70% KAVA allocation, emphasizing KAVA's longer operational history and established partnerships while maintaining limited exposure to EVAA's emerging protocol dynamics. Aggressive investors with higher risk tolerance might implement 60% EVAA / 40% KAVA allocation, increasing exposure to potential growth dynamics of newer protocols while maintaining cross-ecosystem diversification. Both frameworks should incorporate stablecoin reserves for liquidity management, staged entry approaches given current Fear Index conditions, and position sizing appropriate to individual risk tolerance. Institutional participants should conduct comprehensive due diligence on smart contract audits, liquidity depth, and regulatory frameworks before establishing allocations. No single allocation framework suits all investors—appropriate positioning depends on risk tolerance profiles, investment timeframes, and portfolio diversification objectives.
* The information is not intended to be and does not constitute financial advice or any other recommendation of any sort offered or endorsed by Gate.