Discover the crypto divergence trading model—a robust technical analysis tool for spotting bullish and bearish divergences and crafting Bitcoin trading strategies on Gate. This is a complete guide designed for both cryptocurrency traders and investors.
What Is a Divergence Pattern?
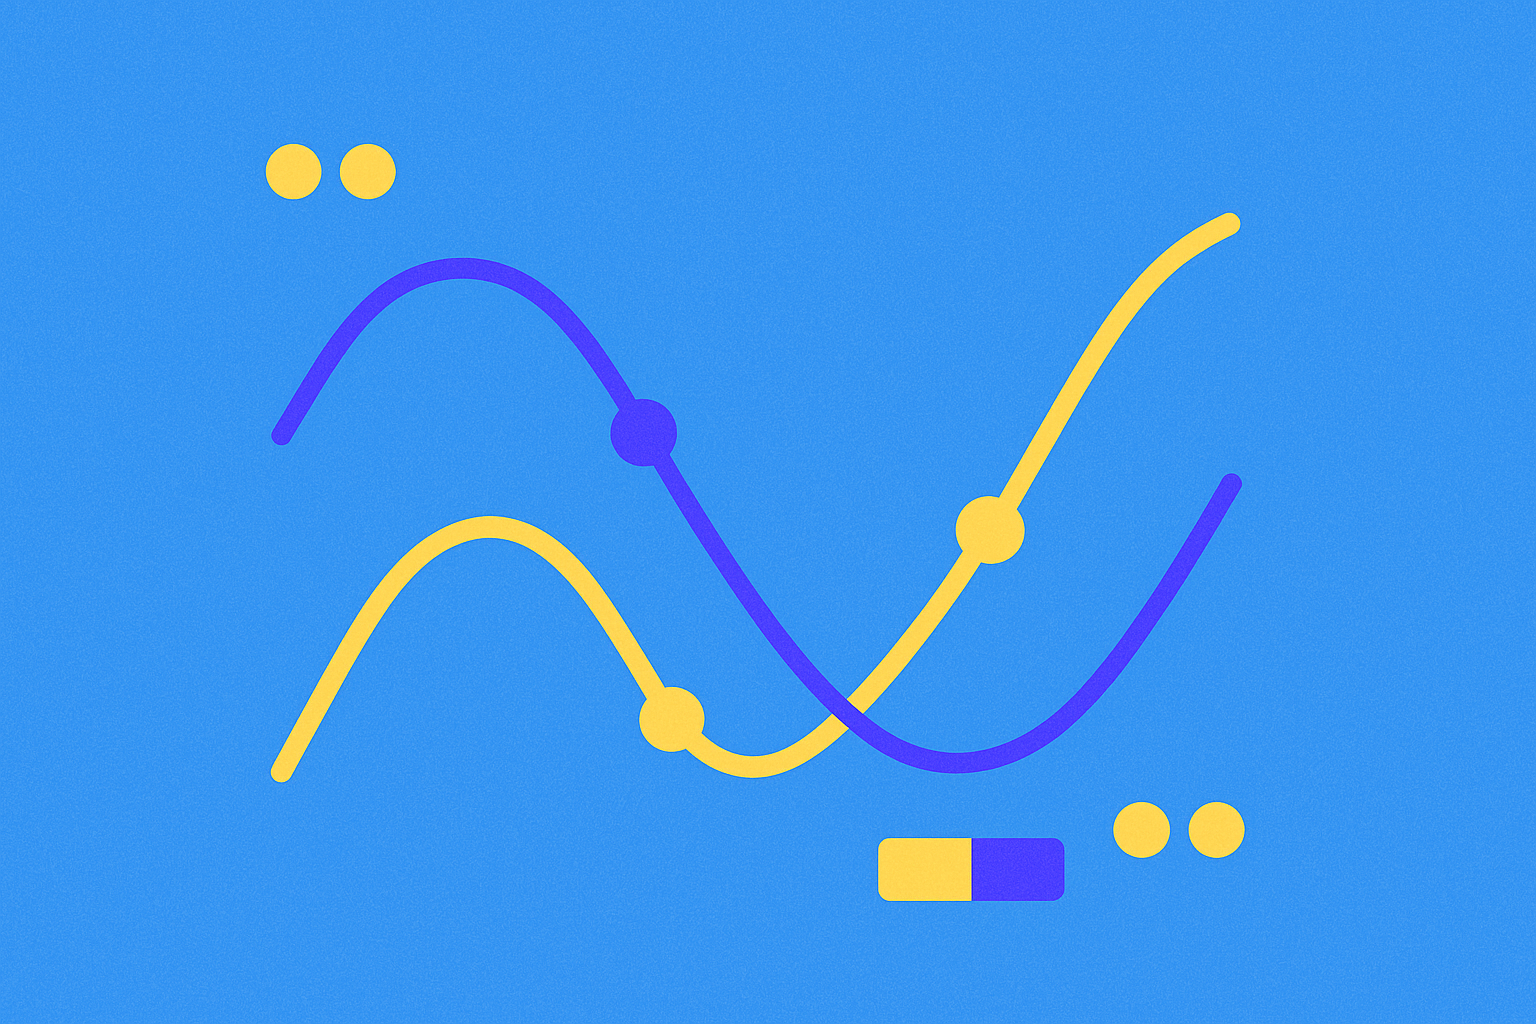
In finance—including cryptocurrency trading—a crucial technical concept is divergence. This pattern arises when an asset’s market price moves in the opposite direction from another data point, typically shown by technical analysis indicators. Professional traders and investors routinely rely on this chart pattern to gauge the market’s underlying strength.
Trading volume is one of the most widely used divergence indicators. Though straightforward, it can reveal critical divergence signals when it moves contrary to price. For example, if price climbs but trading volume steadily decreases, this may warn of negative divergence. Beyond volume, traders commonly use other technical indicators to detect divergence, such as Relative Strength Index (RSI) and Stochastic RSI.
Divergence is generally classified into two main types: bearish divergence and bullish divergence. Bullish divergence occurs when asset prices decline and set new lower lows, yet oscillators indicate latent strength. Conversely, bearish divergence happens when prices rise and mark higher highs, while oscillators show weakening momentum.
Recognizing and understanding divergence patterns helps traders better identify potential entry and exit points, set rational stop-loss levels, and anticipate near-term price action.
What Does a Divergence Pattern Indicate?
In technical analysis, divergence often serves as an early warning for impending positive or negative price movements. Experienced traders leverage divergence to anticipate bullish and bearish trends, or to pinpoint optimal entry and exit points within their strategies.
Investors typically overlay oscillators like the Relative Strength Index (RSI) onto price charts to forecast potential price swings. In a normal uptrend, rising prices and fresh highs are mirrored by the RSI’s ascent and higher highs. However, if price continues to set higher highs but the RSI forms lower highs, this signals weakening uptrend momentum and the potential for reversal.
This is a pivotal moment for traders to make strategic decisions. They may choose to exit positions and lock in profits before a reversal. If they anticipate price will continue moving opposite to oscillator signals for a short time, setting stop-loss orders at appropriate levels helps protect capital and mitigate risk.
What Types of Divergence Patterns Exist?
Technical analysis includes several key divergence patterns that traders need to master. The two primary types—regular divergence and hidden divergence—are differentiated by their structure. Each can be further classified according to whether the market trend is bullish or bearish.
Summing up, there are four basic divergence patterns:
- Regular Bullish Divergence
- Regular Bearish Divergence
- Hidden Bullish Divergence
- Hidden Bearish Divergence
In addition to these four primary types, there is a special pattern known as exhaustion divergence, which usually emerges at the end of a strong trend.
Regular Bullish Divergence
Regular bullish divergence—also called classic bullish divergence—occurs when an asset’s price declines and forms successive lower lows, while a technical indicator creates higher lows, signaling possible upside. This suggests that even as price drops, selling pressure is fading and bearish momentum is weakening.
Technical analysis theory holds that, in this scenario, price will eventually realign with technical indicators and begin to rise. This presents a favorable opportunity for traders to take long positions ahead of a rally. However, it’s best to confirm the signal with additional indicators to improve reliability.
Regular Bearish Divergence
Regular bearish divergence is structurally and functionally the opposite of regular bullish divergence. Here, asset prices trend upward and set successive higher highs, while oscillators form lower highs, indicating waning bullish momentum.
This pattern warns that, despite rising prices, the strength of the uptrend is evaporating. As a result, prices may lose momentum and could reverse downward soon. Traders often use this signal to consider taking profits or opening short positions.
Hidden Bullish Divergence
Hidden divergence is formed when price sets higher highs or higher lows, while technical indicators record lower highs or lower lows. Hidden bullish divergence often appears after a brief correction within a larger uptrend.
Specifically, with this pattern, the asset forms consecutive higher lows—indicating the uptrend remains intact—while oscillators record lower lows. This confirms the continuation of the uptrend after a correction, and traders use it to identify further buying opportunities during bullish phases.
Hidden Bearish Divergence
Hidden bearish divergence typically develops during temporary price recoveries (pullbacks) inside a major downtrend. It’s identified by periods when the asset forms consecutive lower highs—showing the downtrend still dominates—while technical indicators set higher highs.
Seasoned traders use this setup as a confirmation that the downtrend will persist after a short-lived rebound. It’s an opportunity to open or add to short positions in bearish strategies.
Exhaustion Divergence
Exhaustion divergence is the final type—and one of the most potent. This pattern appears when an asset’s price reaches extreme levels after a sustained upward or downward move. Here, trend momentum weakens significantly, indicating the current trend is running out of strength and is about to end.
This type is considered one of the most powerful and influential divergence signals in technical analysis, often heralding major trend reversals. Professional traders pay special attention to exhaustion divergence because it can signal very profitable opportunities when new trends emerge.
Advantages and Limitations of Divergence Patterns
Advantages
- Divergence patterns have a track record of being highly reliable and accurate technical indicators when used properly
- They offer valuable opportunities for short-term traders and day traders
- Divergence patterns can forecast bullish and bearish trends in advance, helping traders prepare effective strategies
- They can efficiently identify key support and resistance levels on charts
- Divergence can be applied on various timeframes, from short-term to long-term
Limitations
- Divergence can be difficult to identify and interpret correctly, even for experienced traders
- It’s not a sufficiently strong standalone indicator and is best combined with other technical tools for confirmation
- Divergence patterns require a certain level of technical knowledge and analytical skill, making them less suitable for beginners
- False divergence can occur, especially in highly volatile markets
- Accurately pinpointing when divergence ends and a new trend begins can be challenging
Should You Trust Divergence Patterns?
Based on the above analysis and discussion, divergence patterns are highly useful and valuable tools in cryptocurrency trading. They can help traders reliably spot the emergence of bullish and bearish trends, especially when used in conjunction with other analytical tools.
However, timely and accurate identification of divergence is challenging, even for seasoned traders. Sometimes, divergence signals are unclear or ambiguous, which may result in poor trading decisions if relying solely on one indicator.
The smarter approach is to use additional technical indicators alongside divergence to improve reliability in spotting trend reversals. When you suspect a reversal may be coming based on early signs, use divergence patterns as supporting confirmation. By combining multiple indicators and analytical tools, you’ll know precisely what to look for on the chart, and confirming your decisions becomes much easier and more accurate.
Additionally, traders should consistently practice identifying divergence patterns using historical data to sharpen their skills and boost their sensitivity to these signals in live trading.
FAQ
What Is a Divergence Model? What Are Its Basic Definition and Core Features?
The divergence model is a technical analysis tool that compares asset prices to momentum indicators such as RSI or MACD. If price sets a new high but the indicator lags, that’s negative divergence, signaling weakness. If the opposite occurs, it’s positive divergence and suggests a bullish reversal. It’s a key trend forecasting tool in cryptocurrency trading.
What Are Some Concrete Use Cases for Divergence Models in Practice?
Divergence models are applied in liquidity management, simultaneous transaction processing, network load balancing, and gas fee optimization. They enable parallel data stream processing, improve transaction efficiency, and reduce blockchain latency.
How Are Divergence Models Different from Other Statistical Models (such as Convergence Models)?
Divergence models focus on distributed, multidimensional scenarios, while convergence models aim for a single equilibrium. Divergence allows for multiple possible outcomes; convergence predicts variable integration.
What Are the Mathematical Principles and Calculation Methods of Divergence Models?
Divergence models use mathematical formulas based on standard deviation and moving averages. Calculations compare current price to Bollinger Bands to identify trading signals. If price breaks above the upper band, the model signals a sell; touching the lower band signals a buy.
How Can Divergence Models Be Applied Accurately in Machine Learning or Data Analysis?
Divergence models are implemented by analyzing parallel data scenarios and applying machine learning algorithms to forecast price trends. Data is divided into training, testing, and validation sets. Time-series models such as LSTM and GRU improve accuracy. Correct use of the model can result in price gains of 30–50%.
What Are the Limitations and Issues to Consider with Divergence Models?
Divergence models face challenges in long-term price prediction, and accuracy drops in highly volatile markets. Other concerns include data latency, impact from unexpected news, and computational limits when processing large transaction volumes.
* The information is not intended to be and does not constitute financial advice or any other recommendation of any sort offered or endorsed by Gate.