This comprehensive guide compares FET and XTZ, two distinct blockchain platforms with different technological focuses and investment characteristics. FET combines AI and machine learning through autonomous economic agents, while XTZ emphasizes self-amending protocol and institutional-grade smart contracts. The article examines historical price trends, tokenomics, institutional adoption, and technological ecosystems through 2031 forecasts. Investors can access real-time FET and XTZ prices on Gate exchange. The analysis provides tailored investment strategies for conservative and aggressive investors, evaluates macroeconomic and regulatory impacts, and addresses key risk factors including market volatility, technology development, and compliance considerations. Whether you're a new or experienced investor, this comparison equips you to make informed decisions about FET versus XTZ allocation within your portfolio.
Introduction: Investment Comparison Between FET and XTZ
In the cryptocurrency market, the comparison between FET vs XTZ remains a topic of ongoing discussion among investors. These two assets exhibit notable differences in market capitalization ranking, application scenarios, and price performance, representing distinct positions within the crypto asset landscape.
Artificial Superintelligence Alliance (FET): Launched in 2019, it has gained market recognition by combining machine learning, artificial intelligence, multi-agent systems, and decentralized ledger technology to build an economic internet where digital agents can efficiently execute tasks involving data, hardware, services, and infrastructure.
Tezos (XTZ): Since its launch in 2017, it has been recognized as a self-amending blockchain that simplifies formal verification through a decentralized governance model, mathematically ensuring transaction code accuracy and enhancing smart contract security.
This article will provide a comprehensive analysis of the investment value comparison between FET vs XTZ, examining historical price trends, supply mechanisms, institutional adoption, technological ecosystems, and future projections, while addressing investors' most pressing question:
"Which is the better buy right now?"
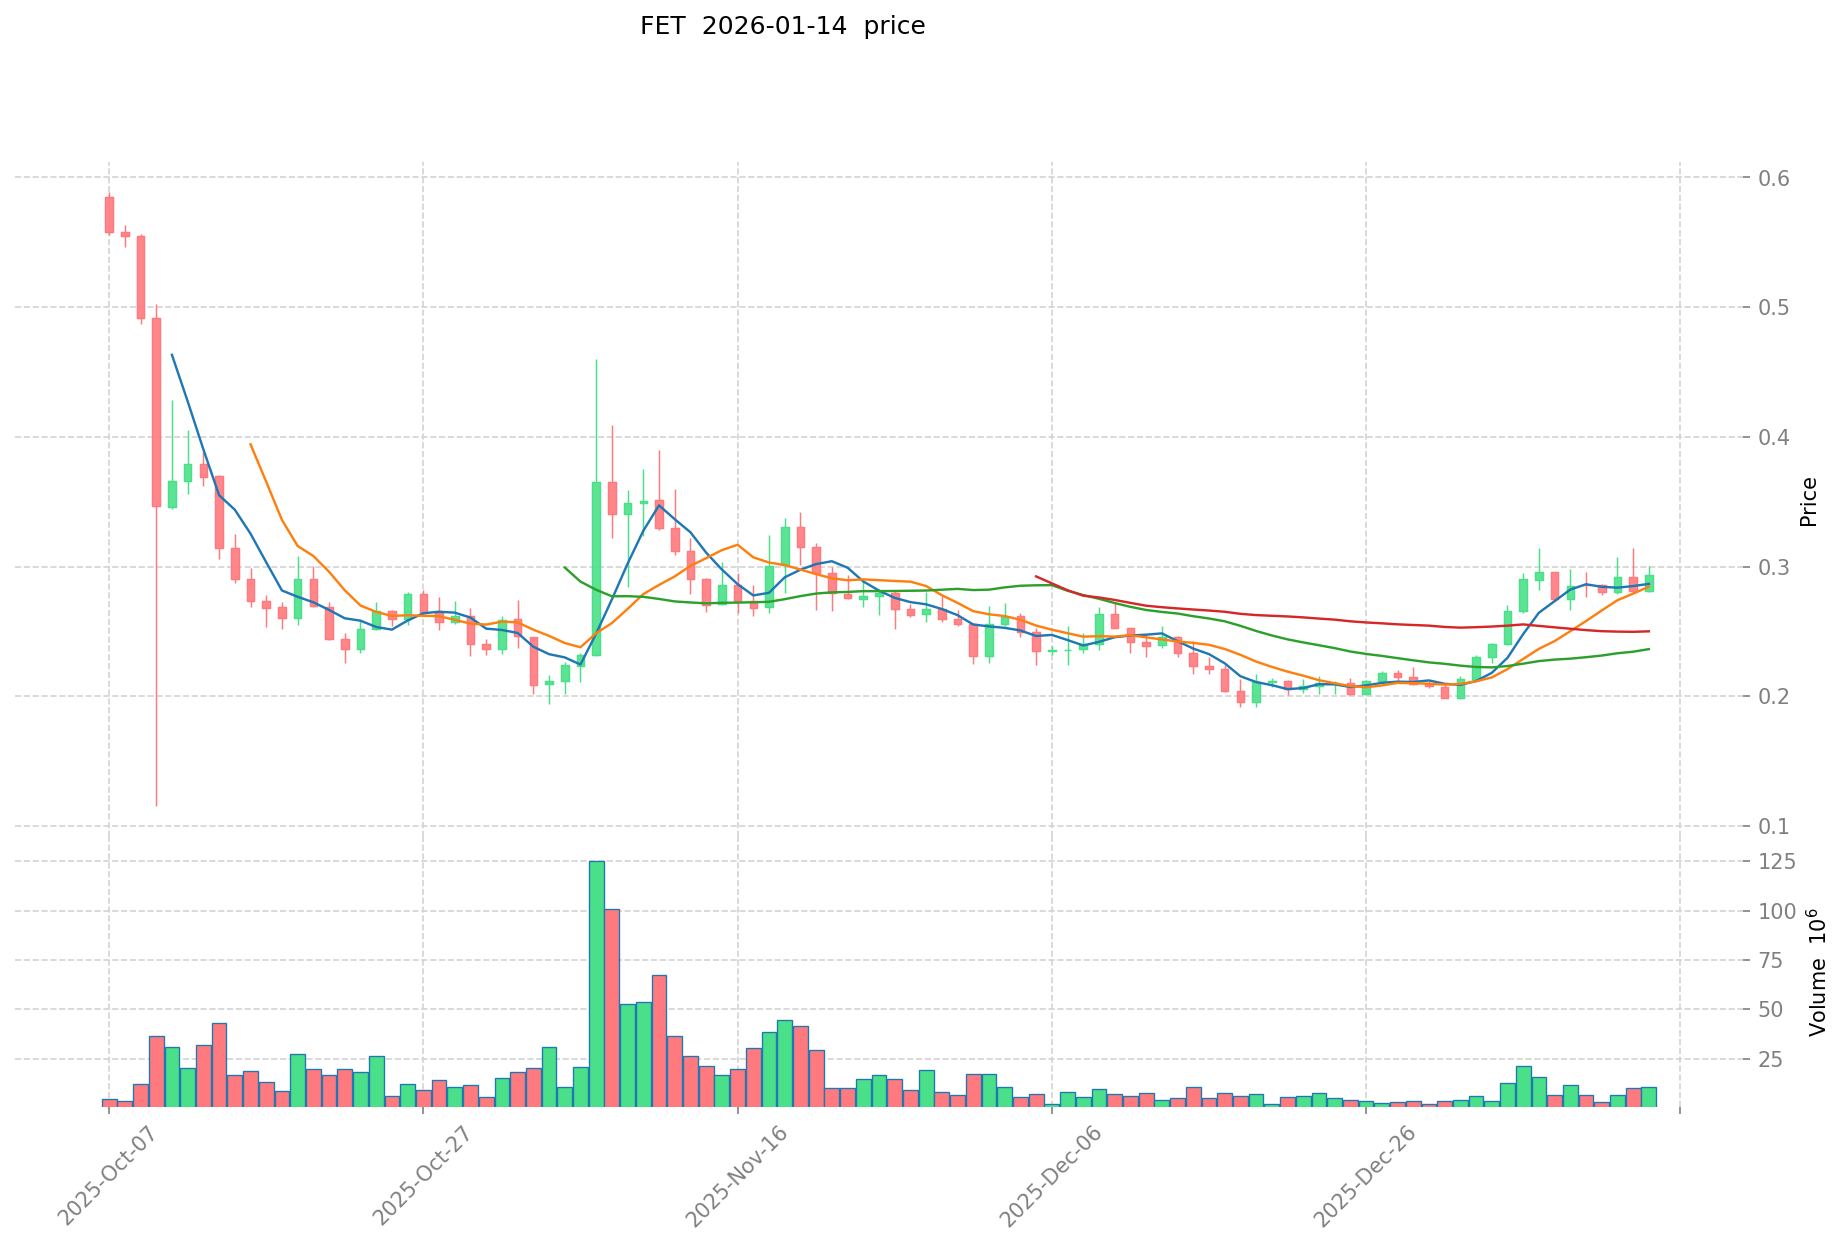
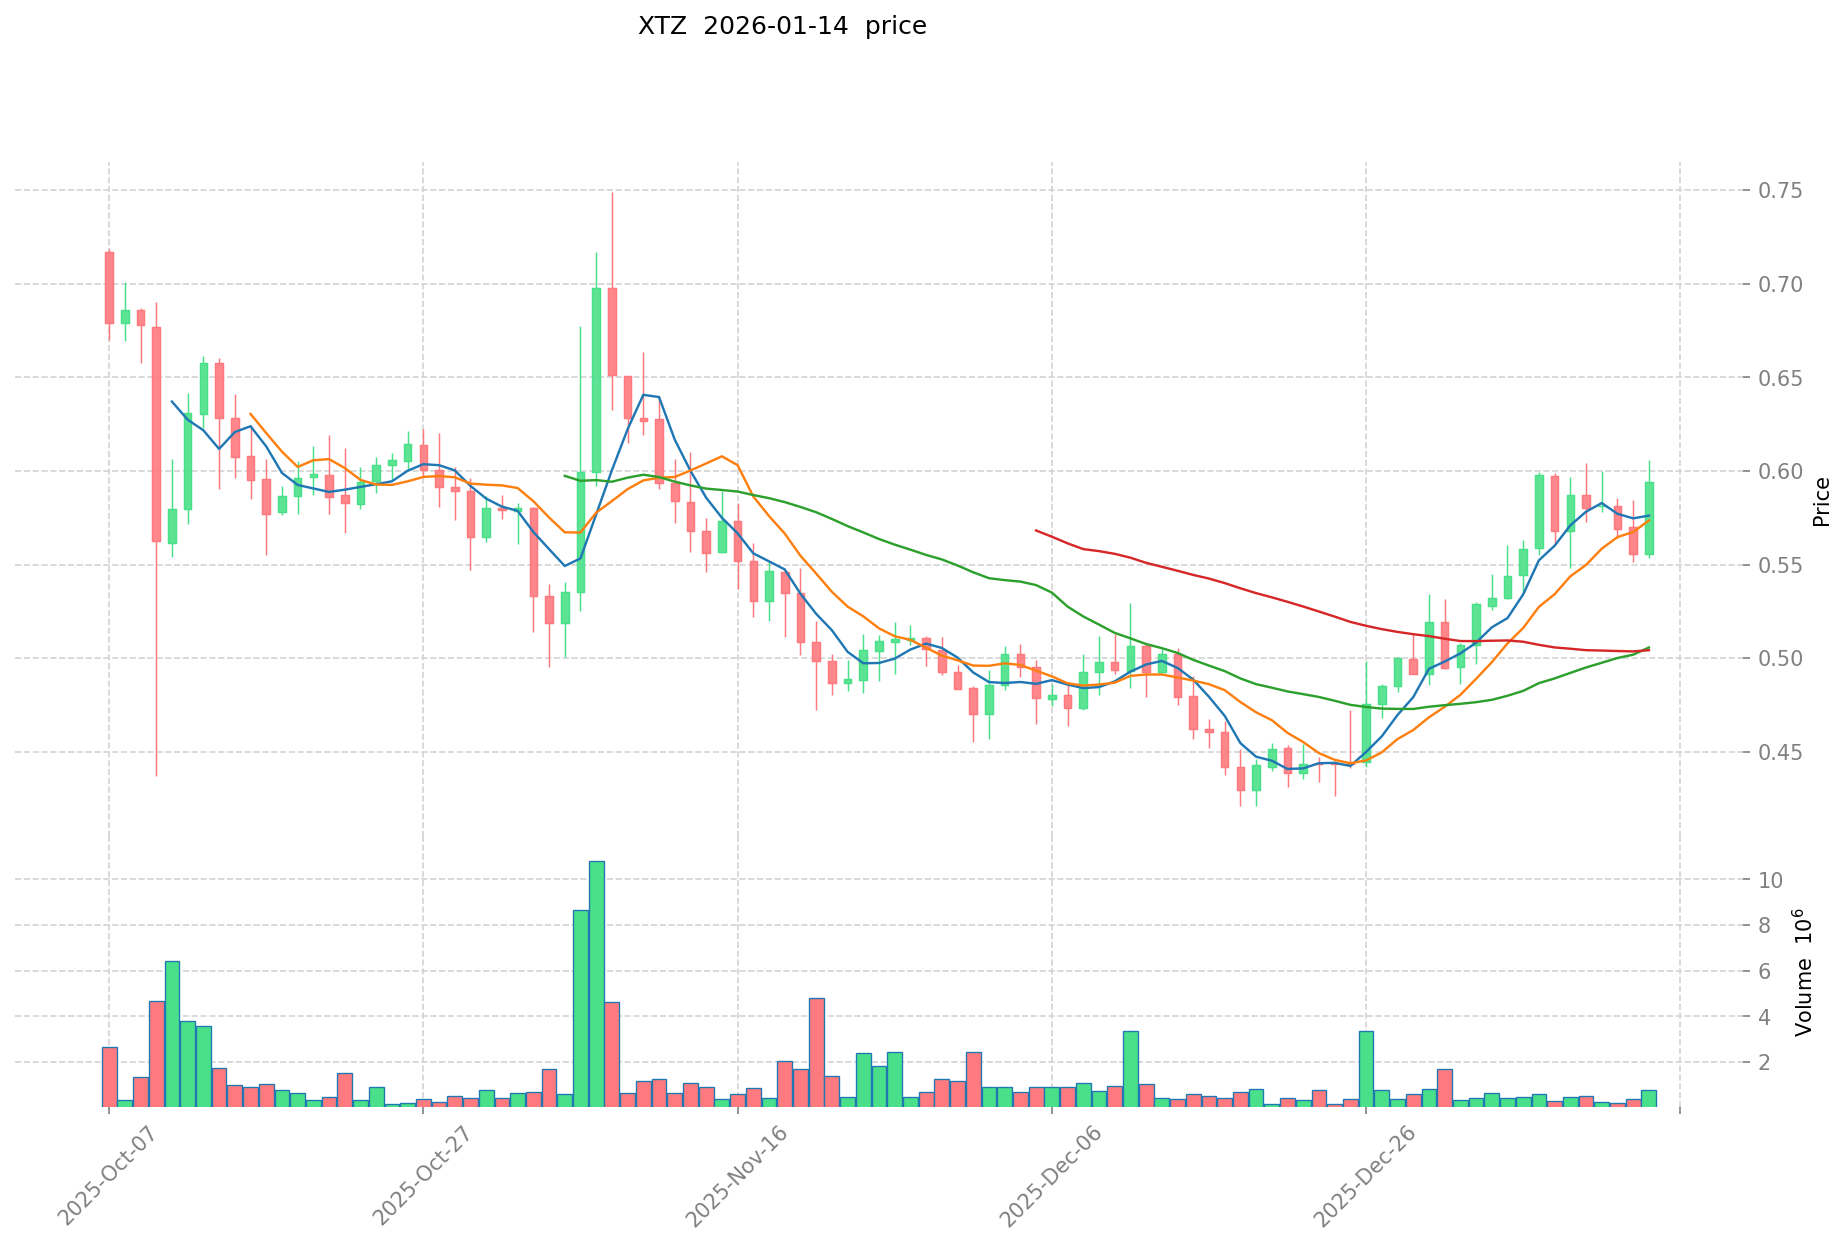
I. Historical Price Comparison and Current Market Status
Historical Price Trends of FET (Coin A) and XTZ (Coin B)
- 2024: FET reached an all-time high of $3.47 on March 29, 2024, driven by strong market momentum during that period.
- 2021: XTZ achieved its peak price of $9.12 on October 4, 2021, reflecting significant market interest at that time.
- Comparative Analysis: During the recent market cycle, FET has declined from its peak of $3.47 to the current level of $0.29, representing a substantial correction. Meanwhile, XTZ has also experienced a notable decline from its historical high of $9.12 to its current price of $0.58, demonstrating similar market pressure across both assets.
Current Market Situation (2026-01-14)
- FET Current Price: $0.2935
- XTZ Current Price: $0.5823
- 24-Hour Trading Volume: FET at $4.45 million vs XTZ at $490,533
- Market Sentiment Index (Fear & Greed Index): 48 (Neutral)
View real-time prices:
II. Core Factors Influencing FET vs XTZ Investment Value
Supply Mechanism Comparison (Tokenomics)
-
FET (Fetch.ai): The token supply mechanism is designed to support the AI and machine learning ecosystem development. The tokenomics structure aims to balance network growth with value preservation through controlled emission schedules.
-
XTZ (Tezos): Features a unique inflation model tied to its staking mechanism. Token holders who participate in baking (staking) receive rewards, creating a dynamic supply adjustment based on network participation rates.
-
📌 Historical Pattern: Supply mechanisms influence price cycles through their interaction with market demand. Tokens with clear emission schedules and deflationary pressures tend to experience different volatility patterns compared to those with flexible inflation models.
Institutional Adoption and Market Applications
-
Institutional Holdings: Both FET and XTZ have attracted institutional attention, though their appeal differs based on sector focus. FET draws interest from AI-focused investors, while XTZ attracts institutions seeking blockchain governance solutions.
-
Enterprise Adoption: FET finds applications in AI-driven automation and machine learning networks. XTZ sees adoption in institutional-grade smart contract platforms and formal verification use cases. Both tokens serve distinct enterprise needs within the blockchain ecosystem.
-
National Policies: Regulatory attitudes vary by jurisdiction. Different countries have adopted varying approaches to AI-blockchain integration tokens versus governance-focused platforms, influencing adoption patterns in their respective markets.
Technology Development and Ecosystem Building
-
FET Technology Upgrades: Development focuses on enhancing AI agent capabilities and improving network efficiency for autonomous economic agents. These upgrades aim to expand the platform's utility in decentralized AI applications.
-
XTZ Technology Development: The platform's self-amendment protocol allows for systematic upgrades without hard forks. This mechanism enables continuous evolution of the network's capabilities while maintaining stability.
-
Ecosystem Comparison: FET emphasizes AI and machine learning applications within its ecosystem. XTZ has built infrastructure supporting DeFi applications, NFT platforms, and institutional-grade smart contracts. Each ecosystem reflects its core technological focus and target user base.
Macroeconomic Factors and Market Cycles
-
Performance in Inflationary Environments: Digital assets respond differently to macroeconomic conditions based on their use cases and market positioning. FET's value proposition ties to AI technology adoption, while XTZ's relates to its governance mechanism and institutional applications.
-
Macroeconomic Monetary Policy: Interest rate changes and dollar index movements affect capital flows into crypto assets. These factors influence investment decisions across different token categories, including AI-focused and governance-oriented platforms.
-
Geopolitical Factors: Cross-border transaction demands and international developments impact adoption patterns. Both tokens serve different roles in the global digital economy, with FET focusing on AI applications and XTZ on governance and institutional solutions.
III. 2026-2031 Price Forecast: FET vs XTZ
Short-term Forecast (2026)
- FET: Conservative $0.27-$0.29 | Optimistic $0.35-$0.40
- XTZ: Conservative $0.56-$0.58 | Optimistic $0.66-$0.74
Mid-term Forecast (2028-2029)
- FET may enter a gradual appreciation phase, with estimated price range of $0.31-$0.57
- XTZ may enter a consolidation phase, with estimated price range of $0.49-$0.97
- Key drivers: institutional capital flows, ETF developments, ecosystem expansion
Long-term Forecast (2030-2031)
- FET: Baseline scenario $0.49-$0.61 | Optimistic scenario $0.55-$0.71
- XTZ: Baseline scenario $0.49-$0.92 | Optimistic scenario $0.84-$1.07
View detailed price predictions for FET and XTZ
Disclaimer
FET:
| Year |
Predicted High Price |
Predicted Average Price |
Predicted Low Price |
Price Change |
| 2026 |
0.397575 |
0.2945 |
0.26505 |
0 |
| 2027 |
0.49137325 |
0.3460375 |
0.266448875 |
17 |
| 2028 |
0.5443169875 |
0.418705375 |
0.31402903125 |
42 |
| 2029 |
0.5729983056875 |
0.48151118125 |
0.337057826875 |
64 |
| 2030 |
0.685431166509375 |
0.52725474346875 |
0.48507436399125 |
79 |
| 2031 |
0.709421257337203 |
0.606342954989062 |
0.545708659490156 |
106 |
XTZ:
| Year |
Predicted High Price |
Predicted Average Price |
Predicted Low Price |
Price Change |
| 2026 |
0.736974 |
0.5849 |
0.561504 |
0 |
| 2027 |
0.73364007 |
0.660937 |
0.64110889 |
13 |
| 2028 |
0.8228004713 |
0.697288535 |
0.4881019745 |
19 |
| 2029 |
0.972856964032 |
0.76004450315 |
0.6916404978665 |
30 |
| 2030 |
0.97042482162192 |
0.866450733591 |
0.48521241081096 |
48 |
| 2031 |
1.074572199799558 |
0.91843777760646 |
0.844962755397943 |
57 |
IV. Investment Strategy Comparison: FET vs XTZ
Long-term vs Short-term Investment Strategies
-
FET: Suitable for investors focused on AI technology adoption and decentralized machine learning applications. The token's value proposition centers on the growth potential of autonomous economic agents and AI-driven automation within blockchain ecosystems.
-
XTZ: Suitable for investors seeking blockchain governance solutions and institutional-grade smart contract platforms. The asset appeals to those interested in formal verification technology and self-amending protocol mechanisms.
Risk Management and Asset Allocation
- Conservative Investors: FET 30-40% vs XTZ 60-70%
- Aggressive Investors: FET 60-70% vs XTZ 30-40%
- Hedging Tools: Stablecoin allocation, options strategies, cross-asset portfolio diversification
V. Potential Risk Comparison
Market Risk
-
FET: Price volatility tied to AI technology adoption cycles and market sentiment toward machine learning applications. Trading volume patterns indicate varying liquidity conditions that may affect price stability during market stress periods.
-
XTZ: Market performance influenced by institutional adoption rates and competitive dynamics within the governance-focused blockchain segment. Price movements reflect broader market conditions and specific developments in the formal verification space.
Technology Risk
-
FET: Network scalability considerations and ongoing development requirements for AI agent infrastructure. System stability depends on continuous technological improvements and ecosystem expansion.
-
XTZ: Platform evolution through self-amendment protocol, with associated implementation considerations. Network participation rates and validator distribution patterns affect overall system resilience.
Regulatory Risk
- Global regulatory frameworks continue to evolve regarding AI-blockchain integration platforms and governance-oriented networks. Different jurisdictions maintain varying approaches to these technology categories, creating diverse compliance landscapes that may affect adoption patterns and market access for both assets.
VI. Conclusion: Which Is the Better Buy?
📌 Investment Value Summary:
-
FET Advantages: Positioned within the AI and machine learning technology sector, offering exposure to autonomous economic agent development. The ecosystem focuses on decentralized AI applications with potential growth tied to broader AI technology adoption.
-
XTZ Advantages: Features self-amending protocol mechanism enabling systematic upgrades. The platform supports institutional-grade applications with formal verification capabilities, attracting enterprise-focused use cases.
✅ Investment Recommendations:
-
New Investors: Consider starting with smaller position sizes while gaining familiarity with each asset's technology fundamentals and market dynamics. Diversification across both tokens may provide exposure to different blockchain application sectors.
-
Experienced Investors: Evaluate portfolio allocation based on sector preferences between AI-focused platforms and governance-oriented networks. Consider technical analysis alongside fundamental factors when timing entry points.
-
Institutional Investors: Assess alignment between each asset's use case and investment thesis. FET offers exposure to AI-blockchain integration, while XTZ provides access to formal verification and institutional smart contract infrastructure.
⚠️ Risk Warning: The cryptocurrency market exhibits high volatility. This analysis does not constitute investment advice.
VII. FAQ
Q1: What are the main differences between FET and XTZ in terms of use cases?
FET focuses on AI and machine learning applications through autonomous economic agents, while XTZ specializes in blockchain governance and formal verification for institutional-grade smart contracts. FET's ecosystem centers on decentralized AI-driven automation, enabling digital agents to execute tasks involving data and services. XTZ, on the other hand, emphasizes self-amending protocol capabilities that allow systematic upgrades without hard forks, making it attractive for enterprise applications requiring mathematical verification of transaction code accuracy.
Q2: Which token has better long-term growth potential according to 2026-2031 forecasts?
Based on the baseline scenario projections, XTZ shows slightly higher potential returns. By 2031, XTZ's predicted average price of $0.918 represents approximately 57% growth from current levels, compared to FET's predicted average of $0.606 representing 106% growth. However, FET demonstrates stronger relative growth potential from its lower current price base of $0.29. Investment choice should depend on sector preference: AI technology adoption (FET) versus institutional blockchain governance solutions (XTZ).
Q3: How do the supply mechanisms differ between FET and XTZ?
FET employs a controlled emission schedule designed to support AI ecosystem development while balancing network growth with value preservation. XTZ features a unique inflation model tied to its staking mechanism, where token holders participating in "baking" receive rewards, creating dynamic supply adjustments based on network participation rates. This fundamental difference means FET follows a more predictable emission pattern, while XTZ's supply responds to validator activity levels within the network.
Q4: What are the key risks investors should consider for each token?
For FET, primary risks include volatility tied to AI technology adoption cycles, network scalability considerations, and varying liquidity conditions that may affect price stability during market stress. For XTZ, main risks involve competitive dynamics within the governance-focused blockchain segment, implementation considerations related to protocol amendments, and dependency on institutional adoption rates. Both assets face regulatory uncertainty as global frameworks continue evolving regarding AI-blockchain integration and governance-oriented networks.
Q5: How should different investor types allocate between FET and XTZ?
Conservative investors seeking stability might consider a 30-40% FET and 60-70% XTZ allocation, as XTZ's institutional focus may provide more steady adoption patterns. Aggressive investors willing to accept higher volatility could pursue 60-70% FET and 30-40% XTZ, capitalizing on FET's exposure to rapidly evolving AI technology trends. New investors should start with smaller position sizes across both assets to gain sector exposure while managing risk through diversification.
Q6: Which token performs better in terms of current trading volume and liquidity?
As of January 14, 2026, FET demonstrates significantly higher trading volume at $4.45 million compared to XTZ's $490,533 in 24-hour volume. This substantial difference indicates FET currently maintains better liquidity conditions, potentially offering easier entry and exit points for traders. However, trading volume fluctuates based on market conditions and news events, so investors should monitor ongoing liquidity patterns when planning position sizing and execution strategies.
Q7: What role do institutional investors play in each token's ecosystem?
Institutional investors approach these tokens differently based on sector focus. FET attracts institutions interested in AI-driven automation and machine learning network applications, particularly those seeking exposure to autonomous economic agent development. XTZ appeals to institutions requiring formal verification capabilities and governance solutions for enterprise-grade smart contract platforms. These distinct institutional use cases create different adoption drivers and market dynamics for each asset.
Q8: How do macroeconomic factors affect FET versus XTZ differently?
FET's value proposition ties closely to AI technology adoption trends, making it more sensitive to tech sector sentiment and innovation cycles. XTZ's performance relates more directly to institutional blockchain adoption and governance mechanism development. During periods of monetary policy tightening, both may experience reduced capital inflows, but their sector-specific characteristics mean they respond differently to various economic conditions. Interest rate changes affecting tech valuations may impact FET more directly, while institutional budget allocations for blockchain infrastructure may influence XTZ adoption patterns.
* The information is not intended to be and does not constitute financial advice or any other recommendation of any sort offered or endorsed by Gate.