This comprehensive guide compares FORT and CHZ, two emerging blockchain projects with distinct use cases and market positions. FORT operates as a real-time detection network for blockchain security launched in 2022, while CHZ specializes in sports tokenization and fan engagement since 2019. The analysis examines historical price trajectories, current market status as of January 25, 2026, tokenomics, institutional adoption, and technological ecosystems. CHZ demonstrates superior liquidity with $783,134 daily volume versus FORT's $23,900, trading at $0.05197 compared to FORT's $0.02034. Long-term projections through 2031 suggest CHZ's range of $0.0428-$0.0882 offers more stable growth, while FORT projects $0.0165-$0.0400 with higher volatility. Investment recommendations vary by investor profile, with conservative allocations favoring CHZ's established market presence.
Introduction: Investment Comparison Between FORT and CHZ
In the cryptocurrency market, the comparison between FORT vs CHZ has consistently been a topic investors cannot overlook. Both exhibit notable differences in market capitalization ranking, application scenarios, and price performance, representing distinct positioning within the crypto asset landscape.
Forta (FORT): Since its launch in 2022, it has garnered market recognition for its positioning as a real-time detection network for blockchain security and operational monitoring.
Chiliz (CHZ): Since its inception in 2019, it has been recognized for its role in fan engagement and sports tokenization, establishing itself among the notable cryptocurrencies in the sports and esports sector.
This article will comprehensively analyze the investment value comparison of FORT vs CHZ around historical price trends, supply mechanisms, institutional adoption, technological ecosystems, and future projections, attempting to address investors' most pressing question:
"Which is the better buy right now?"
I. Historical Price Comparison and Current Market Status
Price Trajectory of FORT (Coin A) and CHZ (Coin B)
- 2022: FORT experienced significant price volatility, reaching its all-time high of $0.964645 on June 16, 2022, during a period of heightened market activity in the Web3 security sector.
- 2021: CHZ achieved its historical peak of $0.878633 on March 13, 2021, driven by increased adoption of fan engagement platforms in the sports industry.
- Comparative Analysis: During the market cycle from 2021 to 2025, FORT declined from its peak of $0.964645 to a low of $0.01832485 (recorded on December 19, 2025), representing a substantial correction. Meanwhile, CHZ has shown relative resilience, maintaining a current price level above its historical low of $0.00410887 (recorded on September 28, 2019).
Current Market Landscape (January 25, 2026)
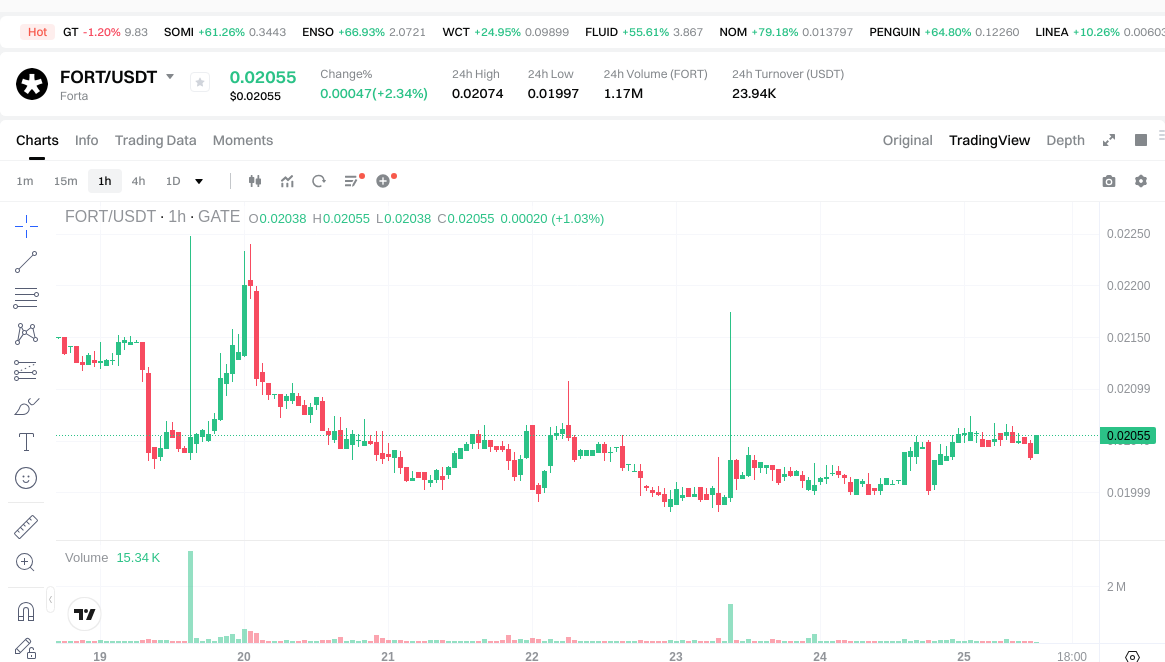
- FORT Current Price: $0.02034
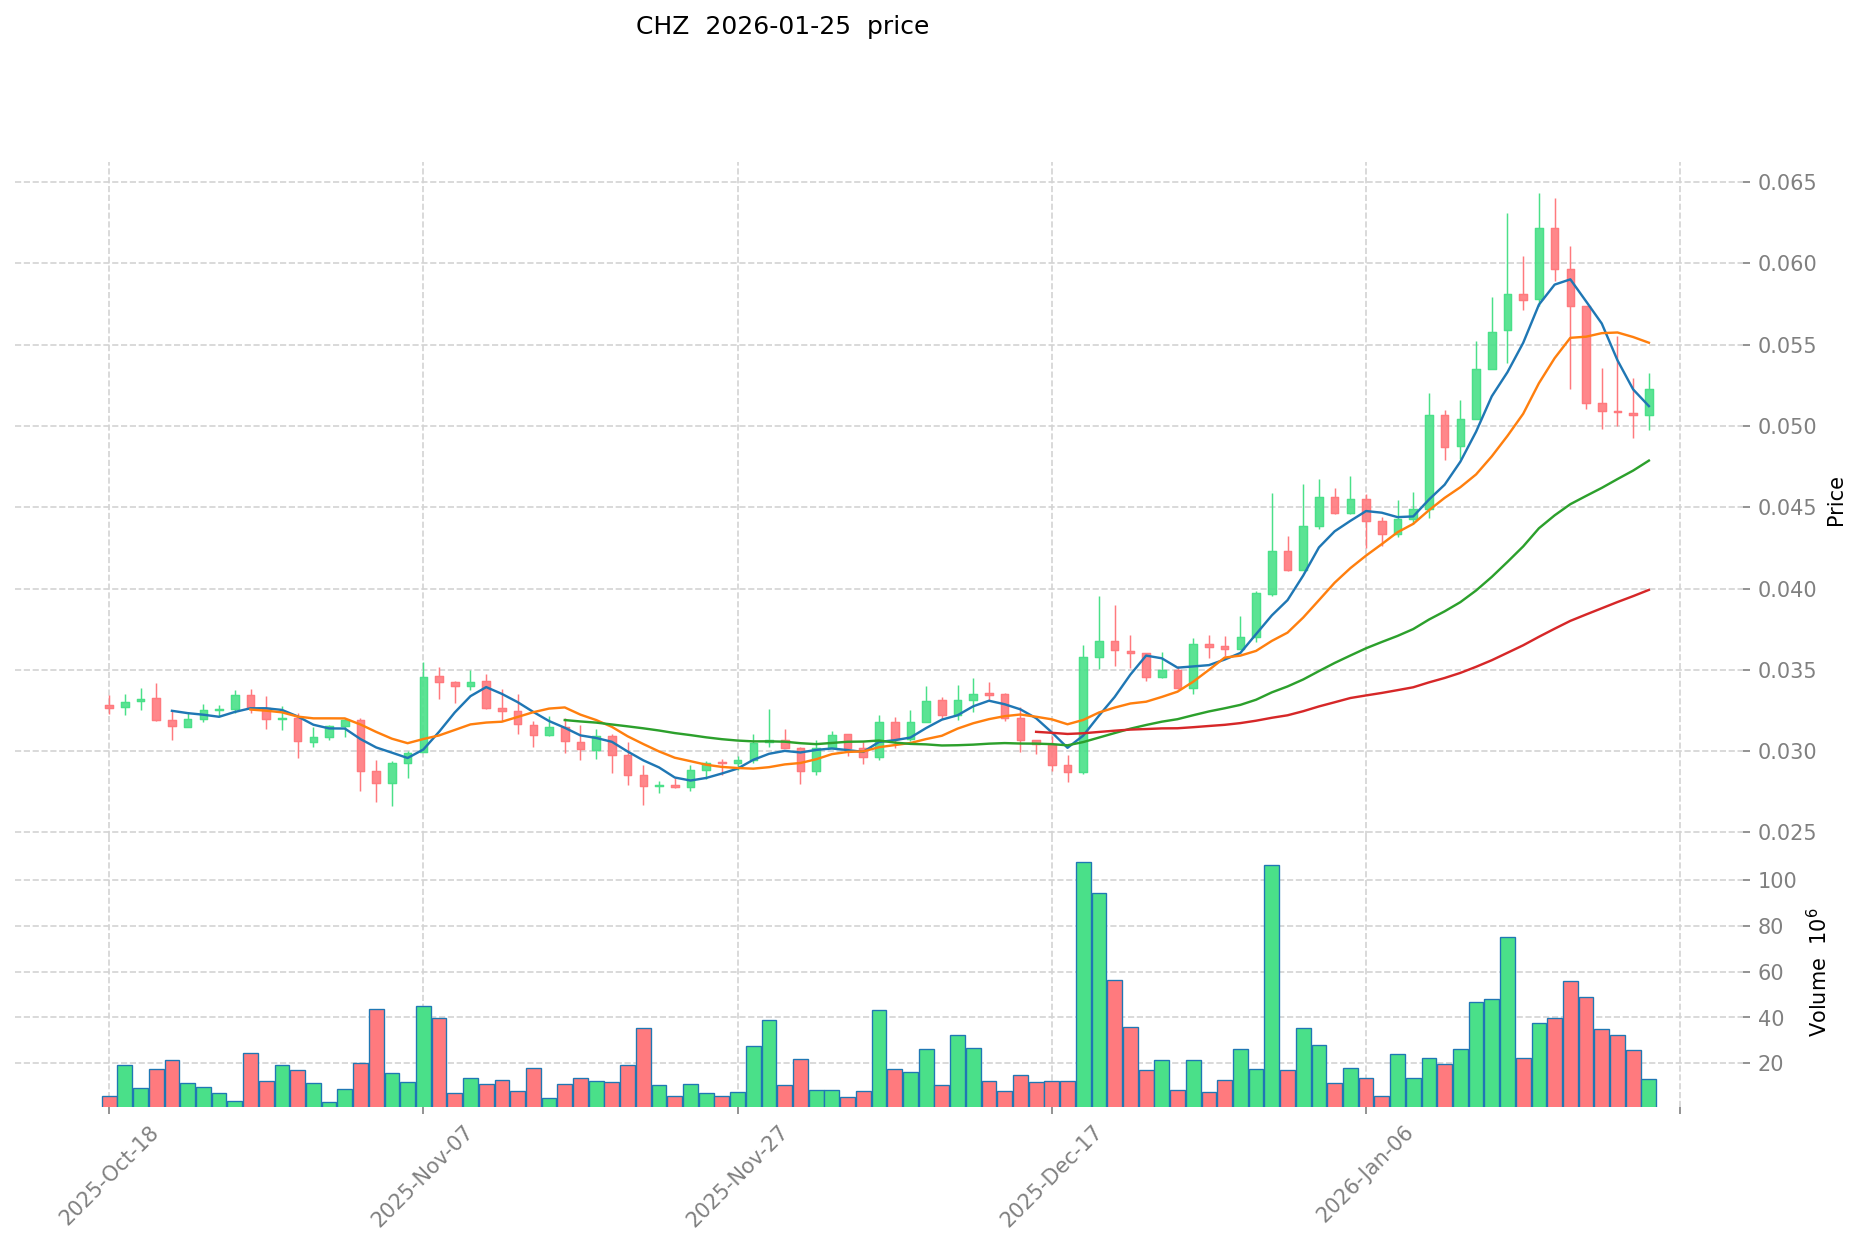
- CHZ Current Price: $0.05197
- 24-Hour Trading Volume: FORT at $23,899.70 compared to CHZ at $783,134.42
- Market Sentiment Index (Fear & Greed Index): 25 (Extreme Fear)
Access Real-Time Prices:
II. Core Factors Influencing FORT vs CHZ Investment Value
Supply Mechanism Comparison (Tokenomics)
Due to limited available data on the specific supply mechanisms of FORT and CHZ, a detailed comparison cannot be provided at this time. Generally, supply mechanisms such as fixed supply models, deflationary mechanisms, or halving events can influence price cycles by affecting token scarcity and market dynamics.
Institutional Adoption and Market Applications
Institutional Holdings: Specific data regarding institutional preference between FORT and CHZ is not currently available.
Enterprise Adoption: Information on the adoption of FORT and CHZ in cross-border payments, settlements, or investment portfolios is insufficient for comparison.
Regulatory Environment: Different jurisdictions maintain varying regulatory stances toward digital assets. However, specific regulatory positions regarding FORT and CHZ across different countries are not detailed in available materials.
Technology Development and Ecosystem Building
FORT Technical Updates: Specific information on recent technical upgrades or developments for FORT is not available in the provided materials.
CHZ Technical Development: Detailed information on CHZ's technical roadmap and recent developments is not available in the provided materials.
Ecosystem Comparison: A comprehensive comparison of DeFi integration, NFT applications, payment solutions, and smart contract implementations for both tokens cannot be conducted due to insufficient data.
Macroeconomic Factors and Market Cycles
Performance in Inflationary Environments: Without historical performance data, it is difficult to assess which asset may exhibit stronger inflation-resistant characteristics.
Macroeconomic Monetary Policy: Interest rates and the U.S. Dollar Index can influence digital asset valuations. However, specific correlations or impacts on FORT and CHZ are not documented in available materials.
Geopolitical Factors: Cross-border transaction demand and international developments can affect digital asset markets, though specific implications for FORT and CHZ are not detailed in the provided resources.
III. 2026-2031 Price Prediction: FORT vs CHZ
Short-term Prediction (2026)
- FORT: Conservative $0.0171-$0.0206 | Optimistic $0.0206-$0.0294
- CHZ: Conservative $0.0342-$0.0518 | Optimistic $0.0518-$0.0581
Medium-term Prediction (2028-2029)
- FORT may enter a consolidation phase with anticipated price range of $0.0166-$0.0307
- CHZ may enter an expansion phase with anticipated price range of $0.0376-$0.0907
- Key drivers: institutional capital inflows, ETF developments, ecosystem growth
Long-term Prediction (2030-2031)
- FORT: Base scenario $0.0165-$0.0294 | Optimistic scenario $0.0271-$0.0400
- CHZ: Base scenario $0.0428-$0.0808 | Optimistic scenario $0.0627-$0.0882
View detailed price predictions for FORT and CHZ
Disclaimer
FORT:
| Year |
Predicted High Price |
Predicted Average Price |
Predicted Low Price |
Price Change |
| 2026 |
0.0293865 |
0.02055 |
0.0170565 |
1 |
| 2027 |
0.0297122175 |
0.02496825 |
0.0182268225 |
22 |
| 2028 |
0.028980647775 |
0.02734023375 |
0.0232391986875 |
34 |
| 2029 |
0.030694880431125 |
0.0281604407625 |
0.016614660049875 |
38 |
| 2030 |
0.040021618411665 |
0.029427660596812 |
0.016479489934215 |
44 |
| 2031 |
0.039238842639789 |
0.034724639504238 |
0.027085218813306 |
70 |
CHZ:
| Year |
Predicted High Price |
Predicted Average Price |
Predicted Low Price |
Price Change |
| 2026 |
0.0580608 |
0.05184 |
0.0342144 |
0 |
| 2027 |
0.081326592 |
0.0549504 |
0.03022272 |
5 |
| 2028 |
0.07358957568 |
0.068138496 |
0.0442900224 |
31 |
| 2029 |
0.0907059658752 |
0.07086403584 |
0.0375579389952 |
36 |
| 2030 |
0.084016400891904 |
0.0807850008576 |
0.042816050454528 |
55 |
| 2031 |
0.088168749935984 |
0.082400700874752 |
0.062624532664811 |
58 |
IV. Investment Strategy Comparison: FORT vs CHZ
Long-term vs Short-term Investment Strategies
- FORT: May appeal to investors focused on blockchain security infrastructure and Web3 monitoring solutions, with a focus on technological development in the security sector
- CHZ: May appeal to investors interested in sports industry digitization and fan engagement platforms, with exposure to the growing sports tokenization market
Risk Management and Asset Allocation
- Conservative Investors: FORT: 30% vs CHZ: 70%
- Aggressive Investors: FORT: 45% vs CHZ: 55%
- Hedging Tools: stablecoin allocation, options strategies, cross-asset portfolio diversification
V. Potential Risk Comparison
Market Risk
- FORT: Faces volatility related to market sentiment in the blockchain security sector, with trading volume of $23,899.70 indicating relatively limited liquidity
- CHZ: Subject to fluctuations influenced by sports industry adoption trends and fan engagement platform performance, with trading volume of $783,134.42 showing relatively higher market activity
Technical Risk
- FORT: Considerations include network scalability and operational stability of security monitoring infrastructure
- CHZ: Considerations include platform expansion capacity and potential technical vulnerabilities in fan engagement systems
Regulatory Risk
- Global regulatory frameworks for digital assets continue to evolve, with varying approaches across jurisdictions potentially affecting both tokens differently based on their respective use cases and operational models
VI. Conclusion: Which Is the Better Buy?
📌 Investment Value Summary:
- FORT Advantages: Positioned in the blockchain security and monitoring sector, with potential growth tied to increasing demand for Web3 infrastructure security solutions
- CHZ Advantages: Established presence in sports tokenization and fan engagement, with exposure to the ongoing digitization of the sports industry
✅ Investment Recommendations:
- Beginner Investors: Consider starting with CHZ due to its relatively higher trading volume and established market presence, while maintaining diversification principles
- Experienced Investors: May explore allocation strategies based on sector preferences, with FORT offering exposure to security infrastructure and CHZ providing access to sports digitization trends
- Institutional Investors: Conduct comprehensive due diligence on both assets, evaluating factors including liquidity profiles, ecosystem development trajectories, and alignment with portfolio objectives
⚠️ Risk Disclaimer: The cryptocurrency market exhibits significant volatility. This content does not constitute investment advice.
VII. FAQ
Q1: What are the main differences between FORT and CHZ in terms of their use cases?
FORT focuses on blockchain security and operational monitoring as a real-time detection network launched in 2022, while CHZ specializes in fan engagement and sports tokenization since 2019. FORT serves the Web3 security infrastructure sector, providing monitoring solutions for blockchain networks, whereas CHZ operates in the sports industry digitization space, enabling fan engagement platforms and sports-related token economies. These distinct positioning strategies mean FORT appeals to investors interested in cybersecurity infrastructure, while CHZ attracts those seeking exposure to the growing sports digitization market.
Q2: Which token shows better liquidity based on current market data?
CHZ demonstrates significantly better liquidity with a 24-hour trading volume of $783,134.42 compared to FORT's $23,899.70 as of January 25, 2026. This approximately 33-fold difference in trading volume indicates that CHZ offers substantially easier entry and exit opportunities for investors, with lower slippage risk and more efficient price discovery. The higher liquidity of CHZ also suggests broader market participation and greater investor confidence, which can be particularly important for investors requiring flexible position management.
Q3: How do the historical price performances of FORT and CHZ compare?
FORT reached its all-time high of $0.964645 on June 16, 2022, but experienced a substantial correction to a low of $0.01832485 by December 19, 2025. CHZ achieved its historical peak of $0.878633 on March 13, 2021, and has maintained relatively better price stability above its historical low of $0.00410887 from September 28, 2019. Currently, CHZ trades at $0.05197 compared to FORT's $0.02034, with CHZ showing more resilient price action during the 2021-2025 market cycle. This suggests CHZ has demonstrated better price preservation characteristics during market downturns.
Q4: What are the price predictions for FORT and CHZ through 2031?
For 2026, FORT is projected to range from $0.0171-$0.0294 (conservative to optimistic scenarios), while CHZ is expected to trade between $0.0342-$0.0581. By 2031, FORT's long-term predictions suggest a range of $0.0165-$0.0400, while CHZ is projected to reach $0.0428-$0.0882. CHZ consistently shows higher predicted price levels across all timeframes, with a predicted price change of 58% by 2031 compared to FORT's 70%. These projections indicate that CHZ may offer more stable growth potential, while FORT presents higher volatility with potentially greater percentage gains.
Q5: What portfolio allocation strategy should different investor types consider for FORT vs CHZ?
Conservative investors are recommended to allocate 30% to FORT and 70% to CHZ, prioritizing the more established and liquid CHZ while maintaining limited exposure to FORT's higher-risk security sector potential. Aggressive investors may consider a more balanced 45% FORT and 55% CHZ allocation to capture potential upside from both blockchain security infrastructure growth and sports digitization trends. Beginner investors should consider starting with CHZ due to its higher trading volume and established market presence, while experienced investors can explore sector-specific allocations based on their conviction in Web3 security versus sports tokenization. All strategies should incorporate risk management tools including stablecoin reserves and portfolio diversification.
Q6: What are the primary risks investors should consider when choosing between FORT and CHZ?
Both tokens face distinct risk profiles requiring careful evaluation. FORT carries market risk related to blockchain security sector volatility with limited liquidity evidenced by its $23,899.70 daily volume, plus technical risks around network scalability and monitoring infrastructure stability. CHZ faces market risk tied to sports industry adoption rates and fan platform performance, though its $783,134.42 trading volume provides better liquidity cushioning. Both assets are subject to evolving global regulatory frameworks that may affect their respective use cases differently. Additionally, the current market sentiment index of 25 (Extreme Fear) indicates heightened overall market risk that affects both tokens.
* The information is not intended to be and does not constitute financial advice or any other recommendation of any sort offered or endorsed by Gate.