This comprehensive comparison analyzes FTRB (Faith Tribe) and MANA (Decentraland) as two distinct metaverse platform investments. FTRB, launched in 2022, operates as a Web3 fashion design collaboration platform, while MANA, established in 2017, powers a decentralized virtual world ecosystem. The analysis examines historical price trajectories—FTRB declining from $0.07116 to $0.007963, and MANA from $5.85 to $0.1612—alongside current market metrics showing MANA's significantly higher trading volume of $986,092.54 versus FTRB's $47,321.60. The article evaluates investment value through tokenomics, institutional adoption, technology ecosystems, and macroeconomic factors, providing price projections through 2031 and customized investment strategies for conservative and aggressive investors. Risk assessments cover market volatility, technical infrastructure, and regulatory considerations. Conservative investors typically favor 70-80% MANA allocation, while experienced traders may diversify across both assets. Trac
Introduction: Investment Comparison Between FTRB and MANA
In the cryptocurrency market, the comparison between Faith Tribe (FTRB) and Decentraland (MANA) has become a topic of interest for investors. Both assets demonstrate distinct differences in market capitalization ranking, application scenarios, and price performance, representing different positioning within the crypto asset landscape.
Faith Tribe (FTRB): Launched in 2022, this project positions itself as an open-source collaborative fashion design platform in the Web3 economy, empowering independent designers through reward mechanisms.
Decentraland (MANA): Since its inception in 2017, MANA has established itself as a blockchain-based virtual world platform, eliminating intermediary fees between content creators and users, becoming one of the notable projects in the metaverse sector.
This article will comprehensively analyze the investment value comparison between FTRB and MANA, focusing on historical price trends, supply mechanisms, technical ecosystems, and future outlooks, attempting to address the question most concerning to investors:
"Which asset presents different characteristics for consideration in current market conditions?"
I. Historical Price Comparison and Current Market Status
FTRB (Faith Tribe) and MANA (Decentraland) Historical Price Trends
- 2022: FTRB reached a peak price of $0.07116 on March 1, 2022, during the early stages of the project's market debut.
- 2024: FTRB experienced significant downward pressure, dropping to its historical low of $0.00173617 on June 23, 2024.
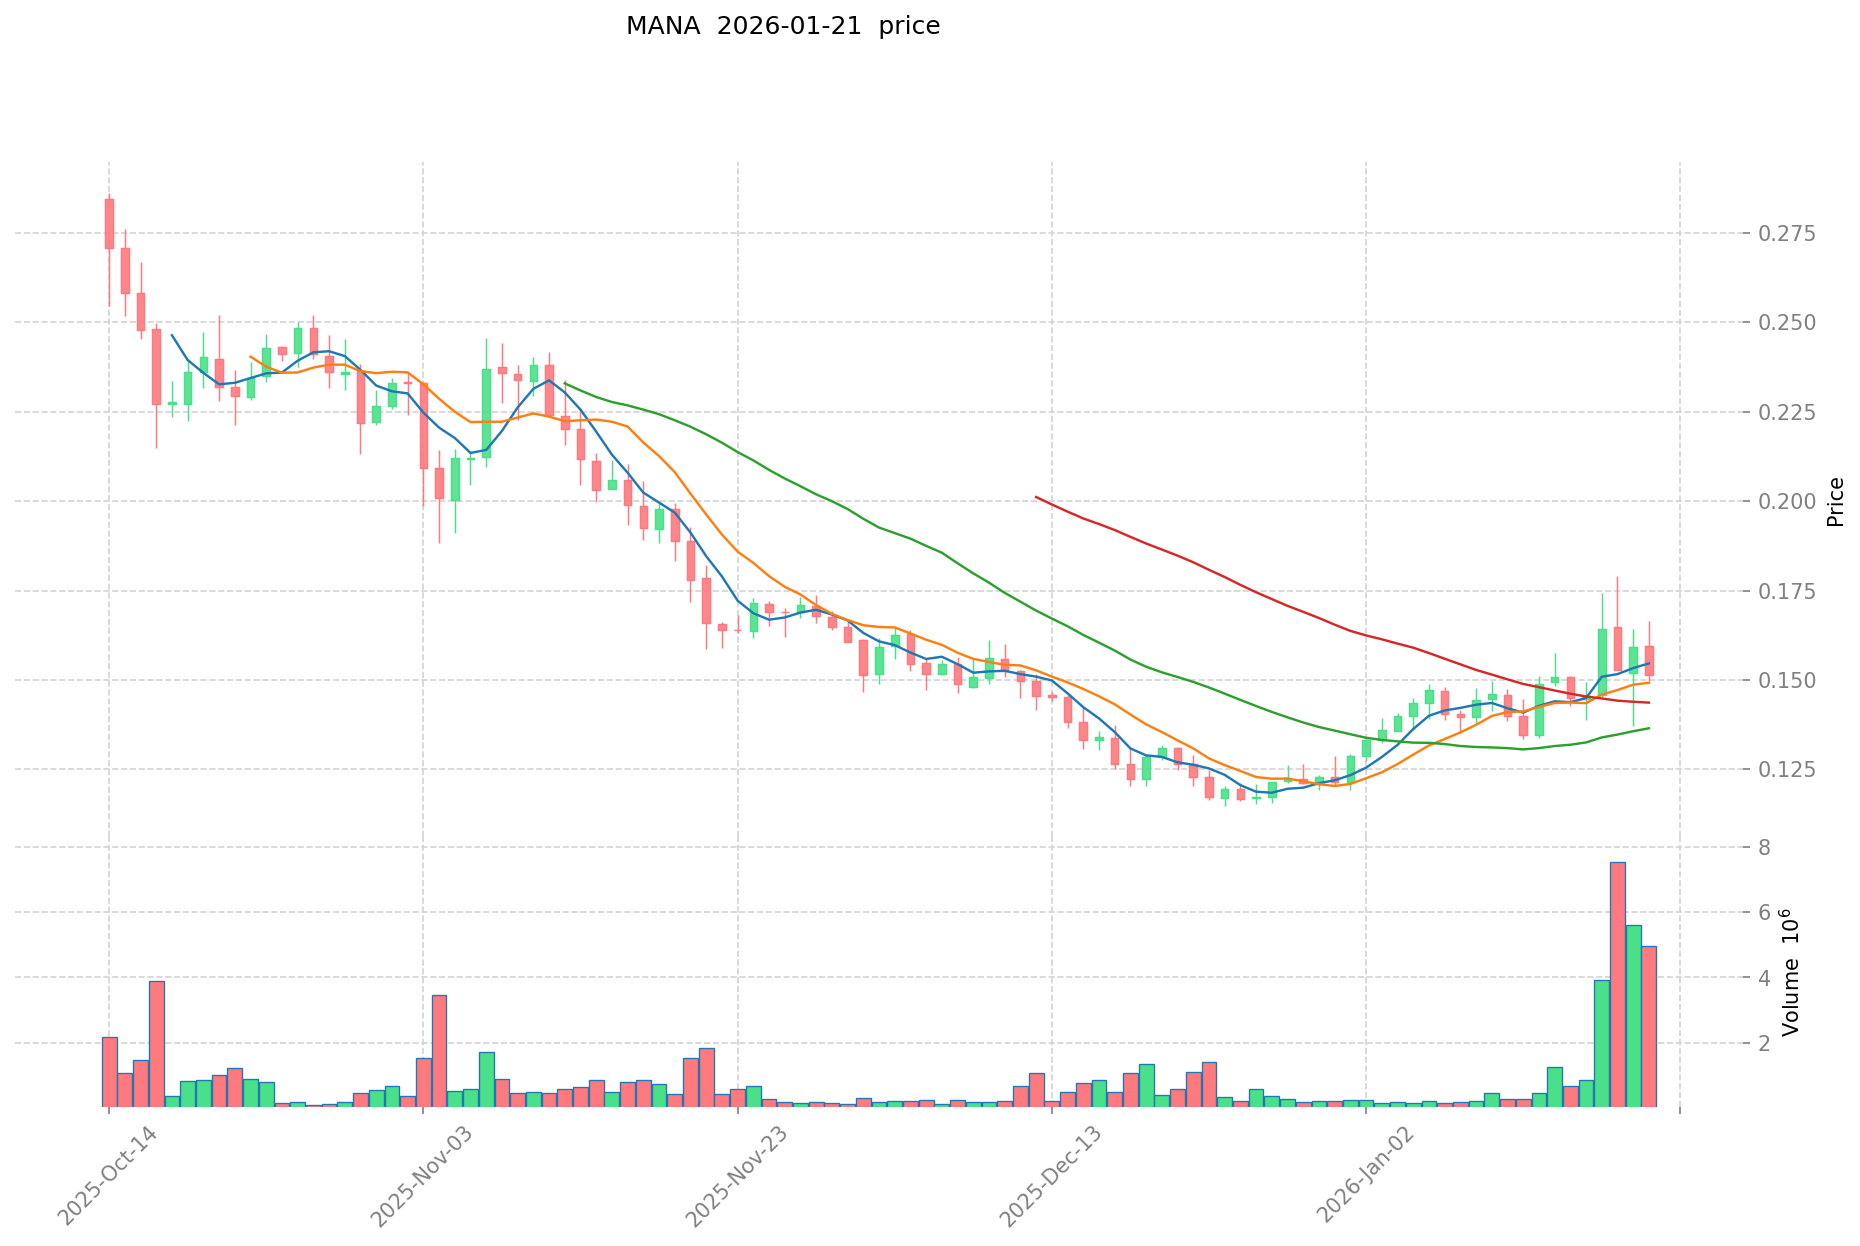
- 2021: MANA benefited from increased interest in metaverse projects, reaching an all-time high of $5.85 on November 25, 2021.
- 2017: MANA recorded its historical low of $0.00923681 on October 31, 2017, shortly after its initial launch.
- Comparative Analysis: During the market cycle from 2022 to 2024, FTRB declined from $0.07116 to $0.00173617, representing a substantial correction, while MANA experienced a decline from its 2021 peak of $5.85 to current levels, reflecting broader market trends affecting metaverse-related assets.
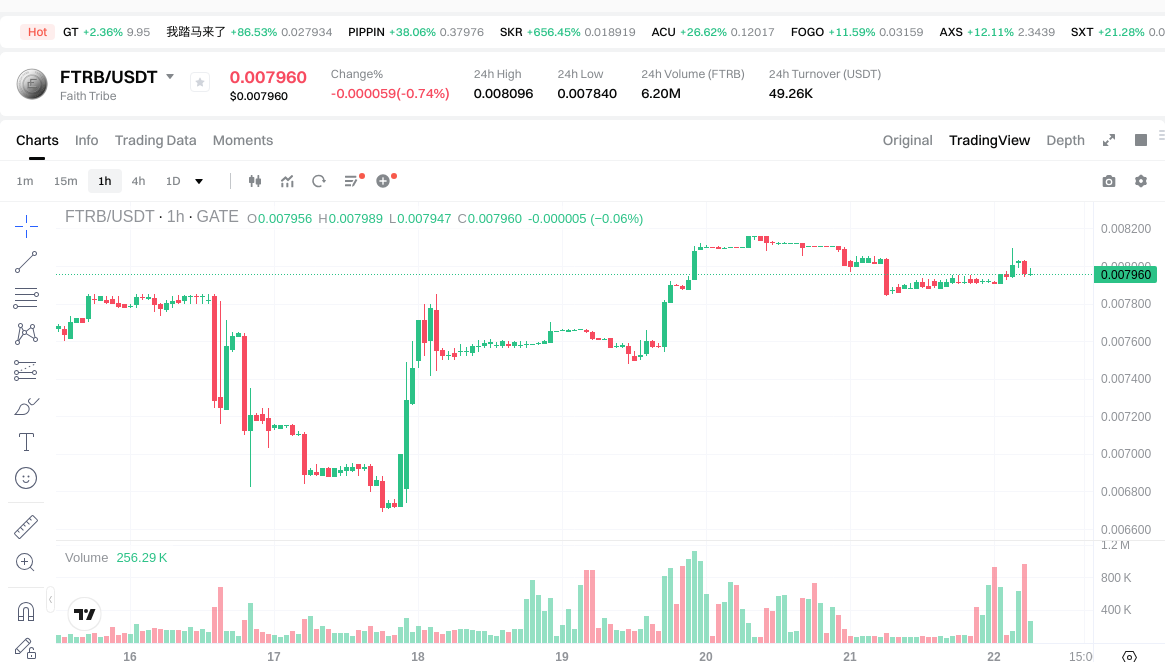
Current Market Status (January 22, 2026)
- FTRB Current Price: $0.007963
- MANA Current Price: $0.1612
- 24-Hour Trading Volume: FTRB at $47,321.60 vs MANA at $986,092.54
- Market Sentiment Index (Fear & Greed Index): 24 (Extreme Fear)
View real-time prices:
- Check current FTRB price Market Price
- Check current MANA price Market Price
II. Core Factors Affecting FTRB vs MANA Investment Value
Supply Mechanism Comparison (Tokenomics)
Due to insufficient reference materials regarding the specific supply mechanisms of FTRB and MANA, this section cannot provide detailed tokenomics analysis at this time.
Institutional Adoption and Market Application
Based on available information, neither institutional holdings data nor enterprise adoption patterns for FTRB and MANA in cross-border payments, settlements, or investment portfolios can be adequately assessed. Regulatory attitudes toward these assets across different jurisdictions remain unclear from current materials.
Technology Development and Ecosystem Building
Without concrete information on recent technology upgrades for FTRB and MANA, as well as their respective developments in DeFi, NFT, payment systems, and smart contract implementations, a comparative analysis of their ecosystem construction cannot be performed reliably.
Macroeconomic Factors and Market Cycles
The performance characteristics of FTRB and MANA under inflationary environments, their sensitivity to macroeconomic monetary policies including interest rates and dollar index movements, and their correlation with geopolitical factors affecting cross-border transaction demands require additional data for meaningful analysis.
III. 2026-2031 Price Prediction: FTRB vs MANA
Short-term Forecast (2026)
- FTRB: Conservative $0.0076 - $0.0080 | Optimistic $0.0080 - $0.0089
- MANA: Conservative $0.095 - $0.16 | Optimistic $0.16 - $0.21
Mid-term Forecast (2028-2029)
- FTRB may enter a gradual growth phase, with projected prices ranging from $0.0077 to $0.0138 in 2028, potentially extending to $0.011 - $0.015 by 2029
- MANA may enter a volatile expansion phase, with projected prices ranging from $0.18 to $0.27 in 2028, potentially reaching $0.14 - $0.25 by 2029
- Key drivers: institutional capital inflows, ETF developments, ecosystem expansion
Long-term Forecast (2030-2031)
- FTRB: Baseline scenario $0.0083 - $0.014 (2030), $0.011 - $0.018 (2031) | Optimistic scenario potentially reaching upper bands with sustained momentum
- MANA: Baseline scenario $0.20 - $0.36 (2030), $0.25 - $0.40 (2031) | Optimistic scenario may approach higher valuation ranges contingent on broader adoption
View detailed price predictions for FTRB and MANA
Disclaimer: Price predictions are speculative estimates based on historical data patterns and market analysis models. Actual market performance may differ significantly due to numerous unpredictable factors including regulatory changes, technological developments, macroeconomic conditions, and market sentiment shifts. These projections should not be construed as financial advice or investment recommendations.
FTRB:
| Year |
Predicted High Price |
Predicted Average Price |
Predicted Low Price |
Price Change |
| 2026 |
0.00892192 |
0.007966 |
0.0075677 |
0 |
| 2027 |
0.0104705104 |
0.00844396 |
0.007599564 |
6 |
| 2028 |
0.013807563392 |
0.0094572352 |
0.007660360512 |
18 |
| 2029 |
0.01547109106368 |
0.011632399296 |
0.01081813134528 |
46 |
| 2030 |
0.014906919697824 |
0.01355174517984 |
0.008266564559702 |
70 |
| 2031 |
0.018071252197316 |
0.014229332438832 |
0.011241172626677 |
78 |
MANA:
| Year |
Predicted High Price |
Predicted Average Price |
Predicted Low Price |
Price Change |
| 2026 |
0.207045 |
0.1605 |
0.094695 |
0 |
| 2027 |
0.20950065 |
0.1837725 |
0.148855725 |
14 |
| 2028 |
0.26939210775 |
0.196636575 |
0.18287201475 |
21 |
| 2029 |
0.251655488685 |
0.233014341375 |
0.1444688916525 |
44 |
| 2030 |
0.3562323250941 |
0.24233491503 |
0.2035613286252 |
50 |
| 2031 |
0.395054378481906 |
0.29928362006205 |
0.248405404651501 |
85 |
IV. Investment Strategy Comparison: FTRB vs MANA
Long-term vs Short-term Investment Strategies
- FTRB: May align with investors interested in emerging Web3 fashion design platforms and early-stage project opportunities, characterized by higher volatility patterns
- MANA: May align with investors focused on established metaverse infrastructure projects with demonstrated market presence since 2017
Risk Management and Asset Allocation
- Conservative Investors: FTRB 20-30% vs MANA 70-80%
- Aggressive Investors: FTRB 40-50% vs MANA 50-60%
- Hedging Tools: Stablecoin allocation, options strategies, cross-asset portfolio diversification
V. Potential Risk Comparison
Market Risk
- FTRB: Price volatility has been notable, with historical price ranging from $0.07116 (March 2022) to $0.00173617 (June 2024), reflecting substantial price fluctuation patterns in a relatively shorter market presence
- MANA: Historical price movements from $5.85 (November 2021) to current levels demonstrate sensitivity to broader metaverse sector sentiment and cryptocurrency market cycles
Technical Risk
- FTRB: Scalability considerations and network stability factors require ongoing assessment as the platform develops
- MANA: Considerations regarding decentralized virtual world infrastructure maintenance and potential technical challenges in platform operations
Regulatory Risk
- Global regulatory developments may impact both assets differently, with Web3 fashion platforms and metaverse projects potentially subject to evolving digital asset frameworks across various jurisdictions
VI. Conclusion: Which Is the Better Buy?
📌 Investment Value Summary:
- FTRB Characteristics: Represents exposure to the intersection of Web3 technology and fashion design collaboration, with price patterns reflecting early-stage project dynamics and higher volatility profiles
- MANA Characteristics: Offers exposure to an established metaverse platform with longer market history since 2017, demonstrating correlation with broader metaverse sector trends
✅ Investment Considerations:
- Novice Investors: Consider beginning with assets demonstrating longer market presence and established trading volumes; educational research regarding both projects' fundamentals recommended before allocation decisions
- Experienced Investors: May evaluate portfolio diversification strategies incorporating both assets based on individual risk tolerance, with consideration of different market capitalizations and liquidity profiles
- Institutional Investors: Comprehensive due diligence regarding project fundamentals, team backgrounds, technological infrastructure, and regulatory compliance frameworks advisable before capital allocation
⚠️ Risk Disclosure: Cryptocurrency markets exhibit substantial volatility. This content does not constitute financial advice, investment recommendations, or solicitation to buy or sell any assets. Individuals should conduct independent research and consult qualified financial advisors before making investment decisions.
VII. FAQ
Q1: What are the main differences between FTRB and MANA in terms of their use cases?
FTRB focuses on Web3 fashion design collaboration while MANA powers a decentralized metaverse platform. FTRB, launched in 2022, positions itself as an open-source collaborative fashion design platform empowering independent designers through reward mechanisms in the Web3 economy. MANA, established in 2017, serves as the native token for Decentraland, a blockchain-based virtual world platform that eliminates intermediary fees between content creators and users, representing one of the pioneering projects in the metaverse sector.
Q2: How do the price volatilities of FTRB and MANA compare historically?
FTRB demonstrates higher volatility with more extreme price swings in a shorter timeframe. FTRB's price declined from $0.07116 in March 2022 to a low of $0.00173617 in June 2024, representing a substantial correction within approximately two years. MANA, while also volatile, peaked at $5.85 in November 2021 and has declined to current levels around $0.1612, reflecting broader metaverse sector trends over a longer market cycle dating back to its 2017 launch at $0.00923681.
Q3: What is the current trading volume difference between FTRB and MANA?
MANA exhibits significantly higher trading volume compared to FTRB. As of January 22, 2026, MANA's 24-hour trading volume stands at $986,092.54, approximately 20 times larger than FTRB's trading volume of $47,321.60. This substantial difference in liquidity reflects MANA's more established market presence and broader adoption within the cryptocurrency ecosystem since its 2017 inception.
Q4: Which asset might be more suitable for conservative investors?
MANA may align better with conservative investment approaches due to its longer market history and established presence. Conservative investors considering allocation between these assets might favor a portfolio weighting of 70-80% MANA versus 20-30% FTRB, as MANA has demonstrated market resilience since 2017 and represents exposure to the more mature metaverse infrastructure sector, while FTRB represents an earlier-stage Web3 fashion platform with correspondingly higher volatility profiles.
Q5: What are the projected price ranges for FTRB and MANA by 2030?
Price projections suggest different growth trajectories for each asset by 2030. FTRB's baseline scenario estimates a range of $0.0083 - $0.014 for 2030, while MANA's baseline scenario projects $0.20 - $0.36 for the same period. These projections reflect FTRB's early-stage development phase with potential for gradual growth, while MANA's forecasts incorporate its established market position. However, these predictions remain speculative estimates subject to numerous unpredictable market factors.
Q6: How does the market sentiment currently affect both FTRB and MANA?
Both assets are currently influenced by an "Extreme Fear" market sentiment. The Fear & Greed Index stands at 24, indicating extreme fear conditions in the broader cryptocurrency market as of January 22, 2026. This bearish sentiment environment typically affects risk assets across the crypto sector, potentially creating downward price pressure on both FTRB and MANA, though their responses may differ based on their respective market capitalizations, liquidity profiles, and sector-specific dynamics.
Q7: What risk management strategies should investors consider when comparing FTRB and MANA?
Diversification and position sizing remain critical risk management approaches for both assets. Investors should consider implementing hedging tools including stablecoin allocations, options strategies, and cross-asset portfolio diversification. Aggressive investors might consider a 40-50% FTRB versus 50-60% MANA allocation, while conservative approaches suggest 20-30% FTRB versus 70-80% MANA. Additionally, conducting independent research on both projects' fundamentals, team backgrounds, technological infrastructure, and regulatory compliance frameworks is essential before capital allocation.
Q8: What are the key considerations for institutional investors evaluating FTRB versus MANA?
Institutional investors should prioritize comprehensive due diligence across multiple dimensions. Critical evaluation areas include project fundamentals, team backgrounds and track records, technological infrastructure stability and scalability, regulatory compliance frameworks across relevant jurisdictions, liquidity profiles and market depth, and correlation with broader cryptocurrency market cycles. Given the substantial differences in market capitalization, trading volumes, and market maturity between FTRB and MANA, institutional capital allocation decisions require thorough assessment of risk-adjusted return potential within the context of overall portfolio objectives.
* The information is not intended to be and does not constitute financial advice or any other recommendation of any sort offered or endorsed by Gate.