This article provides a comprehensive comparison between GARI and LINK tokens within the Web3 ecosystem, highlighting their investment value, supply mechanisms, and market applications. It addresses key questions relevant for investors, such as historical price trends and potential risks, and explains the suitable investment strategies for both tokens. The detailed analysis includes technical developments, institutional adoption, and factors affecting investment value, catering to both conservative and aggressive investors. Explore strategic insights to make informed decisions on whether GARI or LINK is a better buy, using real-time links from Gate for current prices.
Introduction: GARI vs LINK Investment Comparison
In the cryptocurrency market, the comparison between GARI and LINK has always been an unavoidable topic for investors. The two not only show significant differences in market cap ranking, application scenarios, and price performance but also represent different positions in crypto assets.
GARI (GARI): Since its launch in 2022, it has gained market recognition for its focus on short video content creators and social tokens.
LINK (LINK): Since its inception in 2017, it has been hailed as a decentralized oracle network, and is one of the cryptocurrencies with the highest global trading volume and market capitalization.
This article will comprehensively analyze the investment value comparison between GARI and LINK, focusing on historical price trends, supply mechanisms, institutional adoption, technological ecosystems, and future predictions, attempting to answer the question investors care about most:
"Which is the better buy right now?"
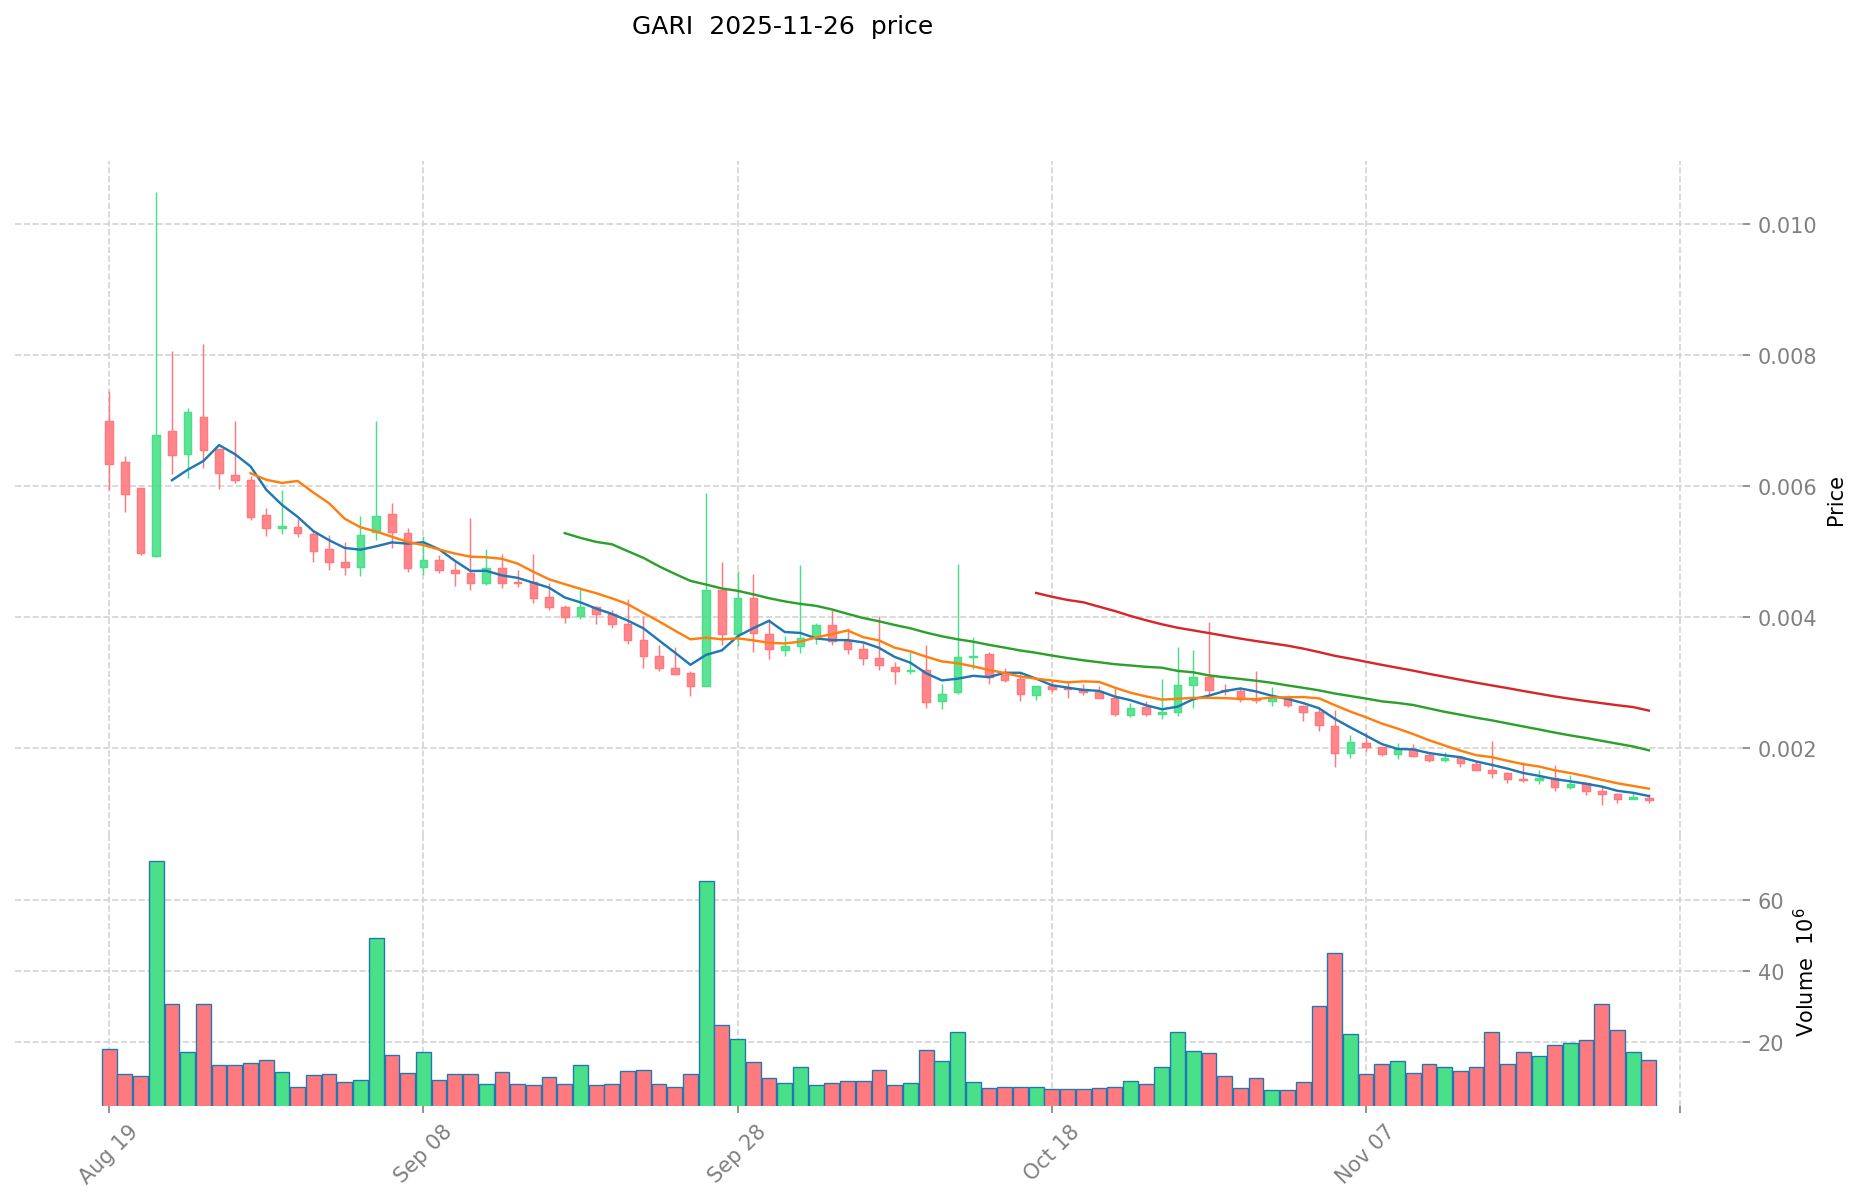
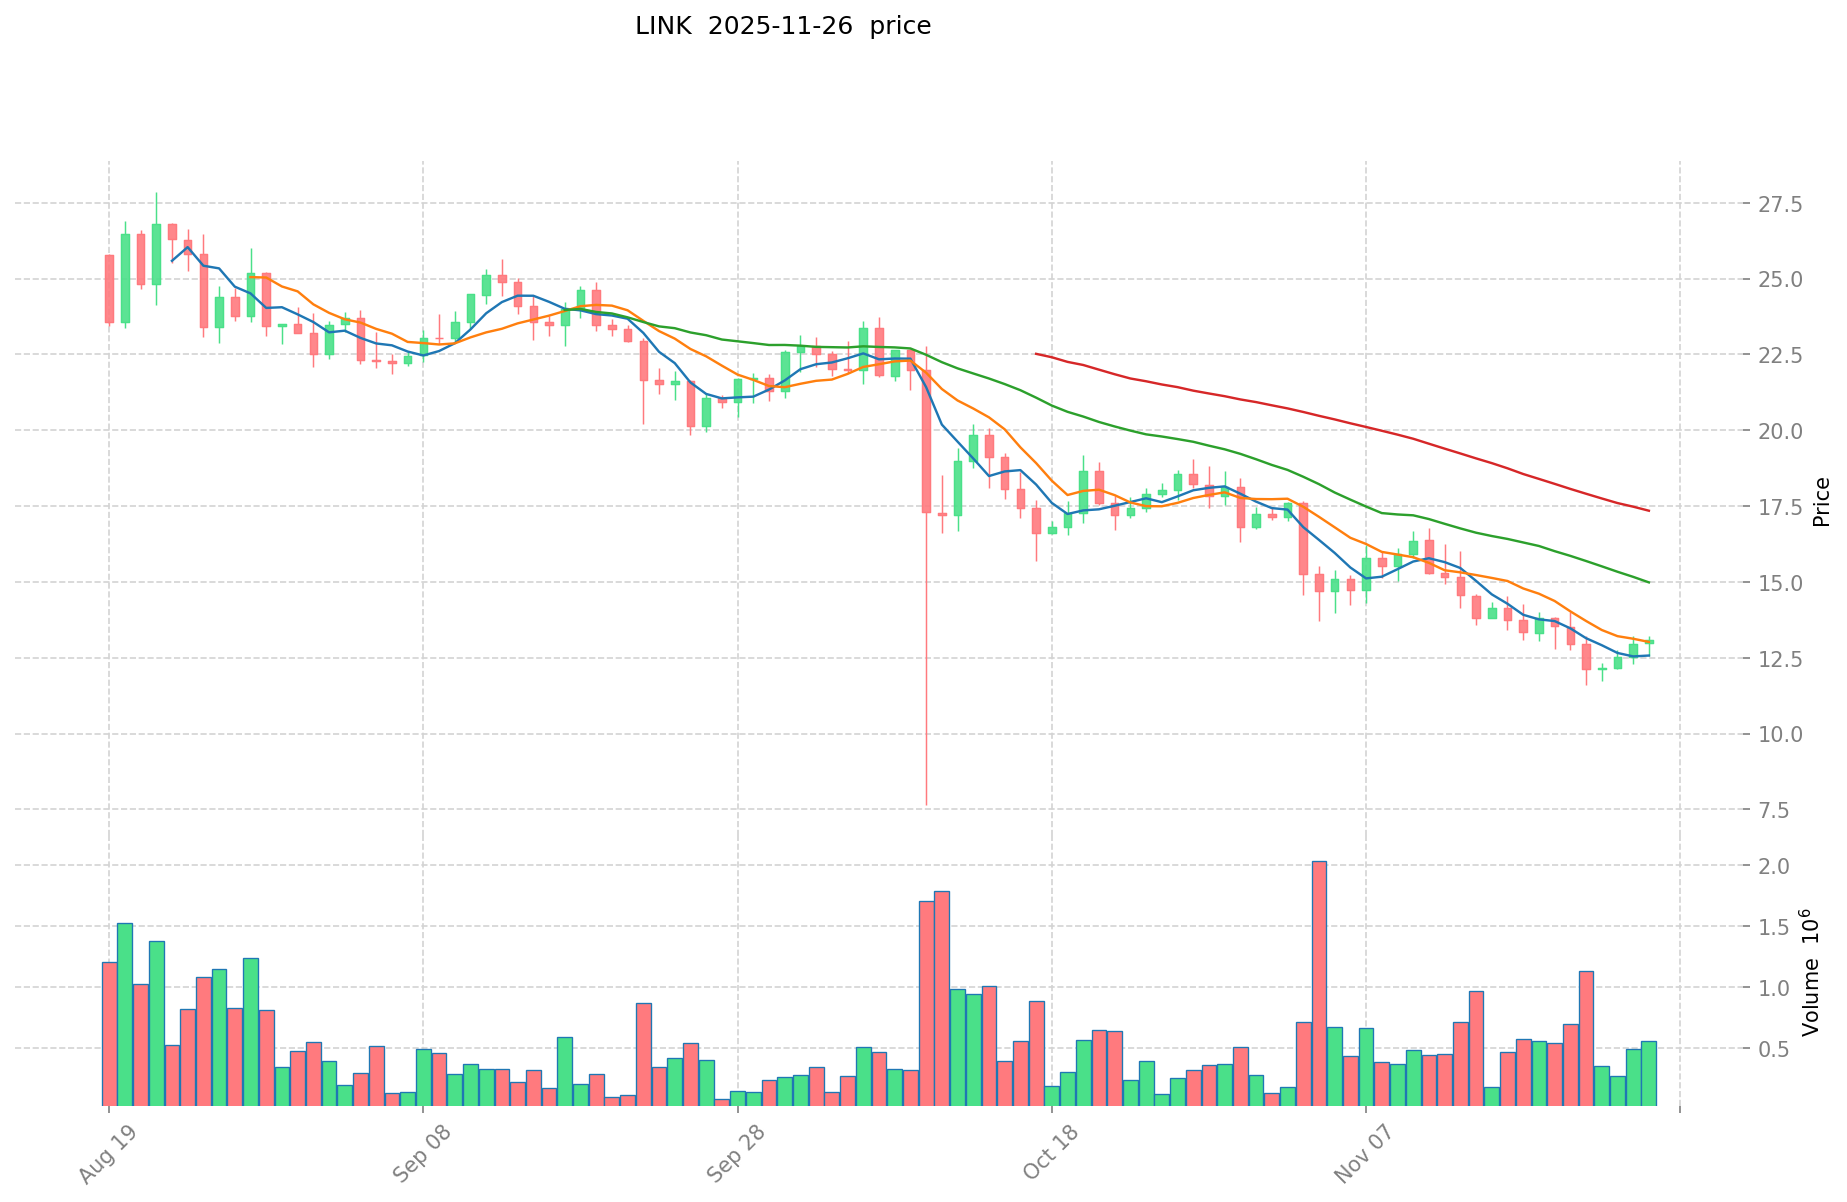
I. Price History Comparison and Current Market Status
GARI (Coin A) and LINK (Coin B) Historical Price Trends
- 2022: GARI reached its all-time high of $0.982499 on February 22, 2022.
- 2021: LINK achieved its all-time high of $52.7 on May 10, 2021.
- Comparative analysis: In the current market cycle, GARI has dropped from its all-time high of $0.982499 to a current price of $0.001178, while LINK has declined from its peak of $52.7 to $12.953.
Current Market Situation (2025-11-26)
- GARI current price: $0.001178
- LINK current price: $12.953
- 24-hour trading volume: GARI $19,627.53 vs LINK $4,956,869.14
- Market Sentiment Index (Fear & Greed Index): 20 (Extreme Fear)
Click to view real-time prices:
- View GARI current price Market Price
- View LINK current price Market Price
II. Key Factors Affecting the Investment Value of GARI vs LINK
Supply Mechanism Comparison (Tokenomics)
- GARI: Limited supply of 1 billion tokens with a gradual release schedule
- LINK: Maximum supply of 1 billion tokens with controlled release through node operation rewards
- 📌 Historical pattern: Both tokens feature capped supplies, but LINK's more established distribution mechanism has historically led to less price volatility compared to GARI's newer tokenomics model.
Institutional Adoption and Market Applications
- Institutional holdings: LINK has significantly higher institutional adoption with major holders including Grayscale and various crypto funds, while GARI has limited institutional presence
- Enterprise adoption: LINK powers thousands of oracle implementations across DeFi protocols, whereas GARI remains primarily focused on the Chingari social app ecosystem
- Regulatory attitudes: LINK benefits from broader regulatory clarity as an established utility token, while GARI faces greater regulatory uncertainty in many jurisdictions
Technical Development and Ecosystem Building
- GARI technical upgrades: Integration with Solana blockchain for improved transaction throughput and lower costs
- LINK technical development: CCIP (Cross-Chain Interoperability Protocol) implementation and Chainlink 2.0 roadmap expanding oracle capabilities
- Ecosystem comparison: LINK has extensive DeFi integration across multiple blockchains powering price feeds and VRF systems; GARI's ecosystem is primarily centered on content creation rewards within the Chingari app
Macroeconomic Factors and Market Cycles
- Performance in inflationary environments: LINK has demonstrated more resilience during inflationary periods due to its critical infrastructure role
- Macroeconomic monetary policy: Interest rates and USD index fluctuations have shown stronger correlation with GARI price movements than LINK
- Geopolitical factors: LINK's global infrastructure role provides broader geopolitical insulation, while GARI's concentration in specific markets (particularly India) creates higher regional exposure risk
III. 2025-2030 Price Prediction: GARI vs LINK
Short-term Prediction (2025)
- GARI: Conservative $0.00079194 - $0.001182 | Optimistic $0.001182 - $0.0016548
- LINK: Conservative $12.44736 - $12.966 | Optimistic $12.966 - $18.8007
Mid-term Prediction (2027)
- GARI may enter a growth phase, with an expected price range of $0.00136081296 - $0.00242503848
- LINK may enter a bullish market, with an expected price range of $15.9032041875 - $22.3359609375
- Key drivers: Institutional capital inflow, ETF developments, ecosystem growth
Long-term Prediction (2030)
- GARI: Base scenario $0.002639140809435 - $0.003879536989869 | Optimistic scenario $0.003879536989869+
- LINK: Base scenario $30.039968904257812 - $31.541967349470703 | Optimistic scenario $31.541967349470703+
View detailed price predictions for GARI and LINK
Disclaimer: The above predictions are based on historical data and market analysis. Cryptocurrency markets are highly volatile and subject to rapid changes. These forecasts should not be considered as financial advice. Always conduct your own research before making investment decisions.
GARI:
| 年份 |
预测最高价 |
预测平均价格 |
预测最低价 |
涨跌幅 |
| 2025 |
0.0016548 |
0.001182 |
0.00079194 |
0 |
| 2026 |
0.002070864 |
0.0014184 |
0.001163088 |
20 |
| 2027 |
0.00242503848 |
0.001744632 |
0.00136081296 |
48 |
| 2028 |
0.002189077002 |
0.00208483524 |
0.0016887165444 |
76 |
| 2029 |
0.00314132549787 |
0.002136956121 |
0.00117532586655 |
81 |
| 2030 |
0.003879536989869 |
0.002639140809435 |
0.001583484485661 |
124 |
LINK:
| 年份 |
预测最高价 |
预测平均价格 |
预测最低价 |
涨跌幅 |
| 2025 |
18.8007 |
12.966 |
12.44736 |
0 |
| 2026 |
19.8541875 |
15.88335 |
10.483011 |
22 |
| 2027 |
22.3359609375 |
17.86876875 |
15.9032041875 |
37 |
| 2028 |
28.545358078125 |
20.10236484375 |
17.288033765625 |
55 |
| 2029 |
35.756076347578125 |
24.3238614609375 |
21.161759471015625 |
87 |
| 2030 |
31.541967349470703 |
30.039968904257812 |
16.221583208299218 |
131 |
IV. Investment Strategy Comparison: GARI vs LINK
Long-term vs Short-term Investment Strategies
- GARI: Suitable for investors focused on social media trends and content creation ecosystems
- LINK: Suitable for investors seeking established infrastructure and DeFi exposure
Risk Management and Asset Allocation
- Conservative investors: GARI: 5% vs LINK: 95%
- Aggressive investors: GARI: 20% vs LINK: 80%
- Hedging tools: Stablecoin allocation, options, cross-currency portfolios
V. Potential Risk Comparison
Market Risks
- GARI: High volatility due to lower market cap and trading volume
- LINK: Correlation with overall crypto market sentiment and DeFi sector performance
Technical Risks
- GARI: Scalability, network stability on Solana
- LINK: Node centralization concerns, potential oracle manipulation
Regulatory Risks
- Global regulatory policies may have a more significant impact on GARI due to its focus on social media tokens, while LINK's utility token status provides some regulatory clarity
VI. Conclusion: Which Is the Better Buy?
📌 Investment Value Summary:
- GARI advantages: Potential for high growth in social token space, integration with popular short-video platform
- LINK advantages: Established market position, critical infrastructure for DeFi, cross-chain interoperability
✅ Investment Advice:
- New investors: Consider a small allocation to GARI for exposure to social tokens, with a larger position in LINK for stability
- Experienced investors: Balanced approach with higher LINK allocation, tactical GARI positions based on social media trends
- Institutional investors: Focus on LINK for its established market presence and critical role in DeFi infrastructure
⚠️ Risk Warning: Cryptocurrency markets are highly volatile. This article does not constitute investment advice.
None
VII. FAQ
Q1: What are the main differences between GARI and LINK?
A: GARI is a social token focused on short video content creators, while LINK is a decentralized oracle network with a larger market cap and wider adoption in the DeFi ecosystem.
Q2: Which token has shown better price performance historically?
A: LINK has demonstrated better historical price performance and stability compared to GARI. LINK reached its all-time high of $52.7 in May 2021, while GARI's all-time high was $0.982499 in February 2022.
Q3: How do the supply mechanisms of GARI and LINK compare?
A: Both tokens have a maximum supply of 1 billion. GARI has a gradual release schedule, while LINK's distribution is controlled through node operation rewards, which has historically led to less price volatility.
Q4: What are the key factors affecting the investment value of GARI and LINK?
A: Key factors include supply mechanisms, institutional adoption, market applications, technical development, ecosystem building, and macroeconomic factors such as inflation and interest rates.
Q5: Which token is considered more suitable for long-term investment?
A: LINK is generally considered more suitable for long-term investment due to its established market position, critical infrastructure role in DeFi, and broader ecosystem integration across multiple blockchains.
Q6: What are the potential risks associated with investing in GARI and LINK?
A: Risks include market volatility, technical challenges (such as scalability for GARI and node centralization for LINK), and regulatory uncertainties, particularly for GARI as a social media token.
Q7: How do institutional holdings compare between GARI and LINK?
A: LINK has significantly higher institutional adoption, with major holders including Grayscale and various crypto funds. GARI has limited institutional presence in comparison.
Q8: What is the recommended asset allocation for conservative vs. aggressive investors?
A: For conservative investors, a suggested allocation is 5% GARI and 95% LINK. For aggressive investors, the recommendation is 20% GARI and 80% LINK.
* The information is not intended to be and does not constitute financial advice or any other recommendation of any sort offered or endorsed by Gate.


