Cameron Winklevoss, Gemini co-founder, highlights Bitcoin trading below $90,000 as a potential last-chance buying opportunity amid significant market correction from record highs. Bitcoin has declined over $600 billion in market capitalization, pressured by macroeconomic headwinds including government uncertainties and trade tensions that now drive the asset class like traditional macro markets. The current environment shows bearish whale positioning with $2.17 billion in shorts outpacing $1.18 billion longs, alongside substantial ETF outflows signaling cooling institutional demand. However, technical analysis identifies critical support at $93,000 and $100,000 resistance, while continued institutional accumulation—including MicroStrategy's $835 million purchase—demonstrates underlying conviction. This article explores whether Bitcoin's current pullback represents a cyclical accumulation phase within a broader bull market, examining on-chain metrics, derivatives positioning, and macro catalysts shaping price
Gemini co-founder Cameron Winklevoss recently told investors that he believes Bitcoin under $90,000 may represent a last chance to buy at these levels, as the leading cryptocurrency slipped below that threshold, erased its gains accumulated in early 2025, and reignited debate about the current market cycle.
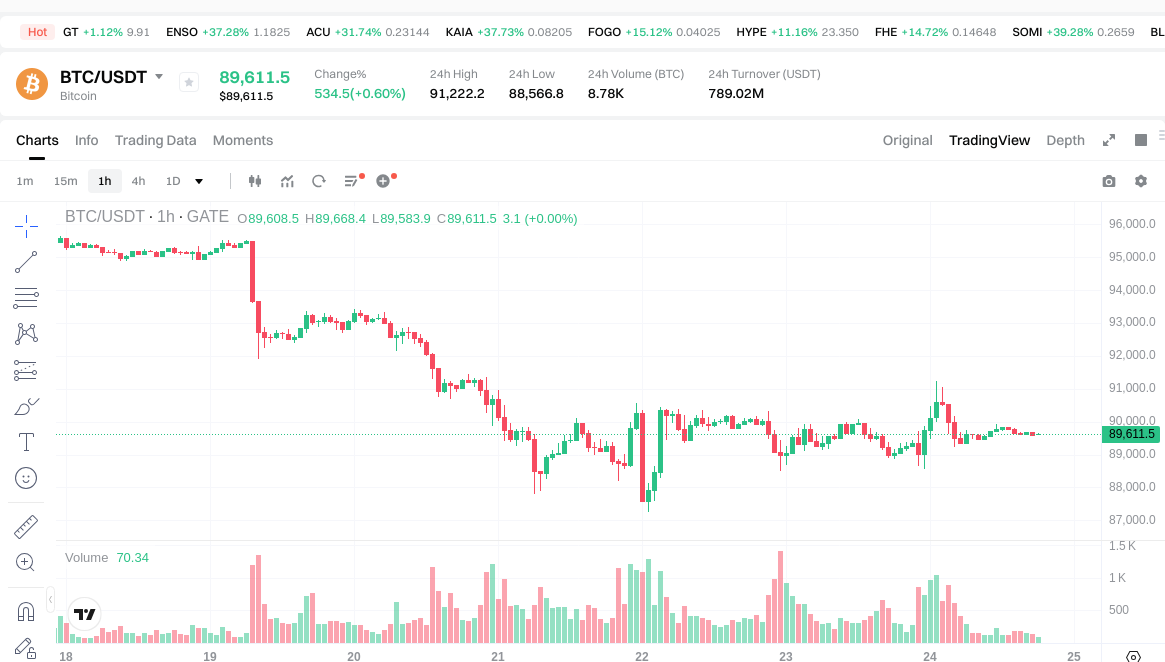
Bitcoin has experienced a significant correction from its record high above $126,000 reached earlier this year, dropping to the low $90,000 range. This decline has wiped approximately $600 billion from its market capitalization and taken prices back to levels last observed seven months prior. The magnitude of this move has revived familiar bull and bear arguments across cryptocurrency trading desks worldwide.
On one side of the debate, traders point to cycle panic as a driving factor. With no single headline trigger clearly responsible for the sell-off, many market participants have fallen back on the traditional four-year halving playbook as an explanatory framework. However, this historical pattern has become less tidy and predictable in the current era, largely due to the deep institutional capital flows that now characterize the Bitcoin market. These institutional participants bring different trading behaviors, time horizons, and risk management approaches compared to the retail-dominated cycles of the past.
Government Shutdown And Trade Tensions Add Pressure To Crypto
Macroeconomic conditions form a critical backdrop to Bitcoin's recent price action. An extended government shutdown in major economies, persistent trade war concerns between global powers, and weak liquidity conditions across financial markets have collectively weighed on risk assets. Cryptocurrency, increasingly viewed as a risk-on asset class by institutional investors, has found itself particularly exposed to swings in dollar strength, interest rate expectations, and global growth sentiment.
Market analysts emphasize that Bitcoin now trades more like a traditional macro asset than a purely supply-driven commodity. This evolution reflects the asset's maturation and integration into broader financial markets. When traditional risk assets face headwinds from policy uncertainty or liquidity constraints, Bitcoin tends to move in tandem rather than serving as an uncorrelated hedge. This correlation has become especially pronounced as institutional participation has grown through vehicles like spot ETFs and corporate treasury allocations.
The role of leverage has added significant fuel to the correction. The cryptocurrency market experienced a sharp sell-off following the liquidation of approximately $19 billion in leveraged positions in recent weeks. This forced deleveraging event was amplified by long-term holders choosing to take profits after substantial gains. The timing of the current correction is noteworthy, as it falls within the historical window when Bitcoin has often peaked in past cycles—roughly 400 to 600 days following a halving event. The most recent halving occurred in April 2024, placing the current period squarely within this traditional peak window.
Whale Shorts Now Outpace Longs As ETF Outflows Deepen
On-chain data from recent months reveals significant movement among large holders, commonly referred to as "whales" in cryptocurrency markets. Analysis from Bitunix identified clusters of wallet addresses holding more than 1,000 Bitcoin executing concentrated sales during the decline from below $100,000 toward $97,000. Both exchange data and derivatives market indicators point to synchronized selling pressure from these large participants.
The analysis noted a particularly striking shift in whale positioning: short exposure among large holders now substantially exceeds long positions. On-chain metrics show approximately $2.17 billion in short positions versus $1.18 billion in long positions among whale-sized accounts. This represents a significant bearish tilt among the market's largest and typically most informed participants.
Concurrently, Bitcoin spot ETFs have experienced several consecutive weeks of net outflows, totaling several billion dollars over a five-week period. These outflows reflect cooling institutional demand and potentially signal a shift in risk appetite among traditional financial institutions and their clients. The combination of whale selling and ETF redemptions creates a powerful one-two punch of selling pressure that the market has struggled to absorb.
Derivatives traders have responded to these conditions by actively buying protection through put options clustered around the $90,000 to $95,000 price range. This options activity signals strong demand for downside hedges at lower price levels and suggests that sophisticated traders are preparing for the possibility of further declines.
Research firms such as Glassnode and MarketVector have characterized the recent selling as "scheduled distribution" by long-term holders rather than panic liquidation. This framing suggests that experienced holders are methodically taking profits rather than fleeing in fear. However, these same analysts stress that the market's ability to absorb this supply has materially weakened compared to earlier periods. With ETF redemptions ongoing and slower institutional allocation rates, similar waves of selling can now drive sharper price moves and trigger more cascading liquidations than would have occurred when demand was stronger.
Deep Pullbacks Have Often Preceded Higher Highs In Bitcoin's History
From a technical analysis perspective, market watchers are closely monitoring $100,000 as a key resistance level and $93,000 as critical support. The $100,000 level represents both a psychological barrier and a technical inflection point—reclaiming this level on a sustained basis would likely shift sentiment and attract momentum buyers. Conversely, a decisive break below $93,000 could trigger additional technical selling and test lower support zones.
Bitunix analysts view whale wallet flows, ETF trend reversals, and options market positioning as the three primary signals to monitor for signs of a market bottom. A genuine turn in all three indicators—characterized by stronger spot inflows, easing short exposure among large holders, and calmer implied volatility in options markets—would suggest that real demand is returning to the market rather than merely temporary short covering or dead cat bounces.
Despite the challenging market conditions, institutional buyers continue to accumulate Bitcoin in the background. MicroStrategy, the business intelligence firm that has transformed itself into a Bitcoin treasury company, disclosed in recent days that it had purchased an additional 8,178 Bitcoin at an average price of $102,171. This acquisition, totaling approximately $835 million, adds to a balance sheet that already makes MicroStrategy one of the largest corporate holders of Bitcoin globally. The company's continued buying through market weakness demonstrates conviction in Bitcoin's long-term value proposition, even as short-term price action remains volatile.
Cameron Winklevoss' assertion that the current dip below $90,000 could represent a last chance to buy at these levels speaks to a familiar and recurring theme in cryptocurrency markets: that deep drawdowns are often part of the path to higher highs. This perspective draws on Bitcoin's historical pattern of experiencing severe corrections within bull markets, only to subsequently reach new all-time highs. However, Winklevoss and other analysts acknowledge that the route to those potential higher prices is now as dependent on global liquidity conditions, monetary policy decisions, and institutional capital allocation as it is on traditional cryptocurrency-specific factors like halving cycles and on-chain supply dynamics. The maturation of Bitcoin as an asset class means its price discovery increasingly reflects the same macro forces that drive traditional financial markets.
FAQ
Why is Bitcoin's price below $90K considered a rare buying opportunity?
Bitcoin below $90K represents a psychological support level where historical accumulation occurs. Lower prices attract institutional and retail buyers seeking better entry points before potential upside rallies. This level often precedes significant price recovery cycles in crypto market cycles.
Cameron Winklevoss为什么看好这个价格水平的比特币?
Cameron Winklevoss认为比特币在90000美元以下是难得的买入机会,因为这个价格水平具有强支撑位,且长期来看比特币具有稀缺性和价值增长潜力。
How should bitcoin beginners enter at lower prices?
Begin with small amounts through dollar-cost averaging to reduce timing risk. Set clear entry targets below key support levels. Accumulate gradually during market pullbacks. Start with 5-10% of your intended investment, then increase position size as you gain experience and market conviction strengthens.
What are the historical support levels for Bitcoin below $90,000?
Bitcoin's key historical support levels below $90,000 include approximately $85,000, $80,000, and $75,000. The $80,000 level represents significant technical support from previous consolidation periods. Lower support extends to $70,000-$72,000 range, which has provided strong buying pressure during past corrections. These levels are based on established price action and trading volume concentration.
What are the key risk factors to consider when investing in Bitcoin?
Bitcoin investment risks include market volatility, regulatory uncertainty, cybersecurity threats, liquidity fluctuations, and macroeconomic factors. Price can swing dramatically based on sentiment shifts and global events. Ensure you only invest capital you can afford to lose.
* The information is not intended to be and does not constitute financial advice or any other recommendation of any sort offered or endorsed by Gate.