This comprehensive analysis compares GEOD and XTZ, two emerging blockchain assets with distinct market positioning. GEOD, launched September 2023, operates as a decentralized DePIN network for real-time kinematics positioning, currently trading at $0.1563. XTZ, established October 2017, functions as a self-amending smart contract platform, trading at $0.6155. The comparison examines historical price trends, supply mechanisms, institutional adoption, technical ecosystems, and performance forecasts through 2031. While XTZ demonstrates greater liquidity and maturity with $639,659 daily volume versus GEOD's $55,301, GEOD presents emerging infrastructure growth potential. Conservative investors may favor XTZ's 70-80% allocation, while aggressive investors balance 40-50% GEOD exposure. This guide addresses key investment considerations across different investor profiles using Gate as the primary trading platform.
Introduction: Investment Comparison Between GEOD and XTZ
In the cryptocurrency market, the comparison between GEODNET (GEOD) and Tezos (XTZ) has become a topic of interest for investors. Both projects demonstrate distinct differences in market capitalization rankings, application scenarios, and price performance, representing different positioning within the crypto asset landscape.
GEODNET (GEOD): Launched in September 2023, this project has gained market recognition by positioning itself as the world's largest Real-Time Kinematics (RTK) network, utilizing DePIN principles to build a decentralized infrastructure for space weather monitoring and centimeter-level positioning accuracy.
Tezos (XTZ): Since its launch in October 2017, this blockchain platform has been recognized for its self-amending capabilities and formal verification features, establishing itself as a versatile and evolving cryptographic ledger with support from a broad ecosystem.
This article will provide a comprehensive analysis of the investment value comparison between GEOD and XTZ, examining historical price trends, supply mechanisms, institutional adoption, technical ecosystems, and future projections, attempting to address investors' most pressing question:
"Which is the better buy right now?"
I. Historical Price Comparison and Current Market Status
Historical Price Trends of GEOD (Coin A) and XTZ (Coin B)
- 2021: XTZ experienced notable price movements, reaching a historical high of $9.12 on October 4, 2021, driven by increased adoption in DeFi applications and NFT marketplaces.
- 2018: XTZ recorded its historical low of $0.350476 on December 7, 2018, following the mainnet launch delays and early market volatility.
- 2025: GEOD reached its historical high of $0.37899 on January 25, 2025, as the DePIN network expanded its global RTK infrastructure coverage.
- 2025: GEOD recorded its historical low of $0.09605 on October 12, 2025, during a period of broader market correction.
- Comparative Analysis: During recent market cycles, GEOD has demonstrated price volatility within a range from $0.09605 to $0.37899, while XTZ has experienced a broader historical range from $0.350476 to $9.12, reflecting its longer market presence and different market positioning.
Current Market Status (2026-01-18)
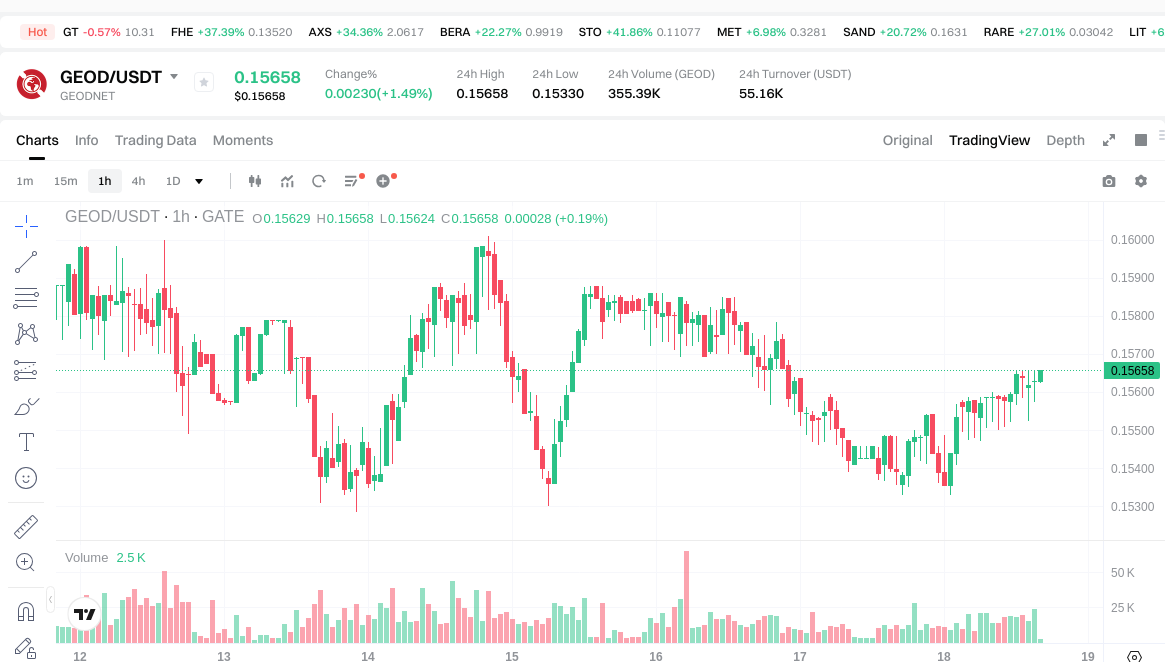
- GEOD Current Price: $0.1563
- XTZ Current Price: $0.6155
- 24-hour Trading Volume: GEOD $55,301.92 vs XTZ $639,659.29
- Market Sentiment Index (Fear & Greed Index): 49 (Neutral)
View Real-time Prices:

II. Core Factors Influencing GEOD vs XTZ Investment Value
Supply Mechanism Comparison (Tokenomics)
- GEOD: The token's value is influenced by market dynamics including demand, scarcity, and utility within the cryptocurrency ecosystem. These factors interact with its market price to determine relative value against other digital assets.
- XTZ: As mentioned in trading platforms, XTZ operates within established cryptocurrency markets with its own supply characteristics that affect its market positioning and price behavior.
- 📌 Historical Pattern: Supply mechanisms interact with market demand and utility to create price cycles, where periods of scarcity combined with increasing utility can influence valuation trends.
Institutional Adoption and Market Application
- Institutional Holdings: Market data suggests varying levels of institutional interest across different cryptocurrency assets, with factors such as market capitalization, liquidity, and regulatory clarity playing significant roles.
- Enterprise Adoption: Both assets exist within the broader cryptocurrency trading infrastructure, with presence on various exchanges and trading platforms indicating different levels of market integration.
- National Policies: Regulatory approaches toward cryptocurrencies vary across jurisdictions, affecting market accessibility and institutional participation for different digital assets.
Technical Development and Ecosystem Building
- GEOD Technical Development: The token participates in the cryptocurrency market infrastructure with its value proposition tied to demand, scarcity, and utility factors within its operational context.
- XTZ Technical Development: XTZ maintains presence across multiple trading platforms and exchanges, indicating ongoing market integration and technical infrastructure support.
- Ecosystem Comparison: Both assets operate within the broader cryptocurrency market, with varying degrees of integration into trading platforms, exchanges, and digital asset infrastructure.
Macroeconomic Environment and Market Cycles
- Performance Under Inflation: Cryptocurrency assets generally exhibit varied responses to inflationary environments, with market sentiment, adoption rates, and utility playing important roles in determining relative performance.
- Macroeconomic Monetary Policy: Interest rates, currency valuations, and broader financial conditions influence cryptocurrency market dynamics, affecting investor behavior and capital allocation across different digital assets.
- Geopolitical Factors: Cross-border transaction capabilities and international market conditions contribute to demand patterns for cryptocurrency assets, though specific impacts vary based on market sentiment and adoption trends.
III. 2026-2031 Price Forecast: GEOD vs XTZ
Short-term Forecast (2026)
- GEOD: Conservative $0.10-$0.16 | Optimistic $0.16-$0.23
- XTZ: Conservative $0.57-$0.62 | Optimistic $0.62-$0.73
Mid-term Forecast (2028-2029)
- GEOD may enter a consolidation phase, with estimated price range of $0.12-$0.24
- XTZ may enter an expansion phase, with estimated price range of $0.43-$0.96
- Key drivers: institutional capital inflows, ETF developments, ecosystem growth
Long-term Forecast (2030-2031)
- GEOD: Baseline scenario $0.18-$0.26 | Optimistic scenario $0.26-$0.30
- XTZ: Baseline scenario $0.85-$1.09 | Optimistic scenario $1.09-$1.30
View detailed price predictions for GEOD and XTZ
Disclaimer
GEOD:
| Year |
Predicted High Price |
Predicted Average Price |
Predicted Low Price |
Price Change |
| 2026 |
0.2301726 |
0.15658 |
0.1049086 |
0 |
| 2027 |
0.210780167 |
0.1933763 |
0.112158254 |
23 |
| 2028 |
0.21824449218 |
0.2020782335 |
0.123267722435 |
29 |
| 2029 |
0.2374823400092 |
0.21016136284 |
0.1597226357584 |
34 |
| 2030 |
0.295444843880472 |
0.2238218514246 |
0.208154321824878 |
43 |
| 2031 |
0.303771016753467 |
0.259633347652536 |
0.176550676403724 |
66 |
XTZ:
| Year |
Predicted High Price |
Predicted Average Price |
Predicted Low Price |
Price Change |
| 2026 |
0.728768 |
0.6176 |
0.574368 |
0 |
| 2027 |
0.78762528 |
0.673184 |
0.49142432 |
9 |
| 2028 |
0.9641341248 |
0.73040464 |
0.4309387376 |
18 |
| 2029 |
0.898105545344 |
0.8472693824 |
0.567670486208 |
37 |
| 2030 |
1.30030432116928 |
0.872687463872 |
0.84650683995584 |
41 |
| 2031 |
1.129955728221465 |
1.08649589252064 |
1.021306138969401 |
76 |
IV. Investment Strategy Comparison: GEOD vs XTZ
Long-term vs Short-term Investment Strategies
- GEOD: May be suitable for investors focused on emerging DePIN infrastructure and decentralized positioning technology applications, with interest in early-stage network growth potential
- XTZ: May appeal to investors seeking exposure to established blockchain platforms with self-amending capabilities and formal verification features, alongside a more mature ecosystem presence
Risk Management and Asset Allocation
- Conservative Investors: GEOD 20-30% vs XTZ 70-80%
- Aggressive Investors: GEOD 40-50% vs XTZ 50-60%
- Hedging Tools: Stablecoin allocation, options strategies, cross-asset portfolio diversification
V. Potential Risk Comparison
Market Risk
- GEOD: Price volatility associated with lower trading volumes ($55,301.92 in 24-hour volume as of 2026-01-18), shorter market history since September 2023, and exposure to broader DePIN sector sentiment shifts
- XTZ: Market fluctuations influenced by competitive dynamics in the smart contract platform sector, historical price range variations from $0.350476 to $9.12, and sensitivity to institutional adoption patterns
Technical Risk
- GEOD: Scalability considerations for expanding RTK network infrastructure, network stability requirements for centimeter-level positioning accuracy maintenance
- XTZ: Platform evolution dependencies related to self-amending protocol mechanisms, potential technical challenges in maintaining formal verification standards
Regulatory Risk
- Global regulatory approaches toward cryptocurrency assets may affect both projects differently, with GEOD's infrastructure focus and XTZ's platform positioning potentially subject to varying jurisdictional interpretations regarding decentralized networks and smart contract platforms
VI. Conclusion: Which Is the Better Buy?
📌 Investment Value Summary:
- GEOD Considerations: Positioning within the emerging DePIN sector for real-time kinematics applications, network expansion since September 2023, current price point of $0.1563 (as of 2026-01-18)
- XTZ Considerations: Established presence since October 2017, self-amending blockchain capabilities with formal verification features, broader ecosystem integration across trading platforms
✅ Investment Considerations:
- Beginner Investors: May consider starting with assets having higher liquidity and longer track records, while maintaining smaller allocations to emerging projects for portfolio diversification
- Experienced Investors: Could evaluate both assets based on individual risk tolerance, technical understanding of DePIN infrastructure versus smart contract platforms, and portfolio rebalancing strategies aligned with market cycles
- Institutional Investors: May assess allocation decisions based on factors including liquidity requirements, regulatory compliance considerations, custody solutions availability, and correlation with existing portfolio holdings
⚠️ Risk Warning: The cryptocurrency market exhibits high volatility. This content does not constitute investment advice.
VII. FAQ
Q1: What are the main differences between GEOD and XTZ in terms of market maturity and trading volume?
XTZ demonstrates significantly higher market maturity with $639,659.29 in 24-hour trading volume compared to GEOD's $55,301.92 as of January 18, 2026. XTZ has been operating since October 2017, establishing a longer track record and broader market presence, while GEOD launched in September 2023 as an emerging DePIN-focused project. The substantial difference in trading volumes indicates XTZ offers greater liquidity, which typically translates to easier entry and exit positions with potentially lower price slippage for investors.
Q2: How do the historical price ranges of GEOD and XTZ compare?
XTZ exhibits a broader historical price range from $0.350476 (December 2018 low) to $9.12 (October 2021 high), while GEOD shows a narrower range between $0.09605 (October 2025 low) and $0.37899 (January 2025 high). This reflects XTZ's longer market presence and exposure to multiple cryptocurrency market cycles. GEOD's more compressed price history indicates it has yet to experience the full spectrum of bull and bear market conditions that XTZ has weathered over its nearly eight-year existence.
Q3: What are the projected price ranges for GEOD and XTZ through 2031?
For 2026, GEOD's conservative forecast ranges from $0.10-$0.16 with an optimistic scenario of $0.16-$0.23, while XTZ projects $0.57-$0.62 conservatively and $0.62-$0.73 optimistically. By 2031, GEOD's baseline scenario estimates $0.18-$0.26 with optimistic projections reaching $0.26-$0.30, whereas XTZ forecasts $0.85-$1.09 in baseline scenarios and $1.09-$1.30 optimistically. These projections suggest XTZ maintains higher absolute price levels, though percentage growth potential varies based on network adoption, ecosystem development, and broader market conditions.
Q4: What are the key technical differences between GEOD and XTZ ecosystems?
GEOD focuses on decentralized physical infrastructure (DePIN) for real-time kinematics networks, providing centimeter-level positioning accuracy and space weather monitoring through distributed infrastructure. XTZ operates as a self-amending blockchain platform with formal verification capabilities, enabling smart contract deployment and governance evolution without hard forks. These fundamental differences mean GEOD targets geospatial and positioning applications, while XTZ serves broader decentralized application development, NFT marketplaces, and DeFi protocols, representing distinct value propositions within the cryptocurrency ecosystem.
Q5: How should different investor profiles approach allocation between GEOD and XTZ?
Conservative investors may consider allocating 20-30% to GEOD and 70-80% to XTZ, prioritizing the more established platform's liquidity and track record. Aggressive investors might shift toward 40-50% GEOD and 50-60% XTZ allocations, accepting higher volatility for potential early-stage growth exposure in DePIN infrastructure. Beginner investors typically benefit from starting with higher-liquidity assets like XTZ while maintaining smaller positions in emerging projects, whereas experienced investors can evaluate technical differentiators between DePIN networks and smart contract platforms when determining portfolio weights based on individual risk tolerance and market cycle positioning.
Q6: What regulatory considerations affect GEOD and XTZ differently?
GEOD's infrastructure-focused positioning as a decentralized RTK network may face regulatory frameworks related to telecommunications infrastructure, positioning services, and physical network operations across different jurisdictions. XTZ's smart contract platform status subjects it to regulations governing blockchain platforms, token securities classifications, and decentralized application ecosystems. These distinct regulatory profiles mean each asset may respond differently to evolving cryptocurrency legislation, with GEOD potentially affected by infrastructure-specific regulations and XTZ by platform and application-layer regulatory developments in various markets.
Q7: What market risks should investors consider when comparing GEOD and XTZ?
GEOD faces risks associated with lower trading volumes creating potential liquidity constraints, shorter operational history limiting stress-test data, and exposure to emerging DePIN sector sentiment fluctuations. XTZ encounters competitive pressures from other smart contract platforms, market sensitivity to institutional adoption patterns, and historical volatility evidenced by its $0.350476 to $9.12 price range. Both assets remain subject to broader cryptocurrency market cycles, macroeconomic conditions affecting risk asset allocations, and evolving regulatory landscapes, though their specific risk profiles differ based on their distinct technological focuses and market positioning.
Q8: How do supply mechanisms influence the investment thesis for GEOD versus XTZ?
Both assets operate within cryptocurrency market dynamics where supply characteristics interact with demand, utility, and scarcity factors to influence valuation. Supply mechanisms create fundamental frameworks for token economics, affecting inflation rates, circulating supply growth, and long-term value propositions. Investors should evaluate how each project's tokenomics align with network usage patterns—GEOD's value tied to RTK network expansion and positioning service demand, while XTZ's economics connect to platform adoption, staking participation, and smart contract deployment activity. These supply-demand dynamics contribute to different price behavior patterns and investment horizon considerations for each asset.
* The information is not intended to be and does not constitute financial advice or any other recommendation of any sort offered or endorsed by Gate.