This comprehensive analysis compares GT and ATOM, two major blockchain assets launched in 2019. GT positions itself as an exchange ecosystem token emphasizing user asset security, while ATOM serves as Cosmos's interoperability infrastructure hub. Currently trading at $10.30 and $2.504 respectively, both assets have declined significantly from historical peaks. The article examines historical price trends, tokenomics, institutional adoption, technology ecosystems, and provides price forecasts through 2031. GT shows stronger trading volume and exchange integration potential, while ATOM focuses on cross-chain connectivity. Investment recommendations vary by risk tolerance: conservative investors may favor ATOM at 60-70% allocation, while aggressive investors could prioritize GT. Both assets present distinct opportunities and regulatory risks requiring careful risk assessment and portfolio diversification strategies.
Introduction: Investment Comparison Between GT and ATOM
In the cryptocurrency market, the comparison of GT vs ATOM continues to be a topic of interest for investors. The two assets demonstrate distinct differences in market cap ranking, use cases, and price performance, representing different positioning strategies within the crypto asset landscape.
GT (GateToken): Launched in 2019, GateChain positions itself as a next-generation public blockchain focusing on user asset security and decentralized trading, featuring innovative online hot insurance accounts and clearing guarantee systems designed to address core industry challenges including digital asset theft, private key loss, decentralized trading, and cross-chain transfers.
ATOM (Cosmos): Since its launch in 2019, Cosmos has been developing as a parallel network where chains are supported by consensus mechanisms such as Tendermint. The ecosystem enables different spaces to communicate, transact, and interoperate with each other, aiming to break barriers between blockchains and create an internet of blockchains.
This article will provide a comprehensive analysis of GT vs ATOM investment value comparison, examining historical price trends, supply mechanisms, institutional adoption, technological ecosystems, and future projections, attempting to address investors' most pressing question:
"Which is the better buy right now?"
I. Historical Price Comparison and Current Market Status
GT (Coin A) and ATOM (Coin B) Historical Price Trends
- 2022: GT experienced notable price movements, reaching a period high of $25.94 in January 2025.
- 2020: ATOM faced significant volatility, recording a low of $1.16 in March 2020 during market-wide downturns.
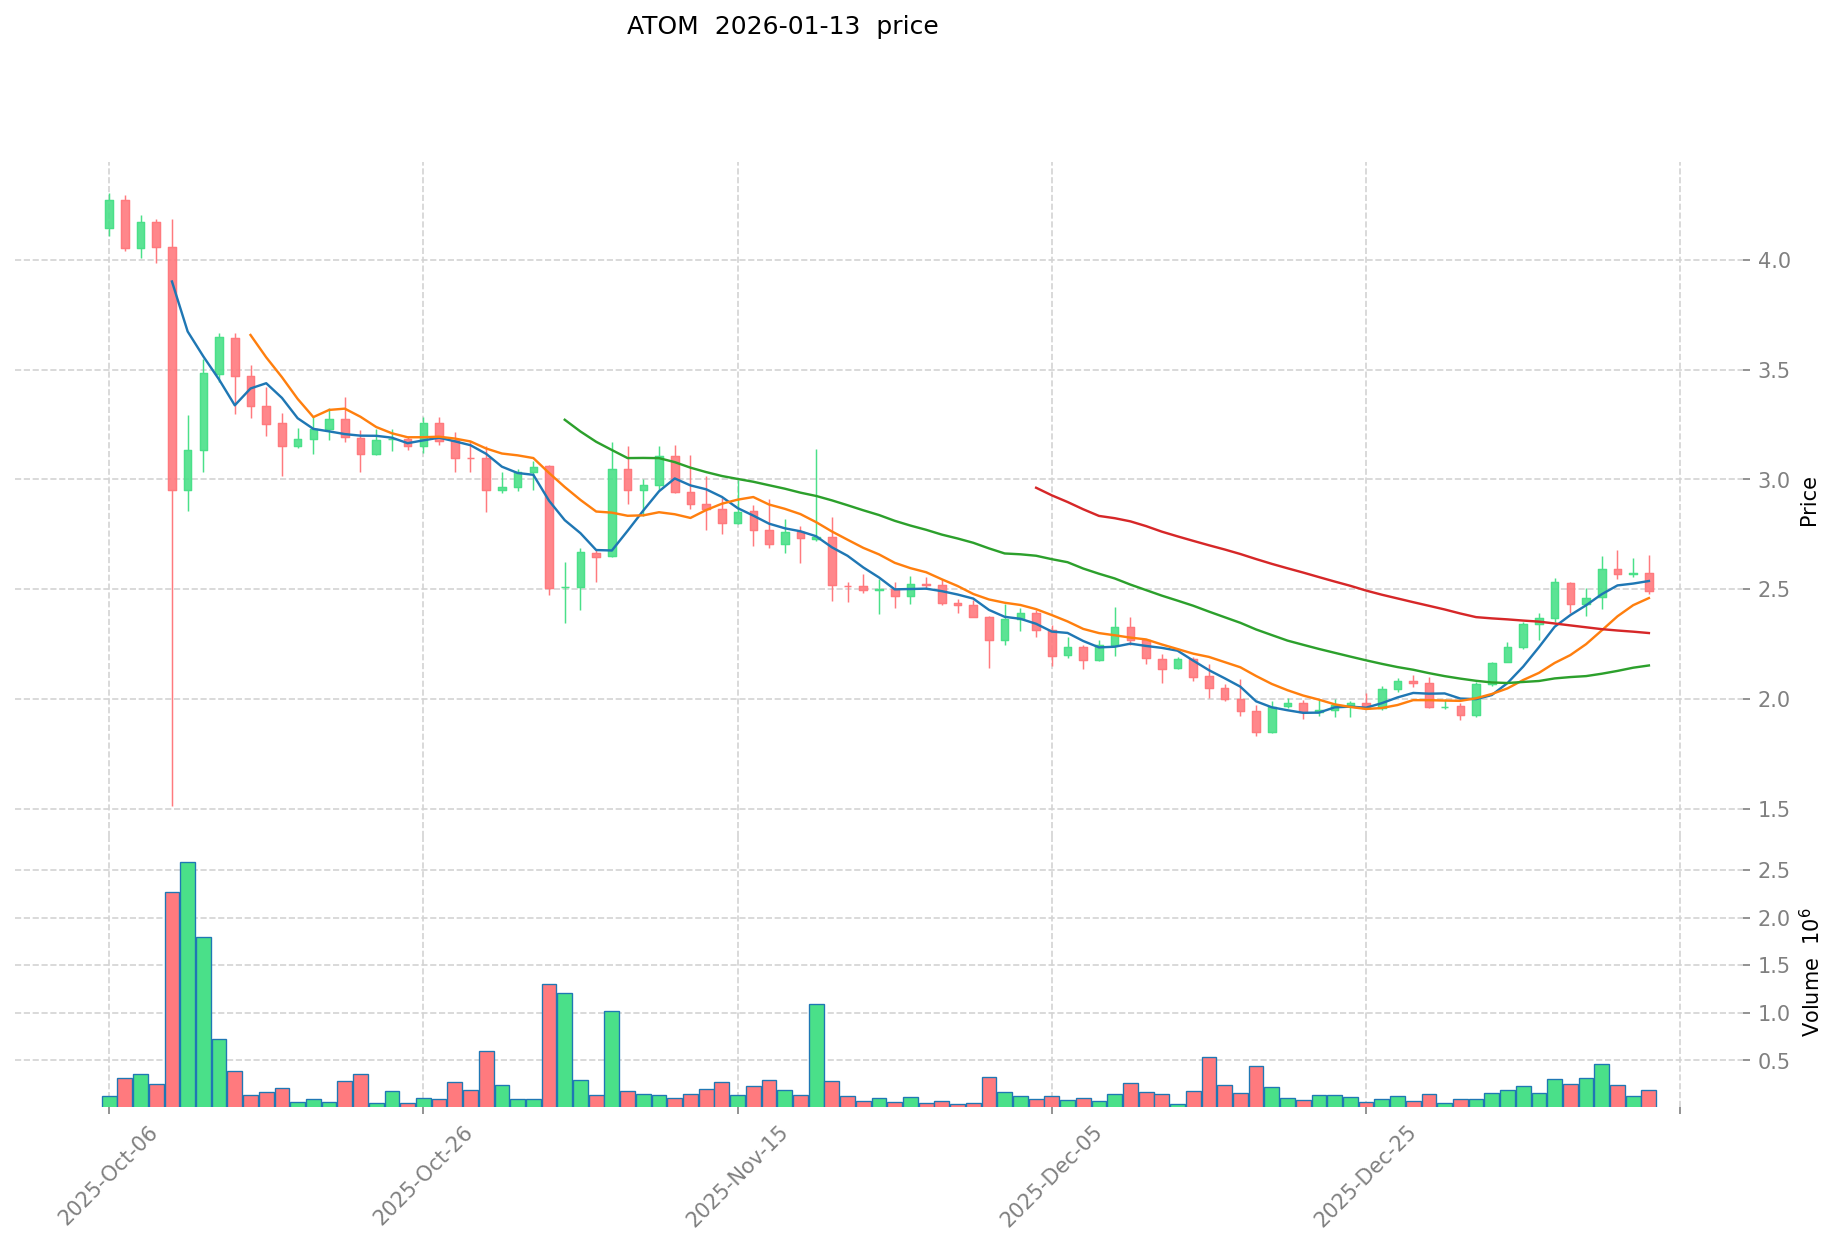
- Comparative analysis: GT has demonstrated a price range between $0.25754 and $25.94 across its trading history, while ATOM has fluctuated between $1.16 and $44.45. GT's current price of $10.30 represents a decline from its peak, whereas ATOM, priced at $2.504, has also experienced substantial depreciation from its high point.
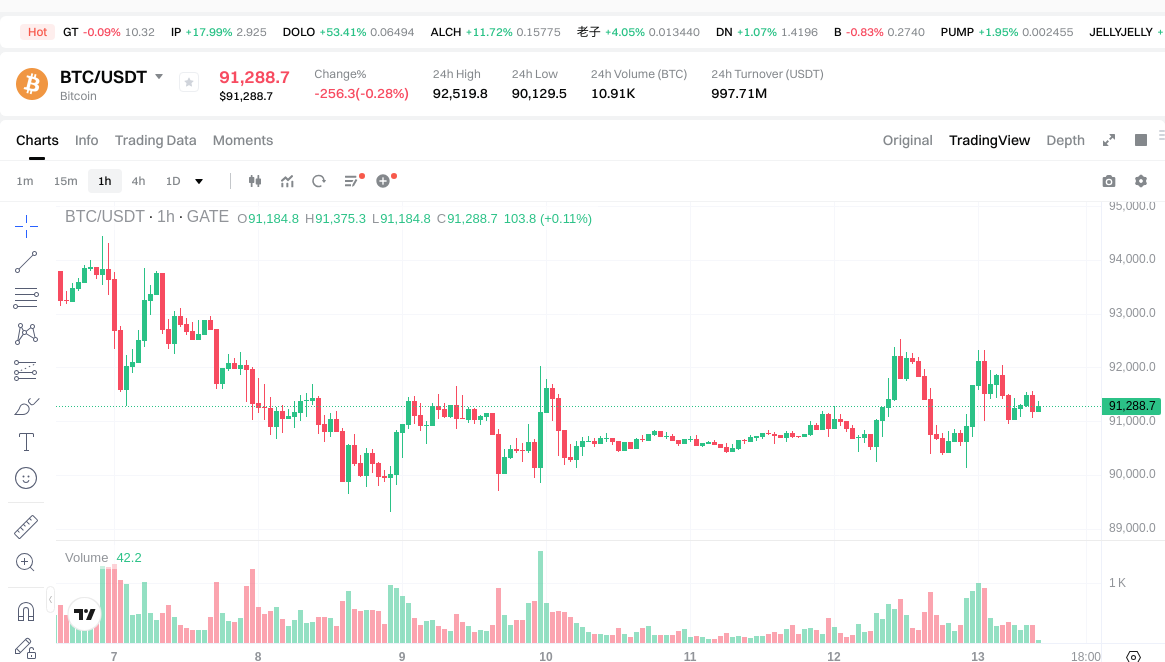
Current Market Status (2026-01-13)
- GT current price: $10.30
- ATOM current price: $2.504
- 24-hour trading volume: GT $793,750.84 vs ATOM $439,081.38
- Market sentiment index (Fear & Greed Index): 26 (Fear)
View real-time prices:
- Check GT current price Market Price
- Check ATOM current price Market Price
II. Core Factors Affecting GT vs ATOM Investment Value
Supply Mechanism Comparison (Tokenomics)
- GT: The available reference materials do not provide specific information about GT's supply mechanism or tokenomics model.
- ATOM: The available reference materials do not provide specific information about ATOM's supply mechanism or tokenomics model.
- 📌 Historical Pattern: Supply mechanisms can influence price cycles through controlled emission rates and deflationary or inflationary models, though specific data for these assets is not available in the provided materials.
Institutional Adoption and Market Applications
- Institutional Holdings: The reference materials do not contain comparative data on institutional preference between GT and ATOM.
- Enterprise Adoption: Information regarding cross-border payment, settlement, or investment portfolio applications for GT or ATOM is not available in the provided materials.
- National Policies: The provided materials do not include specific regulatory attitudes from different countries toward either GT or ATOM.
Technology Development and Ecosystem Building
- GT Technology Upgrades: The available reference materials do not provide details on GT's technical developments or their potential impacts.
- ATOM Technology Development: The available reference materials do not provide details on ATOM's technical developments or their potential impacts.
- Ecosystem Comparison: Information regarding DeFi, NFT, payment systems, or smart contract implementations for either GT or ATOM is not available in the provided materials.
Macroeconomic Factors and Market Cycles
- Performance Under Inflation: The reference materials do not contain comparative analysis of anti-inflation properties between GT and ATOM.
- Macroeconomic Monetary Policy: Data on how interest rates or the US Dollar Index specifically affect GT or ATOM is not available in the provided materials.
- Geopolitical Factors: Information regarding cross-border transaction demand or international situations affecting these assets is not included in the available materials.
III. 2026-2031 Price Forecast: GT vs ATOM
Short-term Forecast (2026)
- GT: Conservative $8.36-$10.32 | Optimistic $10.32-$14.55
- ATOM: Conservative $1.39-$2.52 | Optimistic $2.52-$3.46
Mid-term Forecast (2028-2029)
- GT may enter a growth phase, with estimated price range of $12.84-$24.65
- ATOM may enter an expansion phase, with estimated price range of $1.98-$5.50
- Key drivers: institutional capital inflows, ETF developments, ecosystem expansion
Long-term Forecast (2030-2031)
- GT: Baseline scenario $11.58-$20.71 | Optimistic scenario $20.71-$24.47
- ATOM: Baseline scenario $3.00-$4.69 | Optimistic scenario $4.69-$5.77
View detailed price predictions for GT and ATOM
Disclaimer
GT:
| Year |
Predicted High Price |
Predicted Average Price |
Predicted Low Price |
Price Change |
| 2026 |
14.5512 |
10.32 |
8.3592 |
0 |
| 2027 |
17.782908 |
12.4356 |
11.938176 |
20 |
| 2028 |
18.43328988 |
15.109254 |
12.8428659 |
46 |
| 2029 |
24.6537697518 |
16.77127194 |
10.3981886028 |
62 |
| 2030 |
22.990898138949 |
20.7125208459 |
12.634637715999 |
101 |
| 2031 |
24.47391463151544 |
21.8517094924245 |
11.581406030984985 |
112 |
ATOM:
| Year |
Predicted High Price |
Predicted Average Price |
Predicted Low Price |
Price Change |
| 2026 |
3.45514 |
2.522 |
1.3871 |
0 |
| 2027 |
3.4966269 |
2.98857 |
1.8230277 |
19 |
| 2028 |
4.5072118455 |
3.24259845 |
2.723782698 |
29 |
| 2029 |
5.502365309805 |
3.87490514775 |
1.9762016253525 |
54 |
| 2030 |
5.016839694791925 |
4.6886352287775 |
3.0007265464176 |
87 |
| 2031 |
5.774757579523807 |
4.852737461784712 |
4.415991090224088 |
93 |
IV. Investment Strategy Comparison: GT vs ATOM
Long-term vs Short-term Investment Strategies
- GT: May suit investors focused on exchange ecosystem integration and platform utility applications, considering its association with trading platform services and user asset security features.
- ATOM: May suit investors interested in blockchain interoperability and cross-chain technology development, given its positioning as an infrastructure project for connecting different blockchain networks.
Risk Management and Asset Allocation
- Conservative investors: GT 30-40% vs ATOM 60-70% allocation may be considered, factoring in market volatility patterns and trading volume stability.
- Aggressive investors: GT 60-70% vs ATOM 30-40% allocation could be explored, based on potential ecosystem expansion and platform development opportunities.
- Hedging instruments: Stablecoin allocation, options strategies, and cross-asset portfolio diversification can be utilized to manage downside risk exposure.
V. Potential Risk Comparison
Market Risk
- GT: Price volatility demonstrated through historical range between $0.25754 and $25.94, with current trading at $10.30 showing substantial depreciation from peak levels. Trading volume of $793,750.84 indicates market participation levels that may impact liquidity during market stress periods.
- ATOM: Historical price fluctuation between $1.16 and $44.45 reflects significant market cycle sensitivity, with current price of $2.504 representing considerable distance from historical peaks. Lower 24-hour trading volume of $439,081.38 compared to GT may present liquidity considerations.
Technical Risk
- GT: Scalability and network stability factors should be monitored as platform usage evolves, though specific technical architecture details were not available in reference materials.
- ATOM: Network consensus mechanism dependencies and potential technical vulnerabilities require ongoing assessment, particularly regarding cross-chain security protocols.
Regulatory Risk
- Global regulatory developments may impact both assets differently, with exchange-affiliated tokens potentially facing distinct compliance requirements compared to infrastructure-focused blockchain projects. Jurisdictional approaches to crypto asset classification and trading platform regulations could create varied risk profiles for GT and ATOM holders.
VI. Conclusion: Which Is the Better Buy?
📌 Investment Value Summary:
- GT Advantages: Exchange ecosystem integration potential, platform utility features, and user asset security mechanisms may provide value proposition for investors seeking exposure to centralized-decentralized hybrid models.
- ATOM Advantages: Blockchain interoperability positioning, cross-chain infrastructure development focus, and established presence in the multi-chain connectivity space may appeal to investors evaluating long-term protocol layer opportunities.
✅ Investment Recommendations:
- Beginner investors: Consider starting with smaller position sizes in either asset, prioritizing thorough research of underlying technology and use cases before committing significant capital. Dollar-cost averaging strategies may help mitigate timing risk in volatile market conditions.
- Experienced investors: Evaluate portfolio diversification benefits of including both exchange-affiliated and infrastructure-focused assets, while monitoring technical developments and ecosystem growth metrics. Risk-adjusted position sizing based on individual portfolio objectives and market cycle analysis may be appropriate.
- Institutional investors: Conduct comprehensive due diligence on regulatory compliance status, liquidity depth, custody solutions, and governance structures for both assets. Consider correlation analysis with broader crypto market movements and traditional asset classes when incorporating into institutional portfolios.
⚠️ Risk Warning: The cryptocurrency market exhibits extreme volatility, and this article does not constitute investment advice. Investors should conduct independent research and consult with qualified financial advisors before making investment decisions.
VII. FAQ
Q1: What are the main differences between GT and ATOM in terms of their core use cases?
GT serves as an exchange ecosystem token focusing on user asset security and decentralized trading features, while ATOM functions as the hub token for Cosmos's blockchain interoperability network. GT integrates with trading platform services and implements online hot insurance accounts plus clearing guarantee systems, primarily addressing digital asset security concerns. ATOM, conversely, enables cross-chain communication and transaction capabilities across different blockchain networks through the Tendermint consensus mechanism, positioning itself as infrastructure for creating an internet of blockchains rather than exchange-specific applications.
Q2: How do the current prices of GT and ATOM compare to their historical peak values?
GT currently trades at $10.30, representing a 60.3% decline from its January 2025 peak of $25.94. ATOM trades at $2.504, showing a 94.4% depreciation from its historical high of $44.45. Both assets have experienced substantial corrections from their peak levels, though ATOM has undergone a more severe price contraction relative to its all-time high. GT's price range has been $0.25754-$25.94, while ATOM's trading history spans $1.16-$44.45, indicating both tokens have demonstrated significant volatility throughout their market cycles.
Q3: Which asset shows better trading volume and liquidity characteristics?
GT demonstrates higher 24-hour trading volume at $793,750.84 compared to ATOM's $439,081.38, suggesting stronger immediate market participation and potentially better liquidity conditions. The approximately 80.7% higher trading volume for GT may indicate more active trading interest and easier position entry/exit during normal market conditions. However, both volumes should be evaluated in context of overall market capitalization and historical trading patterns to assess true liquidity depth during potential market stress periods.
Q4: What are the projected price ranges for GT and ATOM through 2031?
For 2026, GT's conservative forecast ranges $8.36-$10.32 with an optimistic scenario of $10.32-$14.55, while ATOM projects $1.39-$2.52 conservatively and $2.52-$3.46 optimistically. By 2031, GT's baseline scenario estimates $11.58-$20.71 with an optimistic range of $20.71-$24.47, representing potential 112% growth from current levels. ATOM's 2031 baseline projects $3.00-$4.69 with optimistic targets of $4.69-$5.77, indicating potential 93% appreciation. These forecasts suggest GT may offer higher absolute growth potential, though both projections remain subject to substantial market uncertainties and should not be considered guaranteed outcomes.
Q5: How should investors approach portfolio allocation between GT and ATOM based on risk tolerance?
Conservative investors may consider a 30-40% GT and 60-70% ATOM allocation, factoring in ATOM's infrastructure positioning and GT's platform-specific exposure. Aggressive investors might explore reversed allocations of 60-70% GT and 30-40% ATOM, emphasizing GT's exchange ecosystem integration potential. Both strategies should incorporate hedging instruments including stablecoin reserves, options strategies, and cross-asset diversification to manage downside risks. Portfolio construction should align with individual investment horizons, with long-term holders potentially favoring infrastructure assets like ATOM, while short-term traders might leverage GT's higher trading volumes for tactical positioning.
Q6: What regulatory risks differentiate GT and ATOM investments?
GT, as an exchange-affiliated token, faces distinct regulatory scrutiny regarding securities classification, trading platform compliance requirements, and jurisdiction-specific exchange regulations. ATOM, positioned as blockchain infrastructure, encounters different regulatory considerations focused on cross-chain transaction oversight, network governance compliance, and protocol layer classifications. Global regulatory developments may impact these assets asymmetrically—exchange tokens potentially facing stricter operational requirements while infrastructure projects navigate evolving decentralized network regulations. Investors should monitor jurisdictional approaches to both exchange-linked assets and cross-chain protocol tokens, as divergent regulatory treatments could significantly affect accessibility and valuation trajectories.
Q7: Which technical risks should investors prioritize when evaluating GT versus ATOM?
GT investors should monitor platform scalability challenges, user asset security mechanism effectiveness, and integration dependencies with centralized exchange infrastructure. Network stability during high-volume trading periods and clearing guarantee system performance represent critical technical considerations. ATOM investors face different technical risks centered on Tendermint consensus reliability, cross-chain bridge security vulnerabilities, and interoperability protocol integrity across connected blockchains. Both assets require ongoing assessment of development activity, upgrade execution capabilities, and potential smart contract vulnerabilities, though ATOM's multi-chain architecture introduces additional complexity in security audit requirements compared to GT's exchange-focused implementation.
Q8: How does the current market sentiment (Fear Index at 26) affect GT and ATOM investment decisions?
The Fear & Greed Index reading of 26 indicates substantial market fear, historically associated with potential accumulation opportunities but also heightened volatility risks. Under fear conditions, GT's higher trading volume may provide better liquidity for position adjustments, while ATOM's lower volume could amplify price swings during panic selling. Fear environments typically compress valuations across crypto assets, potentially offering better entry points for long-term investors with strong risk tolerance. However, fear readings can persist or intensify before market recovery, suggesting dollar-cost averaging strategies may be more prudent than lump-sum investments. Both assets' correlation with broader crypto market sentiment means sustained fear conditions could pressure prices further regardless of individual project fundamentals.
* The information is not intended to be and does not constitute financial advice or any other recommendation of any sort offered or endorsed by Gate.