# Understanding Candlestick Patterns: Interpretation and Key Features in Trading
Master candlestick chart analysis with this comprehensive guide designed for traders seeking to decode market sentiment and price movements. This article equips you with essential knowledge to interpret candlestick components—open, close, high, and low prices—and recognize bullish and bearish patterns. Discover eight major bullish patterns (Hammer, Engulfing, Morning Star) and ten bearish patterns (Hanging Man, Evening Star, Three Black Crows) that signal potential reversals and continuations. Learn how to identify support and resistance levels, combine candlestick analysis with technical indicators like RSI and MACD on Gate, and develop a robust trading strategy. Whether you're analyzing stocks or cryptocurrencies on Gate, this guide transforms candlestick patterns from confusing symbols into actionable trading signals for informed decision-making.
What Is a Candlestick Chart?
Candlestick charts are a visual tool that helps you track the price movements of an asset (such as stocks, cryptocurrencies, and other financial instruments) over a specific period. Each "candlestick" on the chart provides you with four important pieces of information:
- Opening Price: The price at the beginning of the trading session.
- Closing Price: The price at the end of the trading session.
- Highest Price: The highest price reached during the session.
- Lowest Price: The lowest price reached during the session.
The color and shape of the candles reflect market sentiment, helping you recognize the balance between buyers and sellers. By understanding candlestick charts, traders and investors can make more informed decisions about market trends and potential price movements.
How to Read a Candlestick
To effectively interpret candlestick charts, it is essential to understand the key components of each candlestick:
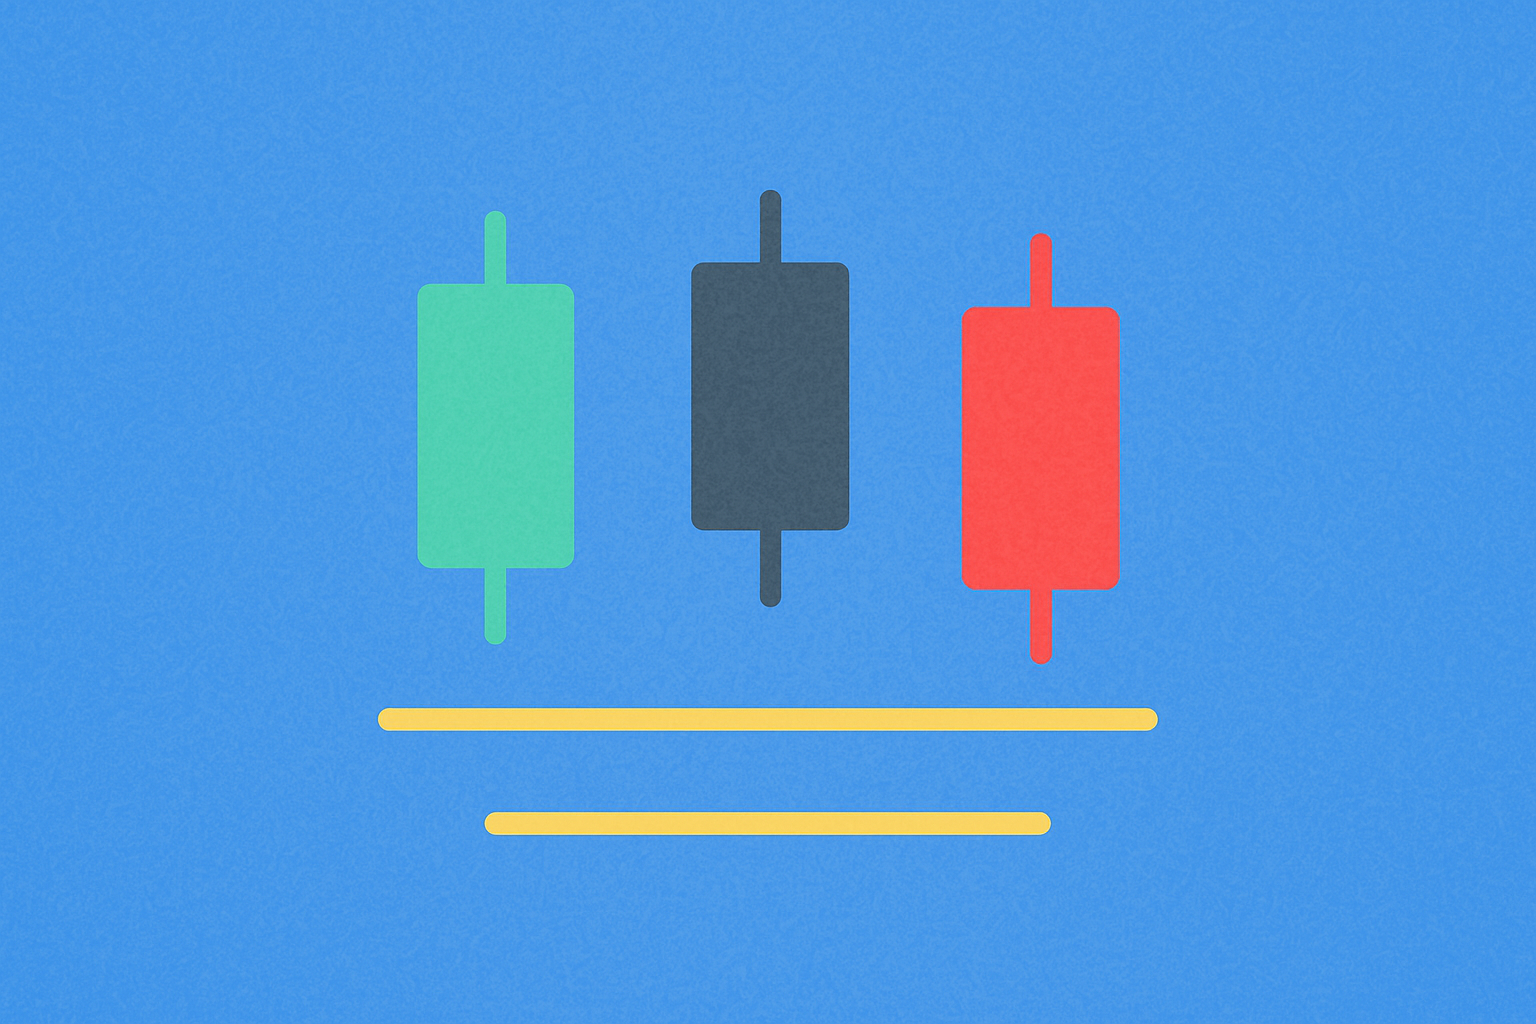
- Candle Body: The thick body represents the difference between the opening and closing prices. A larger body indicates a more significant price movement during the session.
- Candle Shadow (or Wick): The thin line above and below the candle body, representing the highest and lowest prices reached during the trading period.
- Bullish Candle (usually green): Closing price is higher than the opening price, indicating buying pressure.
- Bearish Candle (usually red): Closing price is lower than the opening price, indicating selling pressure.
Understanding these components allows traders to quickly assess market conditions and identify potential trading opportunities.
Bullish Candlestick Patterns
Bullish candlestick patterns indicate potential price increases and suggest that buying pressure may overcome selling pressure. Here are the most common bullish patterns:
Hammer
Single candle pattern with the following characteristics: small body, long lower shadow (at least double the body length), and very short or no upper shadow. The Hammer indicates that buying pressure is gradually increasing, pushing prices up after a deep decline. This pattern represents a potential reversal signal from bearish to bullish sentiment.
Bullish Engulfing
Two candle pattern characterized by a large green candle that completely "engulfs" the previous red candle. This pattern demonstrates that buying force completely overwhelms selling force, indicating a significant change in market sentiment and potential upward movement.
Morning Star
Three candle pattern consisting of three consecutive candles: a long red candle, a small body candle (which can be red or green), and a long green candle. The Morning Star signals the weakening of the downtrend and the emergence of buying pressure, leading to a potential reversal from bearish to bullish.
Piercing Line
Two candle pattern with a long red candle followed by a green candle that opens lower but closes above 50% of the red candle's body. This pattern indicates strong buying pressure pushing the price above the average of the previous bearish candle, demonstrating control by buyers.
Bullish Harami
Two candle pattern characterized by a long red candle followed by a small green candle fitting within the red candle body. The appearance of a small green candle indicates the hesitation of sellers and the potential for buying force to dominate the market.
Tweezer Bottom
Two candle pattern consisting of two consecutive candles with the lowest prices being nearly equal. Two price bottoms that are nearly the same indicate a strong support area, with a high possibility of an upward reversal.
Bullish Abandoned Baby
Three candle pattern featuring a long red candle, followed by a Doji candle (or a very small candle) with a downward gap, then a long green candle with an upward gap. The appearance of a Doji candle with a gap indicates a sudden change in market sentiment, signaling a strong reversal.
Three White Soldiers
Three candle pattern consisting of three consecutive long green candles, closing near the highest price. This pattern represents continuous strong buying force, showing complete control by buyers.
Rising Three Methods
Five candle pattern (can be more than five candles if the three red candles in the middle exceed three) characterized by a long green candle, followed by three small red candles, ending with a long green candle. The small red candles fit within the range of the first long green candle. This pattern indicates that after a short adjustment period, the uptrend continues to be confirmed.
Bearish Candlestick Patterns
Bearish candlestick patterns indicate potential price decreases and suggest that selling pressure may overcome buying pressure. Here are the most common bearish patterns:
Hanging Man
Single candle pattern similar to the Hammer, but appearing at the end of an uptrend. It is characterized by a small body, long lower shadow (at least double the body length), and very short or no upper shadow. The Hanging Man indicates that selling pressure is gradually appearing, warning of a potential reversal from bullish to bearish.
Bearish Engulfing
Two candle pattern characterized by a large red candle that completely "engulfs" the previous green candle. This pattern demonstrates that selling pressure completely overwhelms buying pressure, signaling a significant change in market sentiment.
Evening Star
Three candle pattern consisting of three consecutive candles: a long green candle, a small body candle (which can be green or red), and a long red candle. The Evening Star signals the weakening of the uptrend and the emergence of selling pressure, leading to a potential reversal.
Dark Cloud Cover
Two candle pattern with a long green candle followed by a red candle that opens higher but closes below 50% of the green candle's body. This pattern indicates strong selling pressure pushing the price below the average of the previous bullish candle, demonstrating control by sellers.
Bearish Harami
Two candle pattern characterized by a long green candle followed by a small red candle fitting within the green candle body. The appearance of a small red candle indicates the hesitation of buyers and the potential for selling force to dominate.
Tweezer Top
Two candle pattern consisting of two consecutive candles with the highest prices being nearly equal. Two price spikes that are nearly the same indicate a strong resistance area, with a high possibility of a downward reversal.
Shooting Star
Single candle pattern characterized by a small body and long upper shadow (at least double the body length). The Shooting Star indicates that strong selling pressure appears after a price increase, warning of a potential downward reversal.
Bearish Abandoned Baby
Three candle pattern featuring a long green candle, followed by a Doji candle (or a very small candle) with an upward gap, followed by a long red candle with a downward gap. The appearance of a Doji candle with a gap indicates a sudden change in market sentiment, signaling a strong reversal.
Three Black Crows
Three candle pattern consisting of three consecutive long red candles, closing near the lowest price. This pattern represents continuous strong selling pressure, showing complete control by sellers.
Falling Three Methods
Five candle pattern (can be more than five candles if the three green candles in the middle exceed three) characterized by a long red candle, followed by three small green candles, ending with a long red candle. The small green candles fit within the range of the first long red candle. This pattern indicates that after a short adjustment period, the downtrend continues to be confirmed.
Conclusion
Candlestick charts represent a powerful tool for analyzing market trends and identifying potential trading opportunities. The knowledge of various candlestick patterns discussed in this article can provide valuable insights into market sentiment and price movements.
It is important to recognize that the financial market is inherently volatile and presents both opportunities and challenges. Equipping yourself with comprehensive knowledge of technical analysis tools such as candlestick charts is essential for developing a successful trading and investing strategy.
While candlestick charts are highly effective for market analysis, mastering them requires consistent study, practice, and real-world application. Traders and investors are encouraged to continue learning and refining their skills to enhance their decision-making capabilities.
By combining candlestick chart analysis with other technical and fundamental analysis tools, you can develop a more robust approach to trading and investing. We encourage you to explore further, practice regularly, and adapt your strategies based on market conditions and your individual investment objectives.
FAQ
What is a candlestick chart? What do the four basic elements of a candlestick (opening price, closing price, highest price, lowest price) respectively represent?
A candlestick chart visualizes price movements over time. Opening price: the initial transaction price; closing price: the final transaction price; highest price: the peak price reached; lowest price: the lowest price reached during the period. The candlestick body shows open-close range, while wicks display high-low extremes.
How to distinguish between bullish and bearish candlesticks? What market meanings do they each represent?
Bullish candlesticks close higher than opening, showing upward momentum and buyer strength. Bearish candlesticks close lower than opening, indicating downward pressure and seller dominance. These patterns reflect market sentiment and price direction.
What are common candlestick patterns? What do hammer, hanging man, and doji stars indicate?
Hammer and hanging man have identical shapes with small bodies and long lower wicks. Hammers appear in downtrends signaling potential reversal upward, while hanging men in uptrends suggest potential downward reversal. Doji stars with cross-like shapes indicate market indecision and potential trend reversals.
What are candlestick bodies and wicks? How do wick lengths affect price trends?
Candlestick bodies represent open-close price ranges, while wicks show high-low extremes. Long wicks indicate price rejection at extremes, suggesting potential reversals. Short wicks signal strong buying/selling pressure and trend continuation.
How to identify market trend reversals through candlestick combination patterns such as engulfing patterns and island reversals?
Engulfing patterns occur when a larger candle completely covers the previous one, signaling potential reversal. Island reversals feature a gap separation between candles, indicating strong sentiment shift. Watch for high trading volume accompanying these patterns. Bearish engulfing after uptrends and bullish engulfing after downtrends confirm reversal signals. Island reversals with gaps suggest exhaustion of previous trend direction.
How to identify support and resistance levels in candlestick charts? What is their relationship with candlestick patterns?
Support levels are identified where prices repeatedly bounce upward; resistance levels where prices repeatedly decline. Both form at previous highs and lows. Candlestick patterns confirm these levels when they touch or break through them, with reversal patterns indicating level strength and continuation patterns suggesting further movement.
How should candlestick technical analysis be applied in actual trading? What other technical indicators should be combined?
Apply candlesticks with support/resistance levels, trend lines, and volume analysis. Combine with moving averages, RSI, and MACD for confirmation. Use candlestick patterns like engulfing and doji alongside these indicators to enhance accuracy and reduce false signals in your trading decisions.
* The information is not intended to be and does not constitute financial advice or any other recommendation of any sort offered or endorsed by Gate.