Learn to identify and trade the hammer candlestick pattern in cryptocurrencies. Complete guide on technical analysis, trading strategies, and bullish reversal signals to improve your operations in Web3.
What does the Hammer Pattern Look Like?
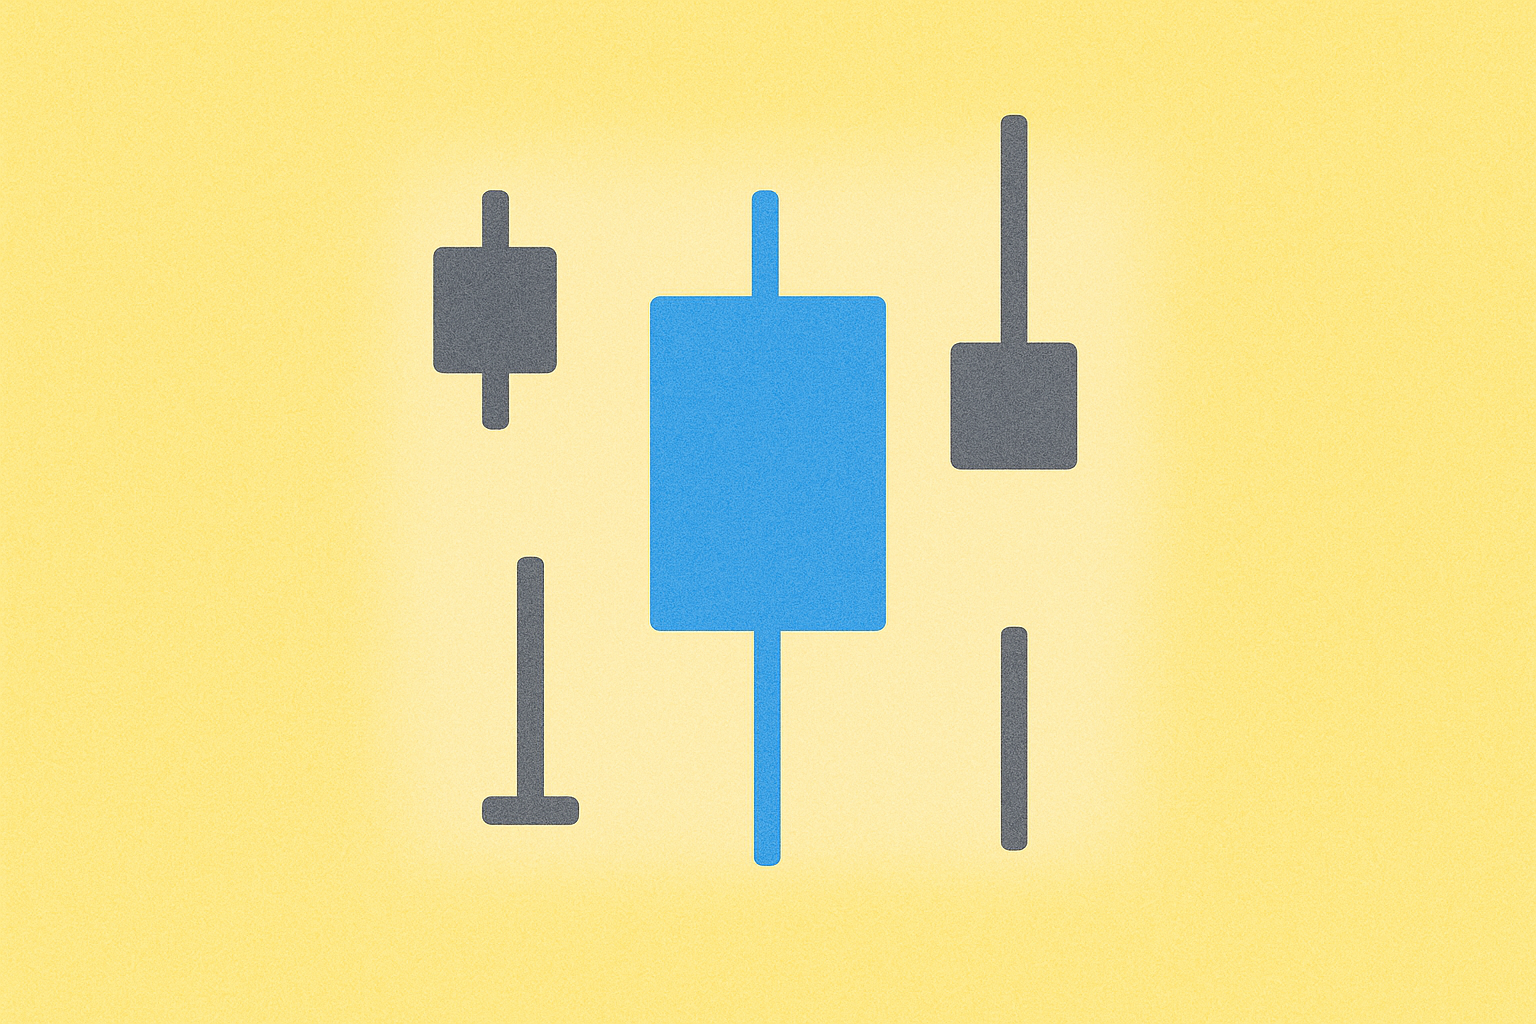
The hammer pattern is relatively easy to identify on a candlestick chart, making it an accessible tool for both beginner and experienced traders. It is characterized by a single candle with very distinctive visual features: a small body located at the top of the candle and a long lower wick that represents approximately two-thirds or more of the candle's total length.
The specific anatomy of the hammer pattern includes:
- A small body that can be green (bullish) or red (bearish)
- A long lower wick that should be at least twice the size of the body
- Little to no upper wick
- Typically appears after a downtrend
The success rate and reliability of the hammer candle mainly depend on the proportion between the length of the wick and the size of the body. A strong and reliable hammer pattern has a wick twice as long as the candle's body, although some traders look for even more pronounced proportions. Generally, the longer the wick in relation to the body, the stronger the potential reversal signal and the higher the probability that the trend change will materialize.
Are There Other Variants of the Hammer Candlestick?
Traditional hammer candles indicate bullish retracements and can appear in any financial market. However, there are several variants of the hammer pattern, each with unique characteristics and different implications for market analysis. Understanding these variations is essential for correctly interpreting market signals and making more informed trading decisions.
Some patterns are considered bullish, indicating potential upward price movements, while others are bearish, suggesting possible declines. Below is a detailed description of the main variants:
Hammer Candle
The classic hammer candle is a bullish reversal pattern that forms when the close is above the open, creating a green or white body. This pattern typically appears at the end of a downtrend and suggests that, despite intense selling pressure during the session (evidenced by the long lower wick), buyers managed to regain control and push the price higher before the close.
The formation of this pattern indicates a possible shift in market sentiment, where sellers are losing strength and buyers are beginning to dominate. It is a particularly strong signal when it appears at key support levels or after prolonged price declines.
Inverted Hammer Candle
The inverted hammer is another bullish signal but with a different visual structure. It forms when the open is below the close, but in this case, a long wick extends above the body rather than below.
This pattern suggests that during the trading session, there was intense buying pressure attempting to push the price significantly higher. However, sellers responded and managed to drive the price down before the candle could close at its highs. While this pattern is not as strongly bullish as the traditional hammer, it still indicates considerable buying influence and may precede an upward move, especially if confirmed by trading volume and other technical indicators.
Hanging Man Candle
The hanging man pattern indicates a bearish signal and visually resembles a bullish hammer candle but appears in a different context. It forms when the open is above the close, resulting in a red or black candle. This pattern typically appears at the end of an uptrend.
The long lower wick of this pattern indicates that the market experienced significant selling pressure during the session. Since the close is below the open, it suggests that sellers maintain control despite attempts by buyers to sustain higher prices. For this reason, the hanging man candle is considered a warning of a potential bearish reversal, especially when it appears after a prolonged rally.
Shooting Star Candle
The shooting star is a bearish pattern that visually resembles an inverted hammer but signals a downward reversal instead of an upward one. This pattern forms when the price tries to break higher with force, creating a long upper wick, but ultimately closes near its open or below it.
The formation of a shooting star indicates that buyers attempted to push the price significantly higher, but sellers responded strongly enough to reject those higher prices and bring the price back down near the open. This indicates rejection of higher prices and suggests an imminent bearish reversal, especially when it appears at important resistance levels or after extended bullish movements.
How to Trade the Hammer Pattern?
Traders who detect a hammer pattern can strategically use this knowledge to improve their trading outcomes. However, it is crucial to understand that, like any technical analysis tool, the hammer pattern should not be relied upon solely for trading decisions.
The hammer candle should serve as an initial signal prompting further market investigation. This additional analysis generally involves several steps:
- Confirmation with technical indicators: Consult other indicators such as moving averages, RSI,
MACD, or Bollinger Bands to confirm the hammer signal. For example, if a bullish hammer appears when the RSI is in oversold territory, the signal is considerably strengthened.
- Volume analysis: Check trading volume during the formation of the hammer. High volume during the formation of a bullish hammer suggests significant market participation and increases the reliability of the signal.
- Market context: Consider the overall market trend and support and resistance levels. A hammer appearing at a key support level is more likely to result in a successful reversal.
- Fundamental analysis: Investigate whether there are fundamental events, news, or developments that could have triggered the change in market sentiment. This is particularly important in the cryptocurrency market, where news can have a substantial impact on prices.
- Waiting for confirmation: Many experienced traders wait for the next candle to confirm the hammer signal before entering a position. For example, if a bullish hammer appears, they would wait for the following candle to close above the hammer's high.
Advantages and Limitations of the
Hammer Candle Pattern
Like any technical analysis tool, the hammer candlestick pattern has both advantages and limitations that traders must fully understand before incorporating it into their trading strategy.
Advantages
- Versatility across multiple markets: The hammer pattern shows a reliable price trend across all financial markets, including cryptocurrencies, stocks, forex, and commodities. This universality makes it a valuable tool for traders operating in different markets.
- Compatibility with other tools: The hammer pattern combines exceptionally well with other price action tools and technical indicators, allowing traders to build more robust and reliable trading strategies.
- Flexibility in interpretation: Market participants can use the hammer both as a trend reversal pattern and as a continuation pattern, depending on market context and other technical factors.
- Ease of identification: Hammer candles are relatively easy to visually identify on charts, making them accessible even for traders with limited technical analysis experience.
- Clear signal: The pattern provides a straightforward visual indication of the balance between buyers and sellers in the market.
Disadvantages
- Not 100% reliable: Like any technical indicator, the hammer pattern is not infallible and can generate false signals. The price might continue downward even after a bullish hammer appears, especially in highly volatile markets.
- Requires confirmation: Traders cannot rely solely on this indicator and should seek confirmation from other indicators and analysis before making decisions.
- Sensitivity to timeframes: The effectiveness of the pattern can vary significantly depending on the timeframe used. Patterns on longer timeframes tend to be more reliable.
- Market context: Correct interpretation of the pattern requires considering broader market conditions, which can be challenging for less experienced traders.
Why Remember the Hammer Candle Pattern?
The hammer candlestick pattern is an essential tool in any trader’s technical analysis arsenal. Despite its limitations, it provides valuable information about potential changes in market sentiment and the dynamics between buyers and sellers.
Its main drawback is the possibility of false signals. The appearance of a hammer candle suggests that a trend reversal is imminent, but various factors can interrupt this change, such as unexpected news, macroeconomic events, or simply the inherent volatility of the market. In the specific case of the cryptocurrency market, this volatility can be particularly pronounced.
However, the advantages of the hammer pattern are significant. Hammer candles are easy to spot visually and appear frequently on charts, offering multiple trading opportunities. Their visual simplicity does not compromise their utility, as when used correctly in conjunction with other tools, they can be a very effective indicator.
The most important thing to remember is the need for patience and discipline. Never act impulsively based solely on the appearance of a hammer pattern. Instead, you should:
- Wait for confirmation from other technical indicators
- Analyze the broader market context
- Consider trading volume
- Evaluate support and resistance levels
- Review relevant news or fundamental events
This methodical and cautious approach is especially crucial in cryptocurrency trading, where high volatility can lead to rapid and unpredictable price movements. Market participants should always stay attentive, maintain discipline in their trading strategy, and recognize that even the most promising signals require confirmation before making significant investment decisions.
By mastering the use of the hammer pattern and combining it with disciplined risk management and multi-faceted analysis, traders can significantly improve their ability to identify profitable trading opportunities and navigate the financial markets more successfully.
* The information is not intended to be and does not constitute financial advice or any other recommendation of any sort offered or endorsed by Gate.