Discover the hammer pattern in trading—learn what it is, how to spot it on charts, and how to trade with crypto strategies. This in-depth guide to candlestick analysis on Gate is designed for traders seeking technical precision.
Introduction to Candlestick Analysis in the Crypto Market
The crypto market is marked by extreme volatility and unpredictability, presenting both opportunities and risks for traders. Succeeding in such an environment requires mastery of technical analysis tools, with candlestick charts being especially important. These charts illustrate price movements over specific periods and help traders spot recurring patterns, known as candlestick patterns.
Candlestick analysis is relevant not just for cryptocurrencies but also for traditional financial markets such as equities, forex, and commodities. Reading candlestick charts is a core skill for any trader seeking to make well-informed decisions. One of the most widely recognized and impactful patterns is the "Hammer" candlestick, which often signals major shifts in market dynamics.
What Is the "Hammer" Candlestick Pattern?
The "Hammer" candlestick is a single-candle formation found across various financial markets and timeframes. This pattern is recognized for its ability to indicate a potential reversal of a downtrend.
The "Hammer" is considered a bullish signal, pointing to a possible start of upward price momentum. Its formation means that, despite strong selling pressure during the session, buyers managed to regain control before the candle closed.
It's essential to understand that the "Hammer" alone does not constitute a standalone trading signal. It should always be used alongside other technical analysis tools—such as support and resistance levels, trading volume, and trend indicators. Only a comprehensive approach increases forecast accuracy and reduces the risk of false signals.
Visual Characteristics of the "Hammer" Pattern
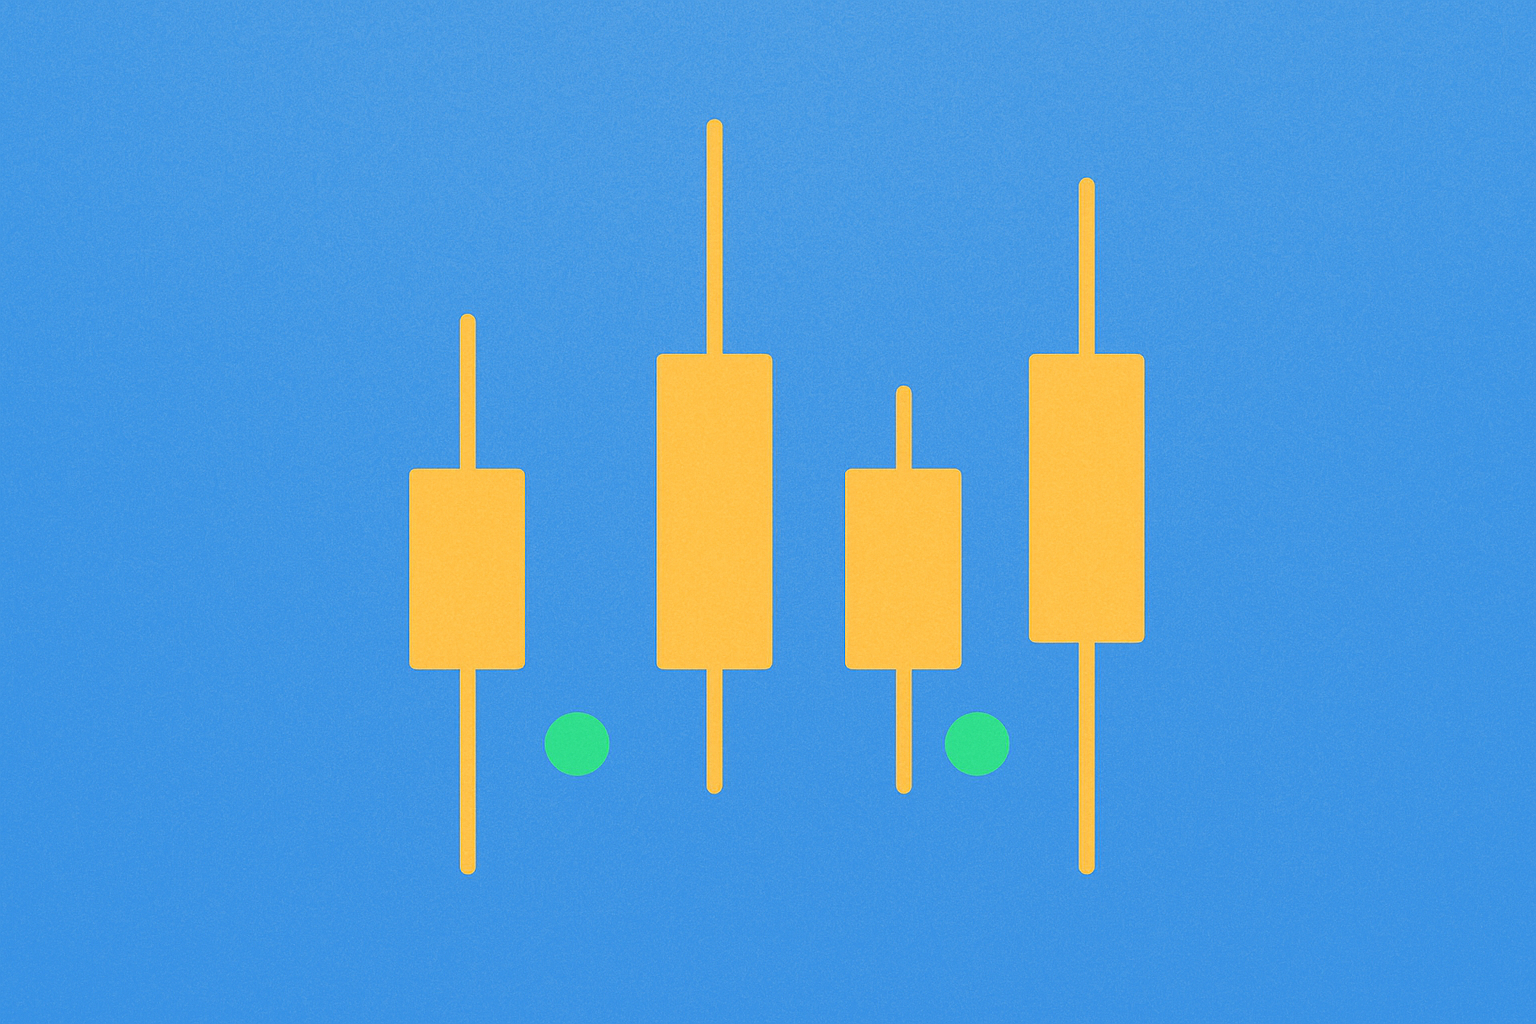
Spotting a "Hammer" candle on the chart is relatively easy thanks to its distinctive structure. The pattern consists of three key components: a small body, a long lower wick (shadow), and either no upper wick or a very short one.
The body represents the difference between the open and close prices. In a classic "Hammer," the body is compact, reflecting a small distance between these prices. The lower wick shows how far the price dropped during the session before buyers pushed it up to the close.
The strength of the "Hammer" signal depends on the ratio of the body to the wick. The most reliable patterns have a lower wick at least twice the size of the body. The longer the wick relative to the body, the greater the selling pressure and the stronger the buyers' response—boosting the odds of a reversal.
An ideal "Hammer" forms after a prolonged downtrend, appearing near a support level, which reinforces its significance as a reversal indicator.
Variations of the "Hammer" Candlestick Pattern
While the traditional "Hammer" is a bullish indicator, several variations exist, each with its own characteristics and trading implications. Understanding these differences is essential for accurate market interpretation.
Classic "Hammer" Candlestick
This is the standard version of the pattern and is generally viewed as the most reliable bullish signal. A classic "Hammer" forms when the closing price is higher than the opening, resulting in a green or white body, depending on the chart's color scheme.
This pattern reflects the following market behavior: at session start, sellers drive the price down to a new low. Buyers then step in with enough strength to not only halt the decline but to push the price above the opening. This signals a shift in sentiment and the exhaustion of bearish momentum.
"Inverted Hammer" Candlestick
The "Inverted Hammer" is essentially the reverse of the classic pattern. Here, the long wick is above the body, with little or no lower wick. The candle closes above its open, forming a bullish body.
This pattern occurs when buyers drive the price significantly higher during the session, but sellers push it back down. Despite this, the candle still closes above the open, reflecting ongoing buyer interest.
The "Inverted Hammer" is a weaker bullish indicator compared to the classic "Hammer" because sellers have shown they can counter upward moves. However, if confirmed by subsequent candles, it can also signal a reversal.
"Hanging Man" Candlestick
The "Hanging Man" looks visually identical to the classic "Hammer" but signals the opposite—a bearish reversal. The key difference is that the "Hanging Man" forms when the closing price is below the opening, creating a red or black body.
This pattern typically appears after an uptrend or at a price peak. The long lower wick signals an attempt to push prices down during the session. The candle closing below the open shows sellers retained control despite buyers' efforts to defend higher prices.
The "Hanging Man" warns of a possible end to an uptrend and the start of a correction or reversal, especially if it forms at elevated levels after a sustained rally.
"Shooting Star" Candlestick
The "Shooting Star" is the bearish counterpart to the "Inverted Hammer." It features a long upper wick and a red body at the lower end of the candle's range.
This pattern emerges when buyers attempt to continue an uptrend, pushing prices well above the open. Sellers then capitalize on higher prices to open shorts, causing the price to fall and close below the open.
The "Shooting Star" is especially noteworthy when it appears after a strong rally or near resistance. It signals that buyers are losing control and bears are gaining momentum.
Trading Strategies for the "Hammer" Pattern
Identifying a "Hammer" on the chart is only the first step toward making a trading decision. Professional traders never enter positions based solely on a single candlestick pattern, no matter how compelling it looks.
The first rule for trading with the "Hammer" is to wait for confirmation. Confirmation may come from the next candle closing above the "Hammer" high, indicating continued bullish momentum. Entering long before confirmation greatly increases the risk of a false signal.
It's also crucial to analyze the context of the pattern. The "Hammer" is most effective after a significant price decline, especially near established support. The pattern's appearance at such levels is more meaningful, as it aligns two independent technical factors.
To improve accuracy, use additional technical indicators. Moving averages help reveal trend direction and strength. Volume indicators show whether the "Hammer" formed on increased activity, which strengthens the signal. Oscillators like RSI or Stochastic can confirm oversold conditions.
Fundamental analysis is also important. The "Hammer" may coincide with positive news, regulatory changes, or other events that can trigger a reversal. Combining technical and fundamental analysis creates optimal trading conditions.
Advantages of the "Hammer" Candlestick Model
The "Hammer" pattern offers several key advantages, explaining its popularity among traders at all experience levels.
First, the "Hammer" is highly versatile. It functions well in all financial markets—from crypto to stocks and forex—and is reliable across multiple timeframes, from minutes for intraday trades to daily and weekly charts for swing and position trading.
Second, the "Hammer" integrates seamlessly with other technical analysis tools. It works effectively with Fibonacci levels, trend lines, channels, volume, and momentum indicators. This compatibility enables complex trading systems with high-precision signals.
Third, the pattern is flexible in interpretation. Traders can use the "Hammer" to pinpoint reversals or confirm trend continuation after corrections, making it valuable in diverse market conditions.
Fourth, the "Hammer" is visually simple, allowing even beginners to spot it easily. Its characteristic form—a long lower wick with a small body—stands out, reducing the risk of missing key signals.
Limitations of the "Hammer" Candlestick Model
Despite its many strengths, the "Hammer" pattern has important limitations every trader should consider.
The primary drawback is that it is not foolproof. The "Hammer" can produce false signals, with prices continuing in the original direction. This is especially common in volatile markets like crypto, where sharp moves may create unconfirmed patterns.
The second limitation is the need for context. Using the "Hammer" in isolation—without considering the broader market environment, support and resistance, and volume—can lead to poor decisions. Traders must always assess where the pattern forms and what factors may affect future price action.
The third limitation is subjectivity. Traders may disagree on whether a candle qualifies as a "Hammer," with questions about minimum wick length, body size, and upper wick allowance leading to different interpretations.
Additionally, the "Hammer" doesn't indicate the potential size or duration of the subsequent move. It only signals a possible reversal, offering no specific guidance on profit targets or stop-loss placement.
Why Learn the "Hammer" Candlestick Pattern?
The "Hammer" is a vital technical analysis tool that belongs in every trader's arsenal. Despite its limitations—including the risk of false signals—it remains one of the most reliable indicators of potential trend reversals.
The main advantage of the "Hammer" is its ease of recognition and frequent appearance, providing traders with regular opportunities across markets and timeframes. However, it's critical to confirm the signal using other technical indicators and fundamental analysis.
Extra caution is warranted in the crypto market. The high volatility of digital assets brings both extra opportunities and higher risks. A "Hammer" on a crypto chart may result from short-term speculation with no fundamental basis.
To use the "Hammer" pattern successfully, traders need discipline: wait for confirmation, apply risk management, use protective stop-losses, and set realistic profit goals. Only a comprehensive strategy—combining candlestick analysis with other forms of technical and fundamental analysis—enables consistent profits in financial markets.
Learning the "Hammer" and its variations is an investment in your trading skills, paying off through better decisions and improved results over time.
FAQ
What is a "Hammer" candlestick and how does it appear on a chart?
A Hammer is a reversal candle with a small body and a long lower shadow. On the chart, it looks like a small candle with a long wick extending downward, signaling a possible reversal and support at lower price levels.
How do you accurately identify a "Hammer" pattern on a price chart?
The "Hammer" pattern is recognized by a small body at the top of the range, a lower wick at least twice the length of the body, and a short or absent upper wick. It forms after a price decline and signals a potential bullish reversal.
What trading signals does the "Hammer" candlestick give and how should they be used?
The "Hammer" candlestick gives a bullish signal, pointing to price gains. It is used to enter long positions when formed at support, with a small body and long lower wick. Confirmation comes from increased trading volume and a close above the opening level.
How does the "Hammer" differ from the "Inverted Hammer" candlestick?
The Hammer has a long lower shadow and narrow body, while the Inverted Hammer has a long upper shadow and narrow body. Their wick directions are opposite, and they signal different types of reversals.
How reliable is the "Hammer" candlestick as an entry signal?
The "Hammer" candlestick provides a reliable reversal signal when its lower shadow pierces support. This suggests weakening sellers and a possible price increase. Additional indicators are recommended for confirmation.
Which timeframes are best for trading "Hammer" signals?
The best timeframes for trading "Hammer" signals are the hourly (H1) and daily (D1) charts. Higher timeframes provide more reliable and impactful signals for profitable trading.
Which additional indicators should be used to confirm a "Hammer" signal?
To confirm a "Hammer" signal, use increased volume on the same candle, the RSI indicator to assess oversold conditions, and moving averages to determine the main trend direction.
* The information is not intended to be and does not constitute financial advice or any other recommendation of any sort offered or endorsed by Gate.