Discover the hammer pattern in cryptocurrency technical analysis. This in-depth guide covers the hammer candlestick pattern, key indicators of trend reversals, trading on Gate, and effective risk management. Learn how to trade the hammer, including identifying signals, confirming trends, and employing strategies tailored for intermediate traders.
Introduction to Candlestick Analysis in the Cryptocurrency Market
The cryptocurrency market is highly volatile and unpredictable, presenting both opportunities and risks for traders. Success requires proficiency in technical analysis tools, and candlestick charts play a crucial role. These charts visually display price movements over specific periods, enabling traders to identify key market patterns.
Candlestick analysis applies not only to cryptocurrencies but also to traditional financial markets such as equities, forex, and commodities. The ability to interpret candlestick patterns is a foundational skill for any trader targeting long-term success. Among the many candlestick formations, the Hammer pattern stands out as one of the most reliable signals of a trend reversal.
The Hammer candlestick pattern is a single-candle formation that can occur across various financial markets. Traders widely recognize this pattern for its effectiveness in predicting bullish trend reversals. The Hammer forms at the end of a downtrend and signals a potential shift from bearish to bullish market sentiment.
The Hammer reflects market psychology at moments of fierce competition between buyers and sellers. A long lower wick indicates sellers pushed the price sharply lower during the session, but buyers regained control and closed the candle near or above the opening price. This action demonstrates buyers’ strength and their willingness to defend lower price levels.
It is important to note that the Hammer alone is not a sufficient trading signal. Use it alongside other technical analysis tools, such as support and resistance levels, volume indicators, and moving averages. A comprehensive approach increases the probability of successful trades and helps reduce the risk of false signals.
What the Hammer Pattern Looks Like
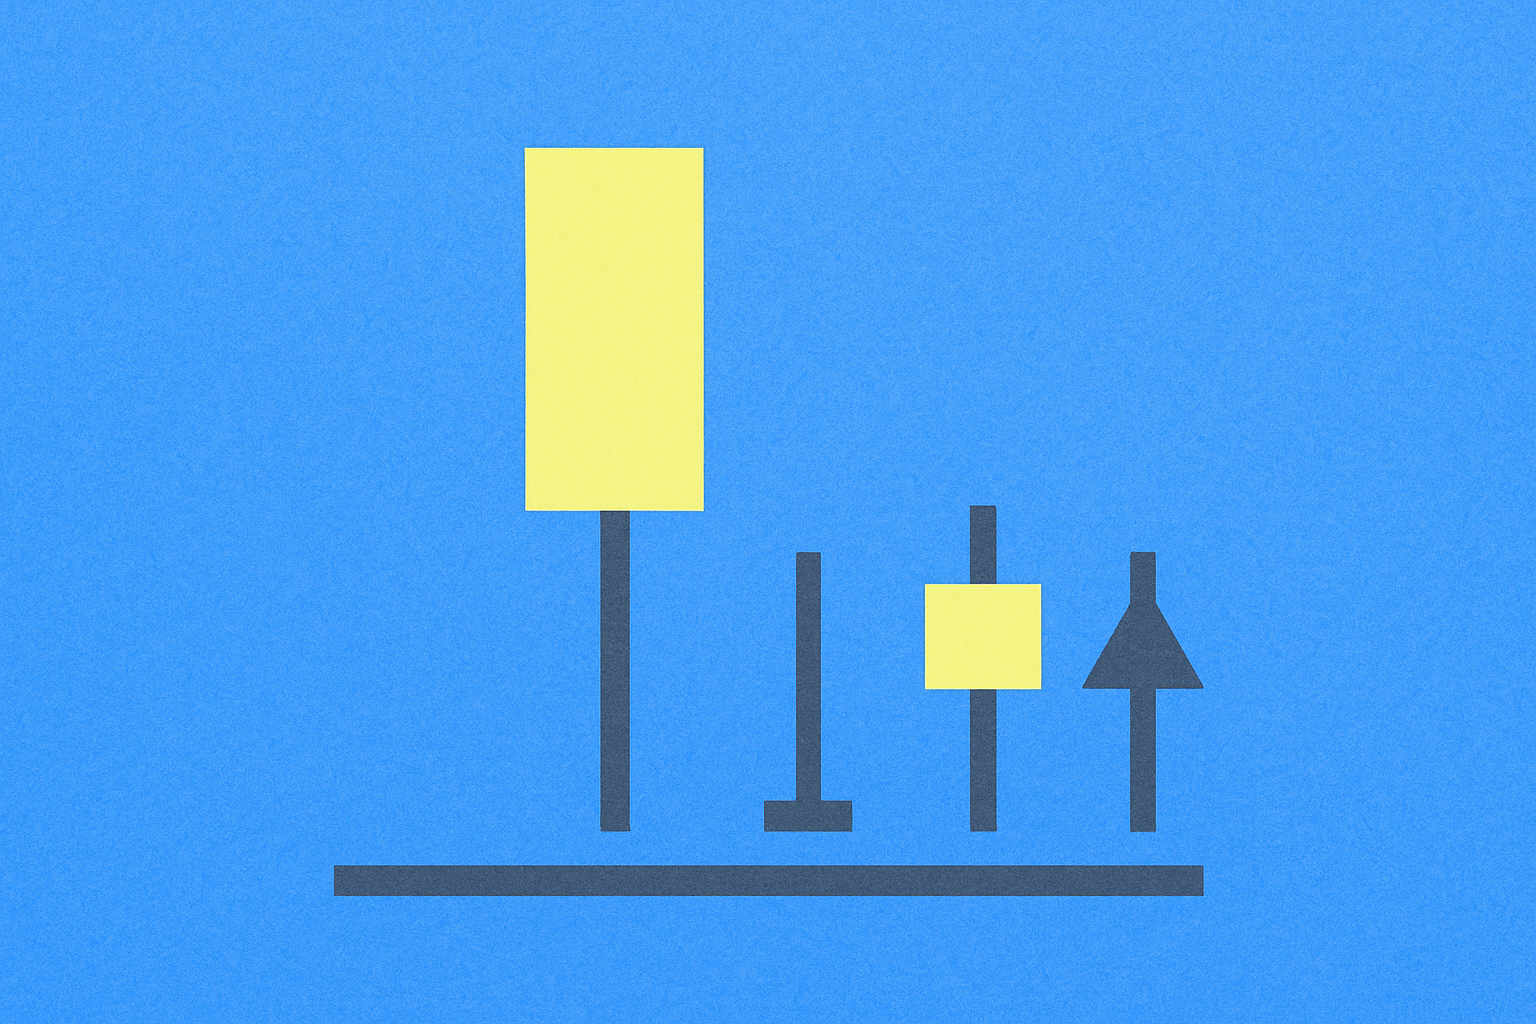
Even beginner traders can easily spot the Hammer pattern. The classic Hammer has a distinct structure: a small body positioned at the top of the candle and a long lower wick (shadow) at least twice the length of the body.
The body may be green (white) or red (black), but a green body is viewed as a stronger bullish signal. The upper wick is either absent or very short. An ideal Hammer features a lower wick two to three times the body’s length. The longer the lower wick relative to the body, the stronger the reversal signal.
For example, a candle with a body of 10 points and a lower wick of 30 points indicates robust buying pressure. This proportion shows that sellers attempted to drive the price down but met strong resistance from buyers, who not only halted the decline but also pushed the price back up to the opening level.
Other Types of Hammer Candles
The Hammer family includes several variations, each with unique characteristics and interpretations. Understanding these differences is critical for accurately reading market conditions.
Hammer Candle
The classic Hammer is a bullish reversal pattern. It forms when the closing price exceeds the opening price, creating a green (white) body. This pattern appears after a downtrend and signals that, despite strong early selling pressure, buyers regained control and closed the session in positive territory.
This pattern shows weakening bearish momentum and strengthening bullish forces. Traders view this as a possible entry point for long positions, especially when confirmed by increased trading volume.
Inverted Hammer Candle
The Inverted Hammer is the mirror image of the classic Hammer. In this case, the long wick sits above the candle body, and the lower wick is either absent or very short. The opening price is below the closing price, resulting in a green body.
This pattern is also bullish, though its interpretation differs. The Inverted Hammer shows that buyers attempted a sharp upward move but met resistance from sellers, who pushed the price down. However, closing above the opening price means buyers kept control. This pattern often precedes significant bullish moves, but further confirmation is needed.
Hanging Man Candle
The Hanging Man is visually identical to the classic Hammer but with the opposite implication. The key distinction is that the Hanging Man forms at the end of an uptrend, not a downtrend. The candle body is typically red (black), indicating a close below the opening price.
In this context, the long lower wick signals that sellers are becoming more active and attempting to reverse the market downward. While buyers partly recovered the price, closing below the opening indicates growing bearish sentiment. The Hanging Man serves as a warning of a potential end to the bullish trend and warrants special attention from traders with long positions.
Shooting Star Candle
The Shooting Star is the bearish counterpart to the Inverted Hammer. It forms at the end of an uptrend, featuring a long upper wick and a small red body at the bottom of the candle.
The appearance of a Shooting Star means buyers tried to extend the uptrend but faced strong resistance from sellers. As a result, the price was pushed down, and the candle closed well below its high and under the opening price. This is a classic signal of a trend reversal from bullish to bearish. Traders often treat this pattern as a cue to lock in profits on long positions or initiate short positions.
To trade effectively with the Hammer pattern, follow a systematic approach and adhere to set rules. The first step is accurate pattern identification on the chart. It is essential to ensure
FAQ
What is a Hammer candle and what are its characteristics?
A Hammer candle features a small body and a long lower wick. It forms when price rebounds from lows. Key characteristics: closes near its high, a lower wick two to three times the body’s size, and a minimal upper wick. The pattern signals a possible upward trend reversal.
How do you identify and confirm a true Hammer? What conditions must be met?
A Hammer requires three conditions: a small candle body at the top, a long lower wick (at least twice the body’s length), and a minimal upper wick. Trading volume should be above average, and the close should be above the midpoint of the candle’s range. This formation signals a potential upward trend reversal after a decline.
Hammer candle: how do you trade after it appears and what are the buy signals?
The Hammer forms at the bottom of a trend with a long lower wick. Buy on confirmation with the next candle closing above the Hammer’s close. Rising volume and a breakout above reinforce the signal. This is a reversal signal to the upside. Set your stop-loss below the lower wick for protection.
Does the reliability of the Hammer pattern differ across timeframes?
Yes, the Hammer’s reliability depends on the timeframe. On higher timeframes (D, W, M), signals are more reliable due to larger trading volume and less market noise. On lower timeframes (H1, M15), patterns appear more often but are less consistent. The optimal use of the Hammer is on daily and higher charts.
How does the Hammer differ from the Hanging Man?
The Hammer forms at the bottom of a downtrend and signals a possible upward reversal, while the Hanging Man appears at the top of an uptrend and warns of a potential decline. Both have a long lower wick, but their meaning depends on the trend’s context and chart position.
How do you use the Hammer with other technical indicators in trading?
Combine the Hammer with support levels and RSI. When a Hammer appears at a support level and RSI indicates oversold conditions, it is a buy signal. Confirm with above-average volume for a stronger entry.
How do you set risk management and stop-loss levels for the Hammer?
Set your stop-loss 1–2% below the Hammer’s lower shadow. Place your take-profit at the resistance level above the Hammer. Limit position size to no more than 2% of your capital. Maintain a minimum risk-reward ratio of 1:2. Confirm the entry with trading volume before acting.
* The information is not intended to be and does not constitute financial advice or any other recommendation of any sort offered or endorsed by Gate.