This comprehensive guide compares HBAR and KAVA, two distinct blockchain platforms with different market positioning and investment potential. HBAR, leveraging hashgraph consensus technology, serves enterprise applications with 10,000+ TPS and institutional governance backing from Google, IBM, and Boeing, currently ranked 30th with $4.97B market cap. KAVA specializes in cross-chain DeFi infrastructure for collateralized lending and stablecoins, ranked 369th with $91.75M market cap. The article analyzes both assets across historical price trends (HBAR down 79.6% from peak, KAVA down 99.1%), tokenomics differences, institutional adoption, and technical ecosystems. Investment strategies vary by investor profile—conservative investors may favor HBAR's 60% allocation for stability, while aggressive investors might allocate 55% to KAVA for DeFi growth exposure. Long-term forecasts through 2031 provide scenario-based price projections and risk management frameworks for decision-making on Gate exchange.
Introduction: Investment Comparison Between HBAR and KAVA
In the cryptocurrency market, the comparison between HBAR vs KAVA has become a topic of interest for investors. These two assets differ significantly in market cap ranking, application scenarios, and price performance, representing distinct positioning within the crypto ecosystem.
HBAR (Hedera): Launched in 2019, it has gained market recognition through its hashgraph consensus mechanism, offering fast transaction speeds (>10,000+ TPS), security (aBFT), and fairness in transaction recording. As of January 13, 2026, HBAR ranks 30th with a market cap of approximately $4.97 billion and a circulating supply of 42.79 billion tokens.
KAVA (Kava): Introduced in 2019 as a cross-chain decentralized finance platform, it provides collateralized lending and stablecoin services for mainstream digital assets. Currently ranked 369th with a market cap of around $91.75 million and a circulating supply of 1.08 billion tokens.
This article will analyze HBAR vs KAVA across multiple dimensions including historical price trends, supply mechanisms, institutional adoption, technical ecosystems, and future projections to provide a comprehensive investment value comparison. We aim to address the question investors care about most:
"Which is the better buy right now?"
I. Historical Price Comparison and Current Market Status
HBAR (Hedera) and KAVA (Kava) Historical Price Trends
- 2021: HBAR experienced notable price activity, with its price reaching an all-time high of $0.569229 on September 15, 2021.
- 2020: KAVA recorded its historical low of $0.071579 on January 2, 2020, while also reaching an all-time high of $9.12 on August 30, 2021.
- Comparative Analysis: During the market cycle from 2021 to present, HBAR declined from its peak of $0.569229 to its current level, representing a decrease of approximately 79.6%, while KAVA experienced a more substantial decline from $9.12 to current levels, reflecting a decrease of approximately 99.1%.
Current Market Status (2026-01-13)
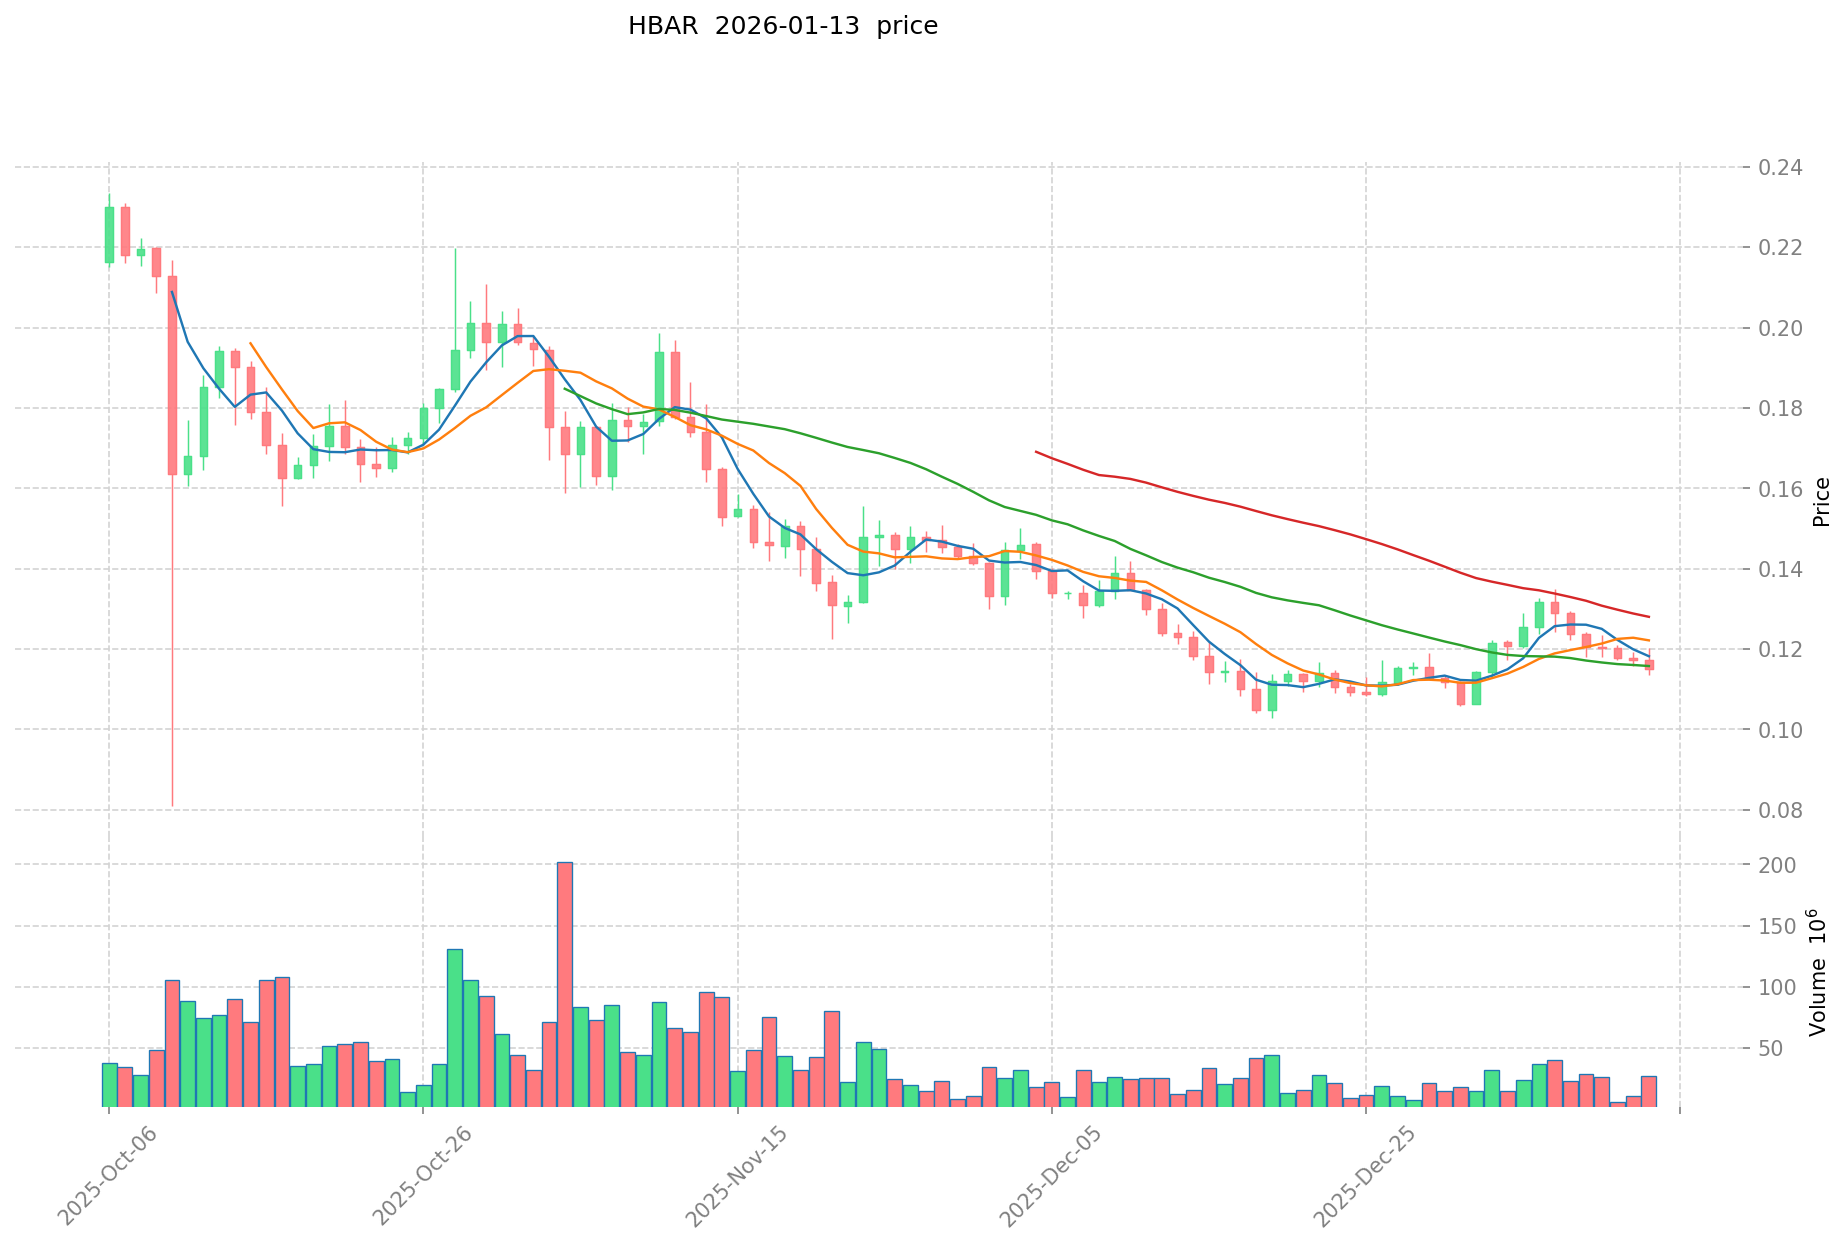
- HBAR Current Price: $0.11617
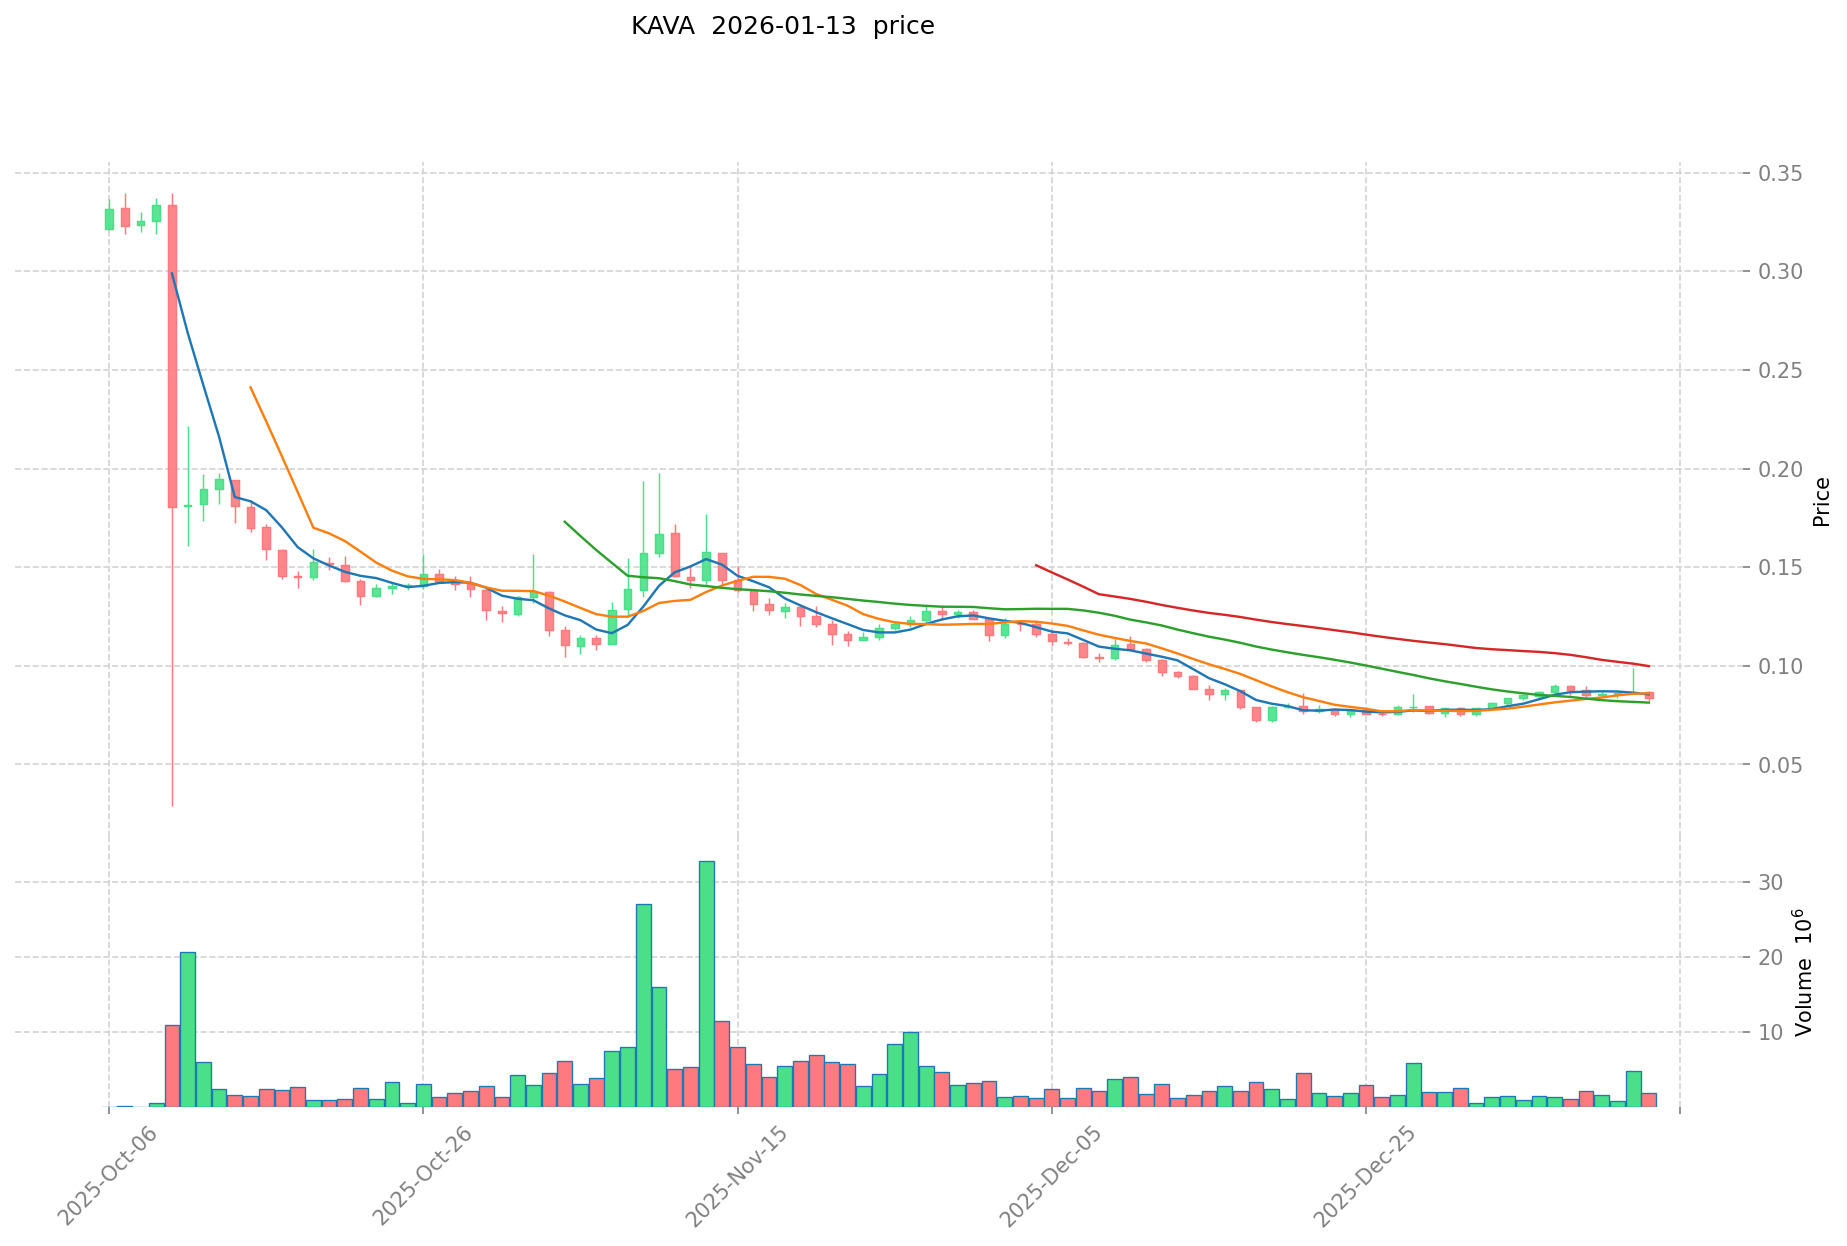
- KAVA Current Price: $0.08473
- 24-Hour Trading Volume: HBAR recorded $267.39 million compared to KAVA's $20.52 million
- Market Sentiment Index (Fear & Greed Index): 26 (Fear)
View real-time prices:
II. Core Factors Influencing HBAR vs KAVA Investment Value
Supply Mechanism Comparison (Tokenomics)
- HBAR: Operates with a fixed maximum supply of 50 billion tokens, with distribution managed through a controlled release schedule by the Hedera Governing Council. The supply model emphasizes long-term stability rather than aggressive deflation.
- KAVA: Features a hybrid supply mechanism with inflationary staking rewards balanced by deflationary token burning from platform fees, creating a dynamic equilibrium dependent on network activity.
- 📌 Historical Pattern: Supply mechanisms influence price cycles through scarcity dynamics - fixed supply models tend to support gradual appreciation during adoption phases, while inflationary models may face pressure without corresponding demand growth.
Institutional Adoption and Market Application
- Institutional Holdings: HBAR has attracted notable institutional interest through its governance model, which includes major enterprises like Google, IBM, and Boeing on its governing council. KAVA's institutional adoption remains more limited to DeFi-focused participants.
- Enterprise Adoption: HBAR demonstrates use cases in enterprise-grade applications including supply chain tracking and tokenization services. KAVA focuses primarily on cross-chain DeFi applications and lending protocols.
- National Policies: Both assets face varying regulatory approaches across jurisdictions, with HBAR potentially benefiting from its enterprise governance structure in compliance-focused markets.
Technology Development and Ecosystem Construction
- HBAR Technology Upgrades: The network emphasizes high throughput (up to 10,000+ transactions per second) with low transaction costs and finality times under 5 seconds, supported by its hashgraph consensus mechanism.
- KAVA Technology Development: Focuses on cross-chain interoperability and DeFi infrastructure, enabling asset bridging and lending across multiple blockchain networks.
- Ecosystem Comparison: HBAR's ecosystem centers on Hedera Network Services supporting decentralized applications with enterprise requirements. The network hosts platforms like SaucerSwap for DEX functionality and various tokenization projects. KAVA's ecosystem emphasizes DeFi protocols with lending, staking, and yield generation as primary use cases. Both networks show distinct positioning - HBAR toward enterprise applications and KAVA toward DeFi infrastructure.
Macroeconomic Environment and Market Cycles
- Performance Under Inflation: Neither asset has established clear anti-inflation characteristics comparable to traditional stores of value, as both remain subject to broader cryptocurrency market volatility.
- Macroeconomic Monetary Policy: Interest rate adjustments and dollar index movements typically affect both assets through their impact on overall cryptocurrency market sentiment and capital flows.
- Geopolitical Factors: Cross-border transaction demand and international developments influence adoption patterns, though specific impacts vary based on each network's primary use cases and geographic adoption patterns.
III. 2026-2031 Price Forecast: HBAR vs KAVA
Short-term Forecast (2026)
- HBAR: Conservative $0.1080-$0.1162 | Optimistic $0.1162-$0.1510
- KAVA: Conservative $0.0492-$0.0848 | Optimistic $0.0848-$0.0958
Mid-term Forecast (2028-2029)
- HBAR may enter a consolidation phase with projected price range of $0.1145-$0.1701
- KAVA may enter a gradual growth phase with projected price range of $0.0683-$0.1325
- Key drivers: institutional capital inflows, ETF developments, ecosystem expansion
Long-term Forecast (2030-2031)
- HBAR: Baseline scenario $0.0914-$0.1727 | Optimistic scenario $0.1597-$0.1852
- KAVA: Baseline scenario $0.0904-$0.1413 | Optimistic scenario $0.1153-$0.1936
View detailed price forecasts for HBAR and KAVA
Disclaimer
HBAR:
| Year |
Predicted High Price |
Predicted Average Price |
Predicted Low Price |
Price Change |
| 2026 |
0.151034 |
0.11618 |
0.1080474 |
0 |
| 2027 |
0.13895128 |
0.133607 |
0.10154132 |
15 |
| 2028 |
0.1621721766 |
0.13627914 |
0.1144744776 |
17 |
| 2029 |
0.170117250462 |
0.1492256583 |
0.080581855482 |
28 |
| 2030 |
0.18521888708196 |
0.159671454381 |
0.11656016169813 |
37 |
| 2031 |
0.184516332682683 |
0.17244517073148 |
0.091395940487684 |
48 |
KAVA:
| Year |
Predicted High Price |
Predicted Average Price |
Predicted Low Price |
Price Change |
| 2026 |
0.0958466 |
0.08482 |
0.0491956 |
0 |
| 2027 |
0.09936663 |
0.0903333 |
0.064136643 |
6 |
| 2028 |
0.10148946255 |
0.094849965 |
0.0682919748 |
11 |
| 2029 |
0.13252911359625 |
0.098169713775 |
0.0883527423975 |
15 |
| 2030 |
0.167256649844156 |
0.115349413685625 |
0.108428448864487 |
36 |
| 2031 |
0.1935851535179 |
0.14130303176489 |
0.090433940329529 |
66 |
IV. Investment Strategy Comparison: HBAR vs KAVA
Long-term vs Short-term Investment Strategies
- HBAR: Suitable for investors focusing on enterprise adoption and institutional-grade infrastructure. The asset may appeal to those seeking exposure to hashgraph technology with established governance frameworks and enterprise partnerships.
- KAVA: Suitable for investors interested in cross-chain DeFi infrastructure and yield generation opportunities. The platform may attract participants seeking exposure to lending protocols and multi-chain interoperability.
Risk Management and Asset Allocation
- Conservative Investors: HBAR 60% vs KAVA 40% - emphasizing the relatively larger market capitalization and institutional backing of HBAR while maintaining moderate exposure to KAVA's DeFi positioning.
- Aggressive Investors: HBAR 45% vs KAVA 55% - balancing higher-risk exposure to KAVA's growth potential within DeFi sectors against HBAR's enterprise-focused development.
- Hedging Tools: Stablecoin allocation for liquidity management, options strategies for downside protection, and cross-asset portfolio diversification to mitigate concentrated exposure.
V. Potential Risk Comparison
Market Risks
- HBAR: Subject to broader cryptocurrency market volatility, with price movements influenced by institutional adoption rates and enterprise implementation timelines. Trading volume concentration and liquidity variations across exchanges may impact execution during market stress.
- KAVA: Faces volatility associated with DeFi sector sentiment and cross-chain protocol competition. Lower market capitalization relative to HBAR suggests potentially higher price sensitivity to market movements and capital flows.
Technical Risks
- HBAR: Network scalability considerations related to enterprise adoption velocity, dependency on governing council coordination for protocol updates, and potential challenges in maintaining decentralization while serving enterprise requirements.
- KAVA: Cross-chain bridge security considerations, smart contract vulnerabilities inherent to DeFi protocols, and technical complexity associated with multi-chain interoperability maintenance.
Regulatory Risks
- Global regulatory developments affect both assets differently based on their positioning. HBAR's enterprise governance structure and institutional council members may provide certain regulatory navigation advantages in compliance-focused jurisdictions. KAVA's DeFi-centric model faces evolving regulatory frameworks around decentralized lending and cross-chain asset transfers, with varying approaches across different regulatory environments.
VI. Conclusion: Which Is the Better Buy?
📌 Investment Value Summary:
- HBAR Advantages: Established institutional governance framework, demonstrated enterprise partnerships, higher market capitalization providing relative liquidity advantages, and hashgraph consensus technology offering differentiated technical positioning.
- KAVA Advantages: Cross-chain DeFi infrastructure positioning, yield generation mechanisms through lending protocols, and potential growth exposure within decentralized finance sectors.
✅ Investment Recommendations:
- Beginner Investors: Consider starting with HBAR due to its relatively larger market capitalization, institutional backing, and enterprise-focused positioning. Allocate smaller portions to KAVA for diversified exposure while maintaining awareness of higher volatility characteristics.
- Experienced Investors: Evaluate portfolio allocation based on risk tolerance and sector preferences. HBAR may serve as a core holding for enterprise blockchain exposure, while KAVA can provide tactical exposure to DeFi infrastructure development. Consider rebalancing strategies aligned with market cycle positioning.
- Institutional Investors: Assess HBAR's governance structure and enterprise adoption trajectory for potential strategic allocation. Evaluate KAVA's DeFi positioning within broader digital asset portfolio construction, considering liquidity requirements and risk management frameworks.
⚠️ Risk Disclosure: The cryptocurrency market exhibits substantial volatility. This analysis does not constitute investment advice. Investors should conduct independent research and consider personal financial circumstances before making investment decisions.
VII. FAQ
Q1: What are the main technical differences between HBAR and KAVA?
HBAR utilizes hashgraph consensus mechanism offering 10,000+ TPS with aBFT security and sub-5-second finality, while KAVA operates as a cross-chain DeFi platform focusing on interoperability and lending protocols. HBAR's architecture emphasizes enterprise-grade throughput and deterministic transaction ordering through its directed acyclic graph structure, making it suitable for applications requiring high-volume, low-latency processing. KAVA's technical design prioritizes cross-chain asset bridging and smart contract functionality for decentralized finance applications, enabling collateralized lending and stablecoin mechanisms across multiple blockchain networks. The fundamental distinction lies in HBAR's consensus innovation versus KAVA's interoperability focus.
Q2: Which asset has stronger institutional backing?
HBAR demonstrates significantly stronger institutional adoption through its Hedera Governing Council, which includes major enterprises like Google, IBM, and Boeing, whereas KAVA's institutional participation remains limited primarily to DeFi-focused entities. The governing council structure provides HBAR with strategic partnerships and potential enterprise use case development, offering governance stability through established corporate participation. KAVA's institutional landscape centers on decentralized finance protocols and lending platform participants rather than traditional enterprise involvement. This distinction reflects HBAR's positioning toward enterprise blockchain applications versus KAVA's focus on decentralized financial infrastructure.
Q3: How do the supply mechanisms differ between HBAR and KAVA?
HBAR operates with a fixed maximum supply of 50 billion tokens managed through controlled release by the Hedera Governing Council, while KAVA employs a hybrid model combining inflationary staking rewards with deflationary fee burning. HBAR's supply schedule emphasizes long-term predictability without aggressive deflation, with distribution controlled by governance rather than algorithmic mechanisms. KAVA's dynamic supply model creates equilibrium dependent on network activity—staking rewards increase circulating supply while platform fees burn tokens, resulting in supply adjustments based on protocol usage. The fixed supply approach of HBAR contrasts with KAVA's activity-responsive tokenomics.
Q4: What are the primary use cases for each network?
HBAR focuses on enterprise applications including supply chain tracking, tokenization services, and decentralized applications requiring high throughput with low costs, while KAVA concentrates on cross-chain lending, collateralized borrowing, and yield generation within DeFi ecosystems. HBAR's network services support enterprise requirements for transparent, tamper-proof data recording and asset management across industries. KAVA enables users to leverage cryptocurrency holdings for borrowing, provide liquidity for interest generation, and access stablecoin minting through collateralization. The distinction reflects HBAR's enterprise infrastructure positioning versus KAVA's decentralized finance functionality.
Q5: How have HBAR and KAVA performed during the recent market cycle?
HBAR declined approximately 79.6% from its September 2021 peak of $0.569229 to current levels, while KAVA experienced a more substantial decline of approximately 99.1% from its August 2021 high of $9.12. HBAR's relatively smaller decline reflects its larger market capitalization, institutional backing, and enterprise positioning providing certain stability factors. KAVA's more significant drawdown aligns with challenges faced by DeFi protocols during market contractions, including reduced lending activity and liquidity provision. Current 24-hour trading volume shows HBAR at $267.39 million compared to KAVA's $20.52 million, indicating substantial liquidity differences between the assets.
Q6: What portfolio allocation makes sense for different investor profiles?
Conservative investors may consider 60% HBAR and 40% KAVA, emphasizing HBAR's larger market capitalization and institutional framework while maintaining moderate DeFi exposure through KAVA. Aggressive investors might adjust to 45% HBAR and 55% KAVA, increasing exposure to KAVA's potential growth within decentralized finance sectors. Beginner investors should prioritize HBAR due to its relative stability, institutional backing, and enterprise positioning, allocating smaller portions to KAVA while building market understanding. Experienced investors can optimize allocation based on sector preferences—HBAR for enterprise blockchain exposure and KAVA for tactical DeFi positioning—with rebalancing strategies aligned to market cycle dynamics.
Q7: What are the key regulatory considerations for HBAR versus KAVA?
HBAR's enterprise governance structure and institutional council members may provide advantages in compliance-focused jurisdictions, as its framework aligns with traditional corporate governance models. The network's emphasis on enterprise applications and established institutional partnerships could facilitate regulatory navigation in markets prioritizing transparency and accountability. KAVA faces evolving regulatory frameworks surrounding decentralized lending, cross-chain asset transfers, and DeFi protocols, with varying approaches across different jurisdictions. Both assets remain subject to cryptocurrency market regulations, but their distinct positioning—enterprise infrastructure versus decentralized finance—results in different regulatory exposure profiles and compliance considerations.
Q8: What are the projected price ranges for HBAR and KAVA through 2031?
Short-term 2026 forecasts suggest HBAR ranging from $0.1080-$0.1510 and KAVA from $0.0492-$0.0958 under various scenarios. Mid-term projections for 2028-2029 indicate HBAR consolidating between $0.1145-$0.1701 while KAVA may range from $0.0683-$0.1325. Long-term 2030-2031 baseline scenarios project HBAR at $0.0914-$0.1727 and KAVA at $0.0904-$0.1413, with optimistic cases reaching $0.1597-$0.1852 for HBAR and $0.1153-$0.1936 for KAVA. These projections depend on institutional adoption, ecosystem expansion, and macroeconomic conditions. However, cryptocurrency markets exhibit substantial volatility, and actual outcomes may vary significantly from forecasts based on evolving market dynamics and technological developments.
* The information is not intended to be and does not constitute financial advice or any other recommendation of any sort offered or endorsed by Gate.