This comprehensive analysis compares HIGH and AAVE as DeFi lending and gaming-focused investment options. HIGH, a metaverse gaming token launched in 2021, currently trades at $0.2168 with a market cap of $16.99 million, while AAVE, an established decentralized lending protocol, trades at $157.23 with $2.39 billion market cap. The article examines historical price trends, tokenomics, market performance, and liquidity metrics, revealing AAVE maintains 89 times higher trading volume and superior market resilience. It provides 2026-2031 price forecasts, investment strategies tailored to investor profiles, and detailed risk assessments. AAVE suits conservative investors seeking established DeFi infrastructure exposure, while HIGH appeals to experienced investors pursuing metaverse sector diversification. The analysis includes allocation recommendations, regulatory considerations, and FAQ guidance to help investors make informed decisions based on risk tolerance and investment horizons.
Introduction: HIGH Investment Value, Price Prediction, and Risk Analysis
In the crypto asset market, Highstreet (HIGH) represents a unique intersection of metaverse gaming, NFT commerce, and decentralized governance. Since its launch in October 2021, HIGH has evolved from its initial offering price to become a functional token within an open-world MMORPG ecosystem that blends traditional and crypto brand integration.
Highstreet (HIGH): Launched in 2021, this token serves as the native utility and governance asset for a metaverse platform combining shopping, gaming, and NFT experiences. HIGH facilitates in-game progression, special item purchases, and community governance through on-chain proposals.
Key Features: The platform encompasses multiple components including the Highstreet Marketplace for NFT trading, the Forever Fomo Duck Squad as official mascot NFTs with staking benefits, and cross-platform gameplay supporting VR, PC, and mobile experiences.
This article will examine HIGH's market performance, tokenomics structure, ecosystem development, and future outlook, addressing critical questions for investors:
"What factors influence HIGH's investment value and price trajectory?"
"How do supply dynamics and market positioning affect long-term potential?"
"What risks should be considered when evaluating HIGH as an investment?"
By analyzing price trends, circulation metrics, governance mechanisms, and metaverse gaming sector dynamics, this research aims to provide a comprehensive framework for understanding HIGH's position in the evolving crypto asset landscape.
I. Historical Price Comparison and Current Market Status
Historical Price Trends of HIGH (Coin A) and AAVE (Coin B)
- 2021: HIGH experienced significant price volatility, reaching an all-time high of $38.42 on December 17, 2021, reflecting strong initial market enthusiasm for the metaverse gaming sector.
- 2021: AAVE achieved its all-time high of $661.69 on May 19, 2021, driven by growing adoption of decentralized lending protocols during the DeFi boom.
- 2020: AAVE launched on October 2, 2020, with an initial price of $1.7, while also completing the LEND to AAVE token migration at a 100:1 ratio on October 3, 2020.
- 2020: AAVE recorded its all-time low of $26.02 on November 5, 2020, shortly after its mainnet launch.
- 2025: HIGH reached its all-time low of $0.189441 on December 19, 2025, reflecting sustained downward pressure in the metaverse gaming sector.
- Comparative Analysis: During the crypto market cycle from 2021 to 2025, HIGH declined from its peak of $38.42 to a low of $0.189441, representing a substantial decrease, while AAVE declined from $661.69 to current levels but maintained relatively stronger market positioning with higher trading volumes and market capitalization.
Current Market Status (January 24, 2026)
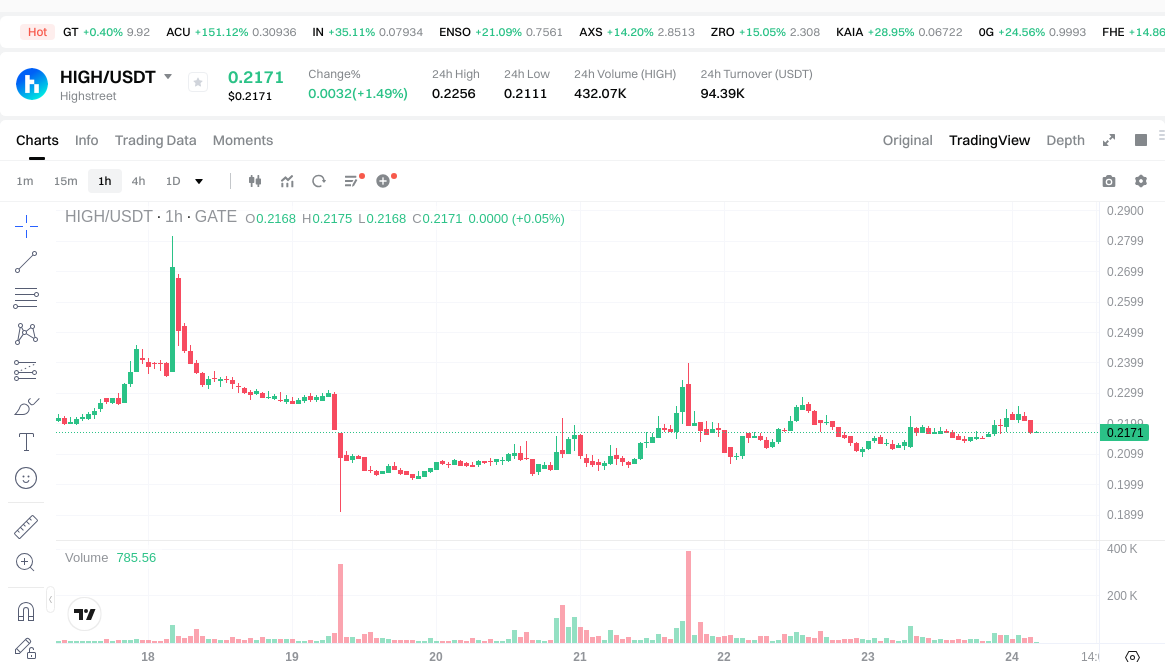
- HIGH current price: $0.2168
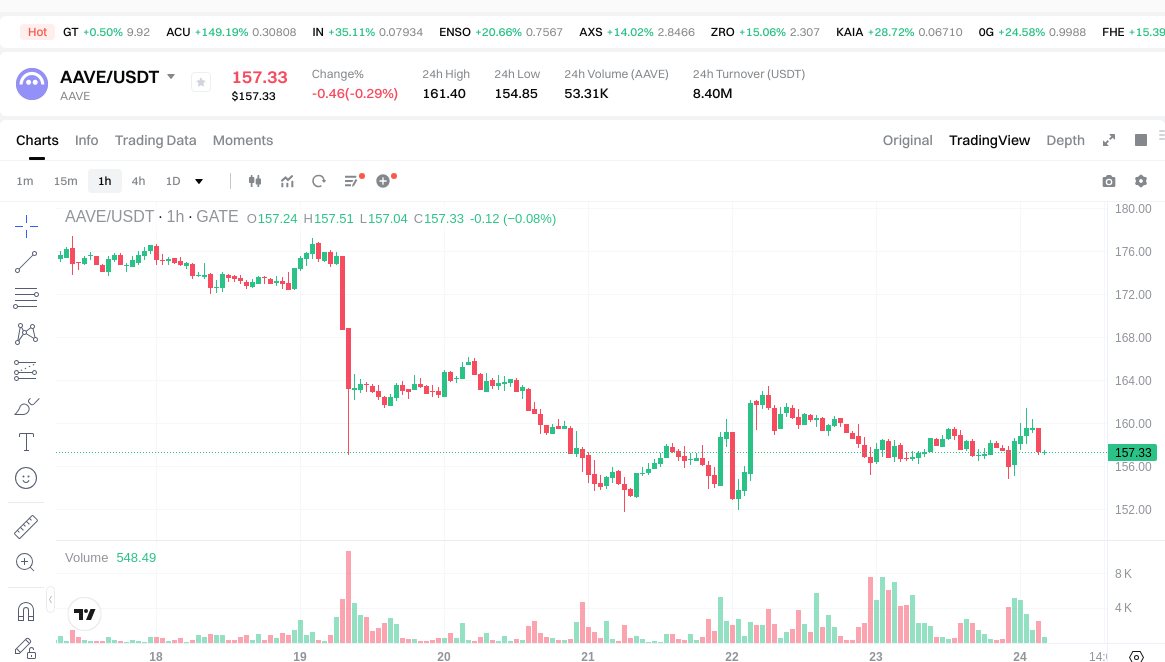
- AAVE current price: $157.23
- 24-hour trading volume: HIGH recorded $94,642.58 compared to AAVE's $8,469,493.31
- Market capitalization: HIGH stands at approximately $16.99 million, while AAVE maintains approximately $2.39 billion
- Market sentiment index (Fear & Greed Index): 24 (Extreme Fear)
- Price performance (24H): HIGH increased by 1.73%, while AAVE decreased by 0.19%
- Price performance (7D): HIGH increased by 1.16%, while AAVE decreased by 8.63%
- Price performance (30D): HIGH increased by 6.84%, while AAVE increased by 6%
- Price performance (1Y): HIGH decreased by 82.35%, while AAVE decreased by 54.59%
View real-time prices:
II. Core Factors Affecting HIGH vs AAVE Investment Value
Supply Mechanism Comparison (Tokenomics)
Due to limited reference materials, detailed supply mechanism information for HIGH and AAVE cannot be provided at this time. Generally speaking, token supply mechanisms may include aspects such as total supply caps, emission schedules, and potential deflationary features, which could influence long-term price dynamics.
Institutional Adoption and Market Application
Institutional Holdings: Specific data regarding institutional preference between HIGH and AAVE is not available in the provided materials.
Enterprise Adoption: Information comparing the application of HIGH and AAVE in cross-border payments, settlements, or investment portfolios is not included in the reference materials.
National Policies: Regulatory attitudes from different jurisdictions toward HIGH and AAVE are not documented in the available sources.
Technical Development and Ecosystem Building
HIGH Technical Upgrades: Details regarding technical developments and their potential impacts for HIGH are not provided in the reference materials.
AAVE Technical Development: Specific information about AAVE's technical evolution and potential implications is not available in the provided sources.
Ecosystem Comparison: Comparative data on DeFi integration, NFT applications, payment solutions, and smart contract implementations for both projects cannot be extracted from the current materials.
Macroeconomic Conditions and Market Cycles
Performance in Inflationary Environments: Analysis of which asset demonstrates stronger inflation-hedging characteristics is not supported by the available reference materials.
Macroeconomic Monetary Policy: The specific impacts of interest rates and dollar index movements on HIGH and AAVE are not detailed in the provided sources.
Geopolitical Factors: Information regarding cross-border transaction demand and international situation impacts on these assets is not included in the reference materials.
III. 2026-2031 Price Forecast: HIGH vs AAVE
Short-term Forecast (2026)
- HIGH: Conservative $0.15-$0.22 | Optimistic $0.22-$0.26
- AAVE: Conservative $86.57-$157.40 | Optimistic $157.40-$218.79
Mid-term Forecast (2028-2029)
- HIGH may enter a consolidation phase, with estimated prices ranging from $0.28-$0.42
- AAVE may enter an expansion phase, with estimated prices ranging from $206.53-$303.46
- Key drivers: institutional capital inflows, ETF developments, ecosystem growth
Long-term Forecast (2030-2031)
- HIGH: Baseline scenario $0.20-$0.39 | Optimistic scenario $0.33-$0.57
- AAVE: Baseline scenario $199.80-$284.82 | Optimistic scenario $327.55-$481.49
View detailed price predictions for HIGH and AAVE
Disclaimer
HIGH:
| Year |
Predicted High Price |
Predicted Average Price |
Predicted Low Price |
Price Change |
| 2026 |
0.264984 |
0.2172 |
0.145524 |
0 |
| 2027 |
0.33993972 |
0.241092 |
0.14947704 |
11 |
| 2028 |
0.4183428384 |
0.29051586 |
0.2788952256 |
34 |
| 2029 |
0.396960871104 |
0.3544293492 |
0.269366305392 |
63 |
| 2030 |
0.3944798656596 |
0.375695110152 |
0.20287535948208 |
73 |
| 2031 |
0.573780356979642 |
0.3850874879058 |
0.331175239598988 |
77 |
AAVE:
| Year |
Predicted High Price |
Predicted Average Price |
Predicted Low Price |
Price Change |
| 2026 |
218.786 |
157.4 |
86.57 |
0 |
| 2027 |
270.85392 |
188.093 |
116.61766 |
19 |
| 2028 |
302.9049672 |
229.47346 |
206.526114 |
45 |
| 2029 |
303.455703504 |
266.1892136 |
199.6419102 |
69 |
| 2030 |
370.2691961176 |
284.822458552 |
239.25086518368 |
81 |
| 2031 |
481.492366182156 |
327.5458273348 |
199.802954674228 |
108 |
IV. Investment Strategy Comparison: HIGH vs AAVE
Long-term vs Short-term Investment Strategies
- HIGH: May suit investors interested in metaverse gaming ecosystems and NFT commerce integration, with particular attention to niche market positioning within the gaming sector
- AAVE: May suit investors seeking exposure to decentralized finance infrastructure and established DeFi protocols with demonstrated market resilience
Risk Management and Asset Allocation
- Conservative investors: HIGH 10-20% vs AAVE 80-90%
- Aggressive investors: HIGH 30-40% vs AAVE 60-70%
- Hedging instruments: stablecoin allocation, options strategies, cross-asset portfolio diversification
V. Potential Risk Comparison
Market Risk
- HIGH: faces elevated volatility associated with metaverse gaming sector sentiment, limited liquidity evidenced by lower trading volumes, and significant historical price decline from peak levels
- AAVE: experiences volatility linked to DeFi sector cycles, regulatory developments affecting lending protocols, and competitive pressures within decentralized finance markets
Technical Risk
- HIGH: scalability considerations for metaverse platform growth, network stability requirements for gaming experiences
- AAVE: smart contract security considerations, protocol upgrade execution risks
Regulatory Risk
- Global regulatory frameworks may impact these assets differently, with DeFi lending protocols potentially facing increased scrutiny regarding consumer protection and financial stability, while metaverse gaming tokens may encounter regulations specific to virtual asset trading and gaming economies
VI. Conclusion: Which Is the Better Buy?
📌 Investment Value Summary:
- HIGH advantages: positioning within metaverse gaming and NFT commerce sectors, governance participation opportunities, cross-platform gaming ecosystem
- AAVE advantages: established presence in DeFi lending markets, higher liquidity levels, broader institutional recognition
✅ Investment Recommendations:
- Novice investors: consider AAVE for exposure to more established DeFi infrastructure with higher liquidity and market capitalization
- Experienced investors: may evaluate portfolio allocation between both assets based on risk tolerance and sector diversification objectives
- Institutional investors: assess AAVE for DeFi protocol exposure and HIGH as a tactical allocation for metaverse gaming sector participation
⚠️ Risk Disclosure: Cryptocurrency markets exhibit high volatility. This article does not constitute investment advice.
VII. FAQ
Q1: What is the fundamental difference between HIGH and AAVE in terms of use cases?
HIGH serves as a utility and governance token within a metaverse gaming ecosystem combining MMORPG gameplay, NFT commerce, and virtual brand integration, while AAVE functions as a governance token for a decentralized lending protocol within the DeFi sector. HIGH facilitates in-game progression, special item purchases, and governance participation in the Highstreet metaverse platform, whereas AAVE enables protocol governance, staking, and fee reduction benefits within decentralized lending markets. This fundamental distinction means HIGH targets gaming and virtual commerce users, while AAVE serves participants in decentralized financial services.
Q2: How have HIGH and AAVE performed historically compared to their all-time highs?
HIGH has experienced a decline of approximately 99.4% from its all-time high of $38.42 (December 17, 2021) to its current price of $0.2168, while AAVE has declined approximately 76.2% from its all-time high of $661.69 (May 19, 2021) to its current price of $157.23. The year-over-year performance shows HIGH decreased by 82.35% while AAVE decreased by 54.59%, indicating AAVE has demonstrated relatively stronger price resilience. These historical trajectories reflect different market dynamics, with HIGH affected by metaverse gaming sector sentiment and AAVE influenced by DeFi market cycles.
Q3: What are the key liquidity differences between HIGH and AAVE?
As of January 24, 2026, HIGH recorded a 24-hour trading volume of $94,642.58 compared to AAVE's $8,469,493.31, representing approximately 89 times higher liquidity for AAVE. Market capitalization further illustrates this disparity, with HIGH at approximately $16.99 million versus AAVE at approximately $2.39 billion—a difference of over 140 times. These liquidity metrics indicate that AAVE offers significantly deeper markets for entry and exit positions, potentially reducing slippage risks and providing more stable price discovery mechanisms compared to HIGH's relatively limited trading activity.
Q4: Which asset demonstrates better short-term price momentum?
In the short-term period, HIGH shows stronger momentum with a 1.73% increase over 24 hours and 1.16% increase over 7 days, while AAVE decreased by 0.19% over 24 hours and 8.63% over 7 days. However, over the 30-day period, both assets demonstrated positive performance with HIGH increasing by 6.84% and AAVE by 6%, suggesting comparable medium-term momentum. It is important to note that HIGH's lower liquidity may amplify short-term price movements, and these recent gains follow substantial historical declines, particularly for HIGH which remains near its all-time low.
Q5: What are the primary risk factors differentiating HIGH and AAVE investments?
HIGH faces elevated risks including extreme volatility associated with metaverse gaming sector sentiment, limited liquidity evidenced by substantially lower trading volumes, significant historical drawdown from peak levels, and dependency on gaming ecosystem adoption. AAVE's risk profile includes volatility linked to DeFi sector cycles, potential regulatory scrutiny of decentralized lending protocols, smart contract security considerations, and competitive pressures within decentralized finance markets. The key distinction lies in HIGH's exposure to niche gaming sector dynamics versus AAVE's positioning within established DeFi infrastructure, with AAVE generally presenting lower liquidity risk but potentially higher regulatory risk.
Q6: How do the 2026-2031 price forecasts compare between HIGH and AAVE?
For 2026, HIGH's conservative forecast ranges from $0.15-$0.22 while AAVE ranges from $86.57-$157.40, with optimistic scenarios at $0.22-$0.26 and $157.40-$218.79 respectively. By 2031, HIGH's baseline scenario projects $0.20-$0.39 with an optimistic range of $0.33-$0.57, while AAVE's baseline scenario forecasts $199.80-$284.82 with an optimistic range of $327.55-$481.49. These projections suggest AAVE may demonstrate higher absolute price appreciation potential, though percentage gains differ—HIGH's optimistic 2031 scenario represents approximately 77% growth from 2026 average, while AAVE's represents approximately 108% growth. Forecasts remain speculative and subject to numerous market variables.
Q7: What portfolio allocation strategies are suggested for different investor types?
Conservative investors may consider a 10-20% HIGH allocation versus 80-90% AAVE allocation, prioritizing the more established DeFi protocol with higher liquidity and market capitalization. Aggressive investors might allocate 30-40% to HIGH and 60-70% to AAVE, accepting higher volatility in exchange for potential exposure to metaverse gaming sector growth. Novice investors are recommended to consider AAVE for exposure to more established DeFi infrastructure, while experienced investors may evaluate portfolio allocation based on risk tolerance and sector diversification objectives. Institutional investors might assess AAVE for primary DeFi protocol exposure with HIGH as a tactical allocation for metaverse gaming sector participation.
Q8: What market conditions currently influence both HIGH and AAVE?
As of January 24, 2026, both assets operate within a market sentiment characterized by the Fear & Greed Index at 24 (Extreme Fear), suggesting widespread market caution. Macroeconomic factors potentially affecting both include interest rate environments, regulatory developments in cryptocurrency markets, and broader risk asset sentiment. HIGH specifically faces conditions related to metaverse gaming adoption trends and NFT market dynamics, while AAVE is influenced by DeFi protocol usage, total value locked (TVL) trends, and regulatory approaches to decentralized lending. The divergent 7-day performance (HIGH +1.16%, AAVE -8.63%) suggests sector-specific dynamics are currently outweighing broader market conditions in determining short-term price movements.
* The information is not intended to be and does not constitute financial advice or any other recommendation of any sort offered or endorsed by Gate.