This comprehensive guide compares HIVE and OP, two distinct blockchain ecosystems serving different purposes within the crypto market. HIVE is a decentralized social blockchain platform launched in 2020 emphasizing Web 3.0 content creation, while OP (Optimism) functions as a Layer 2 scaling solution for Ethereum introduced in 2022. The article examines historical price trends, current market status on Gate showing HIVE at $0.09825 versus OP at $0.3109, and analyzes key investment factors including supply mechanisms, technological ecosystems, and risk profiles. Price predictions through 2031 suggest different growth trajectories for both assets, with OP demonstrating superior liquidity and market capitalization ($604.42M vs $50.27M). The guide provides tailored investment strategies for conservative and aggressive investors, addressing which asset better suits different investment objectives and risk tolerances in today's cryptocurrency landscape.
Introduction: HIVE vs OP Investment Comparison
In the cryptocurrency market, the comparison between HIVE vs OP has consistently been a topic that investors cannot overlook. The two assets not only differ significantly in market capitalization ranking, application scenarios, and price performance, but also represent distinct positioning within the crypto asset landscape.
HIVE: Launched in March 2020, this DPoS governance blockchain has gained market recognition through its positioning as a decentralized social blockchain platform. Built on Graphene technology, HIVE emphasizes true decentralization, speed, and scalability, targeting Web 3.0 applications and decentralized content creation.
OP (Optimism): Introduced in May 2022, OP serves as the governance token for Optimism, a Layer 2 scaling solution for Ethereum. Positioned as a low-cost, lightning-fast secondary blockchain, Optimism addresses the practical needs of developers and users seeking efficient Ethereum-based applications.
This article will provide a comprehensive analysis of HIVE vs OP investment value comparison, examining historical price trends, supply mechanisms, technological ecosystems, and future outlook. We aim to address the question that concerns investors most:
"Which is the better buy right now?"
As of January 19, 2026, HIVE ranks 521st with a market capitalization of approximately 50.27 million, while OP ranks 112th with a market capitalization of approximately 604.42 million, reflecting their different scales and market positions in the crypto ecosystem.
I. Historical Price Comparison and Market Status
Historical Price Trends of HIVE (Coin A) and OP (Coin B)
- 2021: HIVE experienced a price peak at $3.41 in November 2021, during a period of broader cryptocurrency market expansion.
- 2024: OP reached its historical high of $4.84 in March 2024, reflecting strong interest in Ethereum Layer 2 scaling solutions.
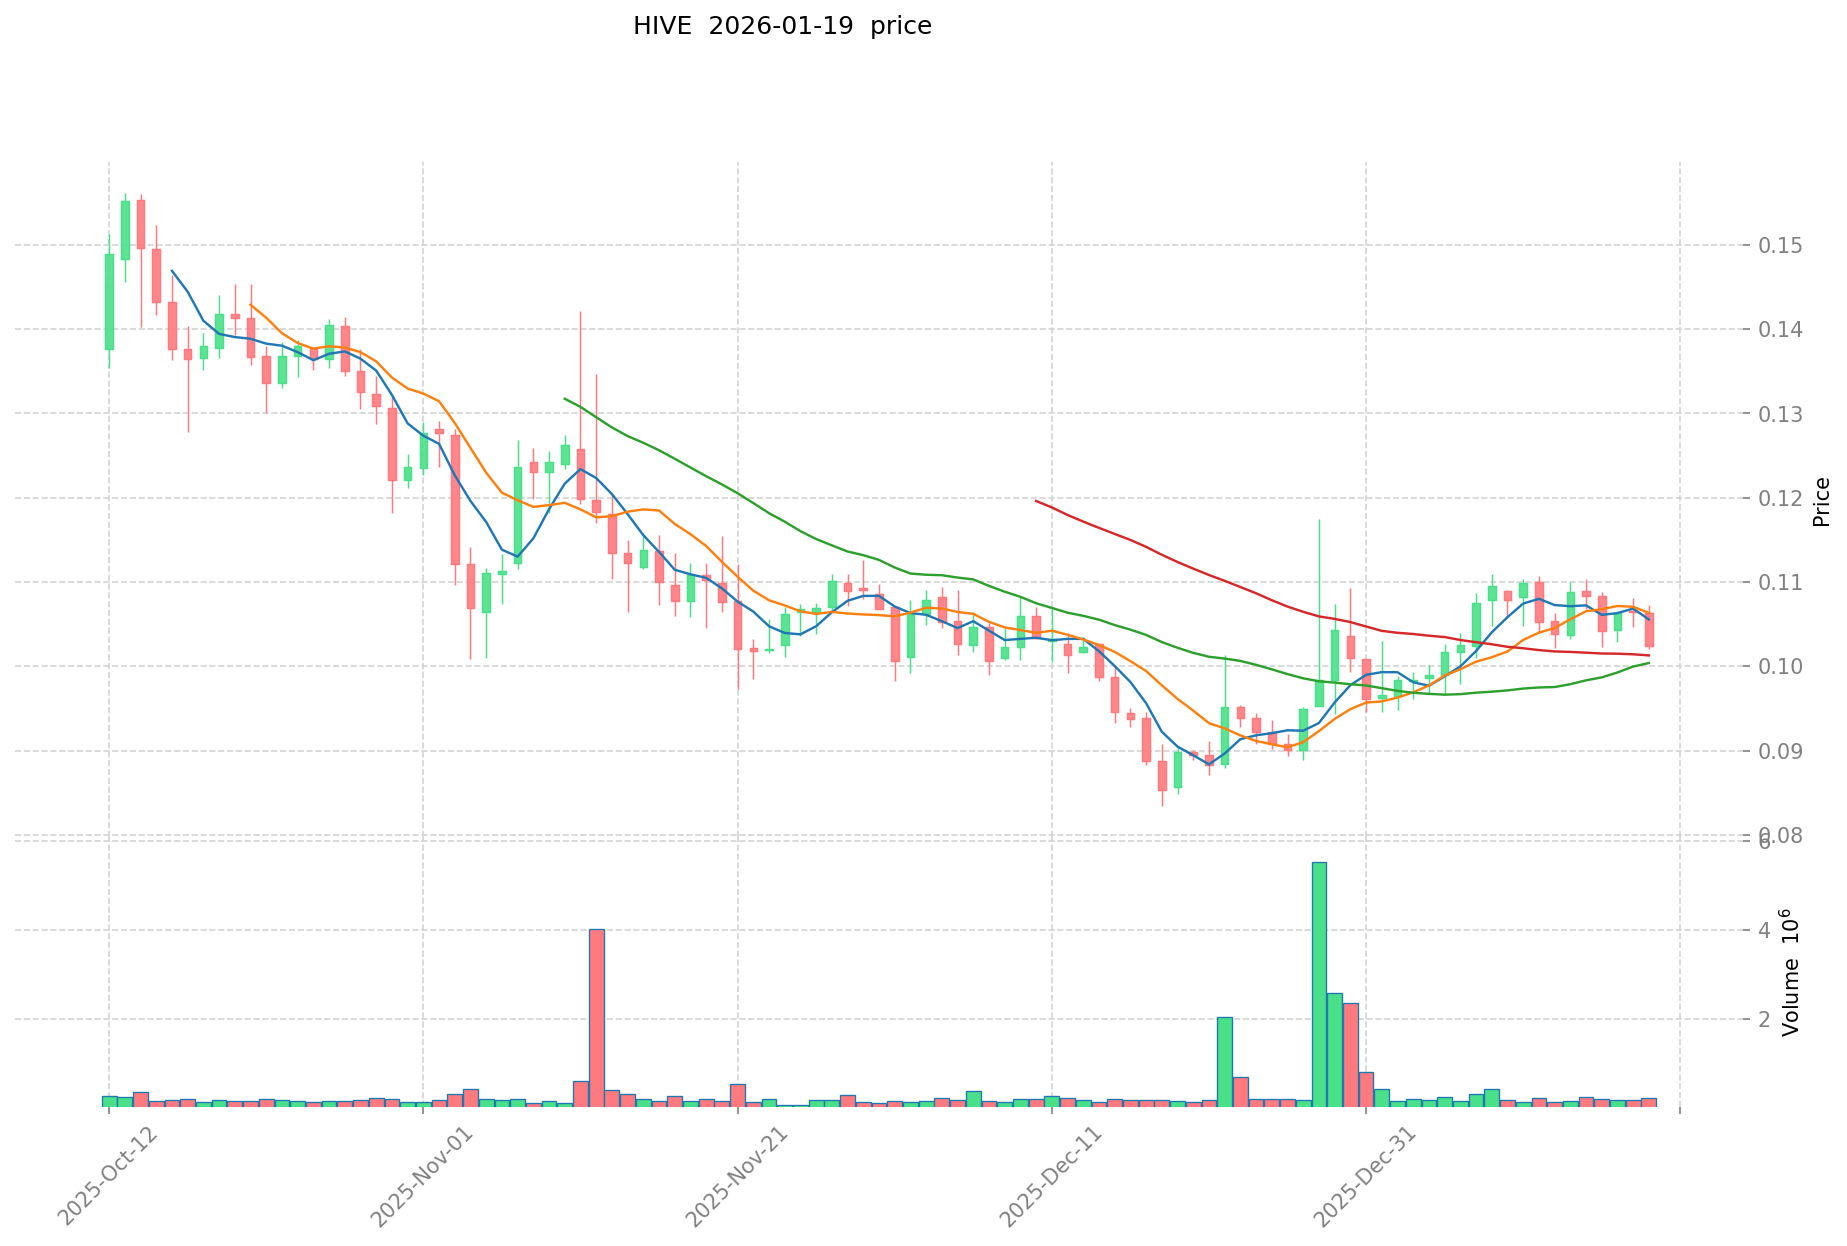
- Comparative Analysis: During recent market cycles, HIVE declined from its all-time high of $3.41 to a low of $0.083898 in December 2025, representing a substantial correction. In contrast, OP dropped from its peak of $4.84 to $0.251922 in December 2025, also experiencing significant downward pressure.
Current Market Status (2026-01-19)
- HIVE Current Price: $0.09825
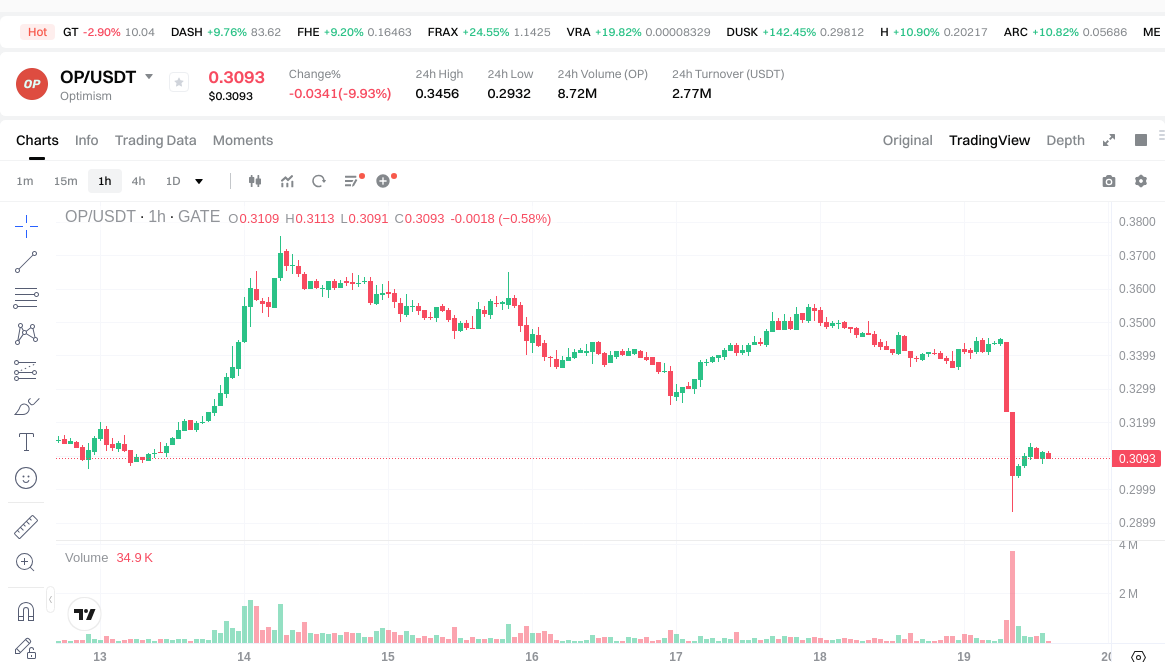
- OP Current Price: $0.3109
- 24-Hour Trading Volume: HIVE recorded $26,751.14 vs OP recorded $2,797,063.34
- Market Sentiment Index (Fear & Greed Index): 44 (Fear)
View Real-Time Prices:
II. Core Factors Influencing HIVE vs OP Investment Value
Supply Mechanism Comparison (Tokenomics)
- HIVE: The supply mechanism and scarcity represent key factors affecting its investment value, with blockchain technology forming the foundation of its tokenomics structure.
- OP: Information regarding specific supply mechanisms was not available in the reference materials.
- 📌 Historical Patterns: Supply mechanisms can influence price cycles through scarcity dynamics and emission schedules, though specific historical data for these assets requires further analysis.
Institutional Adoption and Market Applications
- Institutional Holdings: Reference materials do not provide comparative data on institutional preference between HIVE and OP.
- Enterprise Adoption: Specific applications of HIVE or OP in cross-border payments, settlements, or investment portfolios were not detailed in the available materials.
- National Policies: Regulatory attitudes toward these specific assets across different jurisdictions were not covered in the reference materials.
Technology Development and Ecosystem Building
- HIVE Technology: As a blockchain-based social media platform, HIVE's technology development focuses on decentralized content creation and community engagement, though specific upgrade details were not provided.
- OP Technology: Technical development information for OP was not available in the reference materials.
- Ecosystem Comparison: While the reference materials discuss broader blockchain concepts including DeFi, NFT, and smart contracts, specific comparative data on HIVE and OP ecosystem implementations was not provided.
Macroeconomic Environment and Market Cycles
- Performance Under Inflation: Comparative analysis of inflation-hedging properties between HIVE and OP was not available in the reference materials.
- Macroeconomic Monetary Policy: The influence of interest rates and dollar index movements on these specific assets was not detailed in the provided materials.
- Geopolitical Factors: While cross-border transaction demand and international situations can affect cryptocurrency markets generally, specific impacts on HIVE versus OP were not addressed in the reference materials.
III. 2026-2031 Price Prediction: HIVE vs OP
Short-term Prediction (2026)
- HIVE: Conservative $0.07074 - $0.09825 | Optimistic $0.09825 - $0.1011975
- OP: Conservative $0.16767 - $0.3105 | Optimistic $0.3105 - $0.375705
Medium-term Prediction (2028-2029)
- HIVE may enter a consolidation phase, with estimated price range of $0.0774 - $0.1446
- OP may enter a growth phase, with estimated price range of $0.2388 - $0.6017
- Key drivers: institutional capital inflows, ETF developments, ecosystem expansion
Long-term Prediction (2030-2031)
- HIVE: Base scenario $0.0960 - $0.1467 | Optimistic scenario $0.1391 - $0.1878
- OP: Base scenario $0.2709 - $0.6186 | Optimistic scenario $0.5649 - $0.6666
View detailed price predictions for HIVE and OP
Disclaimer
HIVE:
| Year |
Predicted High Price |
Predicted Average Price |
Predicted Low Price |
Price Change |
| 2026 |
0.1011975 |
0.09825 |
0.07074 |
0 |
| 2027 |
0.1246546875 |
0.09972375 |
0.08376795 |
1 |
| 2028 |
0.12116435625 |
0.11218921875 |
0.0774105609375 |
14 |
| 2029 |
0.1446792165 |
0.1166767875 |
0.071172840375 |
18 |
| 2030 |
0.14766614226 |
0.130678002 |
0.12545088192 |
33 |
| 2031 |
0.1878822973755 |
0.13917207213 |
0.0960287297697 |
41 |
OP:
| Year |
Predicted High Price |
Predicted Average Price |
Predicted Low Price |
Price Change |
| 2026 |
0.375705 |
0.3105 |
0.16767 |
0 |
| 2027 |
0.415154025 |
0.3431025 |
0.264188925 |
10 |
| 2028 |
0.46253648025 |
0.3791282625 |
0.238850805375 |
21 |
| 2029 |
0.60179029106625 |
0.420832371375 |
0.3787491342375 |
35 |
| 2030 |
0.618686710776956 |
0.511311331220625 |
0.270995005546931 |
64 |
| 2031 |
0.666698844778572 |
0.56499902099879 |
0.42939925595908 |
81 |
IV. Investment Strategy Comparison: HIVE vs OP
Long-term vs Short-term Investment Strategies
- HIVE: May suit investors interested in decentralized social media platforms and Web 3.0 content creation ecosystems, with consideration for its community-driven governance model
- OP: May appeal to investors focusing on Ethereum Layer 2 scaling solutions and seeking exposure to infrastructure supporting decentralized application development
Risk Management and Asset Allocation
- Conservative Investors: HIVE 30% vs OP 70%
- Aggressive Investors: HIVE 45% vs OP 55%
- Hedging Tools: stablecoin allocation, options strategies, cross-asset portfolio diversification
V. Potential Risk Comparison
Market Risk
- HIVE: Exposure to social media platform adoption cycles, market capitalization volatility given its smaller ranking position, and liquidity constraints reflected in lower trading volumes
- OP: Subject to Ethereum ecosystem developments, Layer 2 competition dynamics, and broader altcoin market sentiment fluctuations
Technical Risk
- HIVE: Scalability considerations for social content platforms, network stability during user growth phases
- OP: Layer 2 solution security architecture, potential smart contract vulnerabilities, cross-chain bridge risks
Regulatory Risk
- Global regulatory approaches may impact these assets differently, with HIVE potentially facing content moderation considerations and OP subject to DeFi and Layer 2 infrastructure oversight frameworks
VI. Conclusion: Which Is the Better Buy?
📌 Investment Value Summary:
- HIVE Advantages: Positioned in decentralized social media niche with community governance features, potential upside from Web 3.0 content platform adoption
- OP Advantages: Infrastructure play supporting Ethereum scalability, larger market capitalization providing relative stability, stronger liquidity as evidenced by trading volume
✅ Investment Recommendations:
- Beginner Investors: Consider OP for its larger ecosystem support and higher liquidity, allowing easier position management
- Experienced Investors: May evaluate HIVE for niche exposure to social blockchain platforms while maintaining OP allocation for Layer 2 infrastructure exposure
- Institutional Investors: OP may offer more suitable liquidity profiles for larger capital deployment, though portfolio diversification across both assets could provide exposure to different blockchain use cases
⚠️ Risk Disclaimer: Cryptocurrency markets exhibit extreme volatility. This content does not constitute investment advice.
VII. FAQ
Q1: What are the main differences between HIVE and OP in terms of their core functions?
HIVE is a decentralized social blockchain platform focused on Web 3.0 content creation and community governance, while OP (Optimism) serves as a Layer 2 scaling solution for Ethereum designed to reduce transaction costs and increase processing speed. HIVE operates as a DPoS governance blockchain built on Graphene technology, emphasizing decentralization in social media applications. In contrast, OP functions as infrastructure supporting the broader Ethereum ecosystem, enabling developers to build scalable decentralized applications with lower fees and faster transaction times.
Q2: Which asset shows better liquidity based on current market data?
OP demonstrates significantly superior liquidity compared to HIVE. As of January 19, 2026, OP recorded a 24-hour trading volume of $2,797,063.34, while HIVE's trading volume reached only $26,751.14. This substantial difference—approximately 105 times higher for OP—indicates that OP offers easier entry and exit opportunities for investors, reduced slippage on larger trades, and generally more stable price discovery mechanisms.
Q3: How do the market capitalizations of HIVE and OP compare?
OP holds a considerably larger market capitalization than HIVE. As of January 19, 2026, OP ranks 112th with a market capitalization of approximately $604.42 million, while HIVE ranks 521st with approximately $50.27 million. This represents a market cap ratio of roughly 12:1 in favor of OP, reflecting its stronger market position, broader institutional recognition, and more extensive adoption within the cryptocurrency ecosystem.
Q4: What are the predicted price ranges for HIVE and OP by 2031?
According to long-term projections, HIVE's price range for 2031 spans from $0.0960 (predicted low) to $0.1878 (optimistic scenario high), with a predicted average of $0.1391. OP's 2031 predictions show a range from $0.4294 (predicted low) to $0.6667 (optimistic scenario high), with a predicted average of $0.5650. These forecasts suggest OP may experience stronger absolute price growth, though predictions remain speculative and subject to numerous market variables including adoption rates, regulatory developments, and broader cryptocurrency market conditions.
Q5: Which asset is more suitable for conservative investors?
OP appears more suitable for conservative investors based on several factors. Its larger market capitalization ($604.42 million vs $50.27 million), significantly higher liquidity (105x greater trading volume), and infrastructure positioning within the established Ethereum ecosystem provide relative stability compared to HIVE. The recommended conservative allocation suggests 70% OP versus 30% HIVE, reflecting OP's lower volatility profile and easier position management capabilities for risk-averse investors.
Q6: What are the primary technological risks associated with each asset?
HIVE faces technological risks related to scalability considerations for social content platforms and network stability during user growth phases, as its infrastructure must support decentralized content creation at scale. OP confronts different technical challenges including Layer 2 solution security architecture vulnerabilities, potential smart contract exploits, and cross-chain bridge risks inherent in connecting Layer 2 networks with the Ethereum mainnet. Both assets carry distinct technical risk profiles corresponding to their respective use cases and architectural designs.
Q7: How have HIVE and OP performed since their respective all-time highs?
Both assets have experienced substantial corrections from their peaks. HIVE declined from its all-time high of $3.41 (November 2021) to $0.083898 (December 2025), representing approximately a 97.5% decrease before recovering slightly to $0.09825. OP dropped from its peak of $4.84 (March 2024) to $0.251922 (December 2025), a decline of approximately 94.8%, before rising to its current price of $0.3109. These significant drawdowns reflect broader cryptocurrency market cycles and asset-specific factors affecting adoption and investor sentiment.
Q8: What portfolio allocation strategy is recommended for aggressive investors comparing HIVE and OP?
For aggressive investors seeking higher risk-reward profiles, the recommended allocation is 45% HIVE and 55% OP. This strategy provides increased exposure to HIVE's potential upside from niche positioning in decentralized social media platforms while maintaining majority allocation to OP's more established Layer 2 infrastructure play. Aggressive investors should implement risk management tools including stablecoin allocations for rebalancing opportunities, options strategies for downside protection, and cross-asset portfolio diversification to mitigate concentration risk in these volatile assets.
* The information is not intended to be and does not constitute financial advice or any other recommendation of any sort offered or endorsed by Gate.