This comprehensive comparison analyzes HMT and RUNE, two distinct blockchain tokens with different application ecosystems. HMT, launched in 2021, powers human-machine collaborative work systems through automated job markets, while RUNE, since 2019, serves THORChain's cross-chain liquidity protocol infrastructure. The article examines historical price trends showing HMT declining from $1.37 to $0.005093 and RUNE from $20.87 to $0.5192, alongside their current market positions with contrasting trading volumes. It provides detailed price forecasts through 2031, evaluates core investment factors including tokenomics and ecosystem development, and outlines risk management strategies for different investor profiles. With market sentiment indicating fear conditions, this guide helps investors understand which token aligns with their investment objectives through data-driven analysis and strategic allocation recommendations.
Introduction: HMT vs RUNE Investment Comparison
In the cryptocurrency market, the comparison between HMT and RUNE has become a topic of interest for investors. Both exhibit notable differences in market capitalization ranking, application scenarios, and price performance, representing distinct crypto asset positioning.
HUMAN (HMT): Launched in 2021, it has gained market recognition through its positioning in human-machine collaborative work systems. The protocol enables an automated job market where network participants use HMT to compensate labor and reward validators providing network services.
THORChain (RUNE): Since its launch in 2019, it has been recognized for its cross-chain liquidity protocol positioning. RUNE serves as the native token of the THORChain ecosystem, used for paying transaction fees, maintaining liquidity, and serving as block rewards.
This article will comprehensively analyze the investment value comparison between HMT and RUNE, covering historical price trends, supply mechanisms, technological ecosystems, and future outlook, attempting to address the most pressing question for investors:
"Which is the better buy right now?"
I. Historical Price Comparison and Current Market Status
HMT and RUNE Historical Price Trends
- 2021: HMT reached a price level of $1.37 in August, while RUNE experienced significant growth, reaching approximately $20.87 in May during the same period of market expansion.
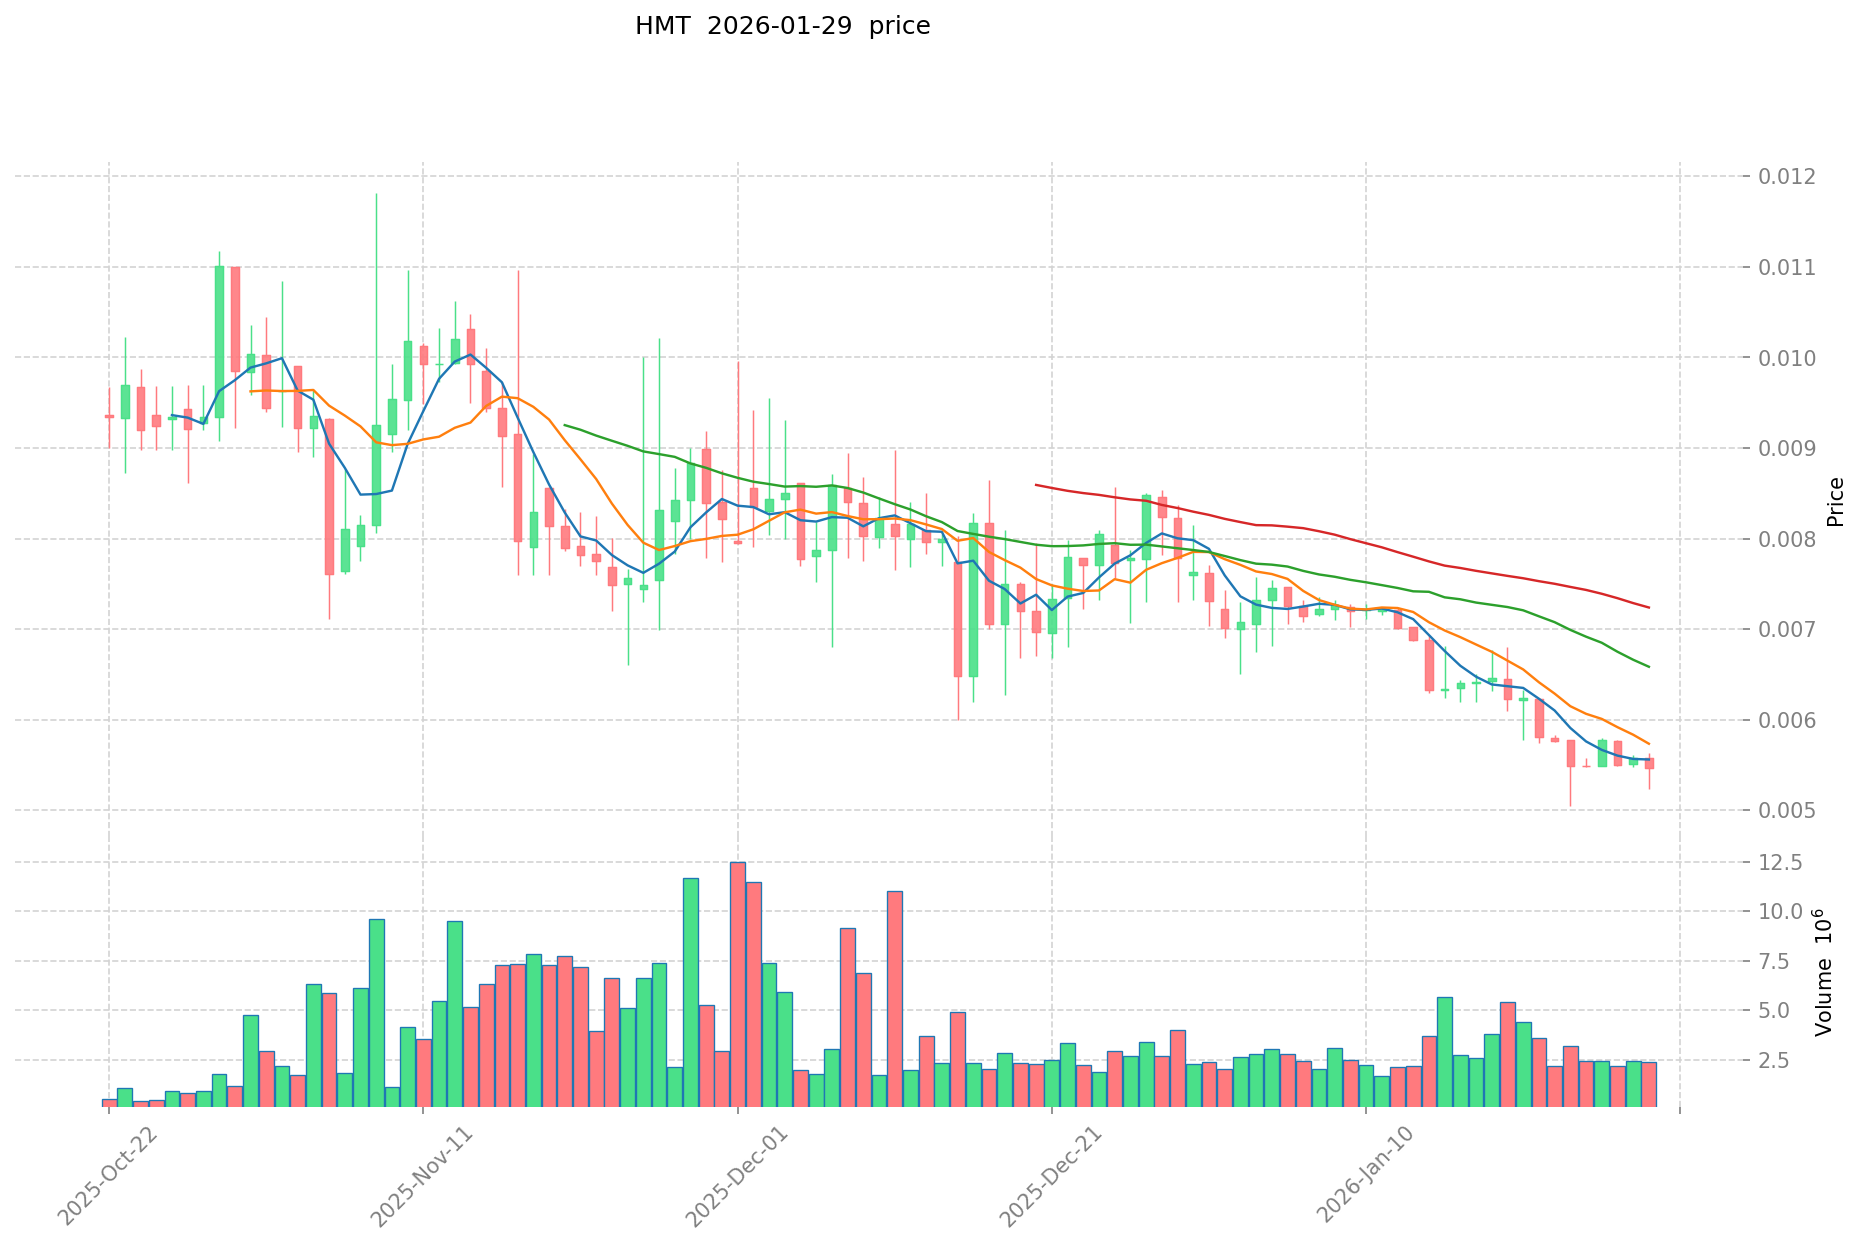
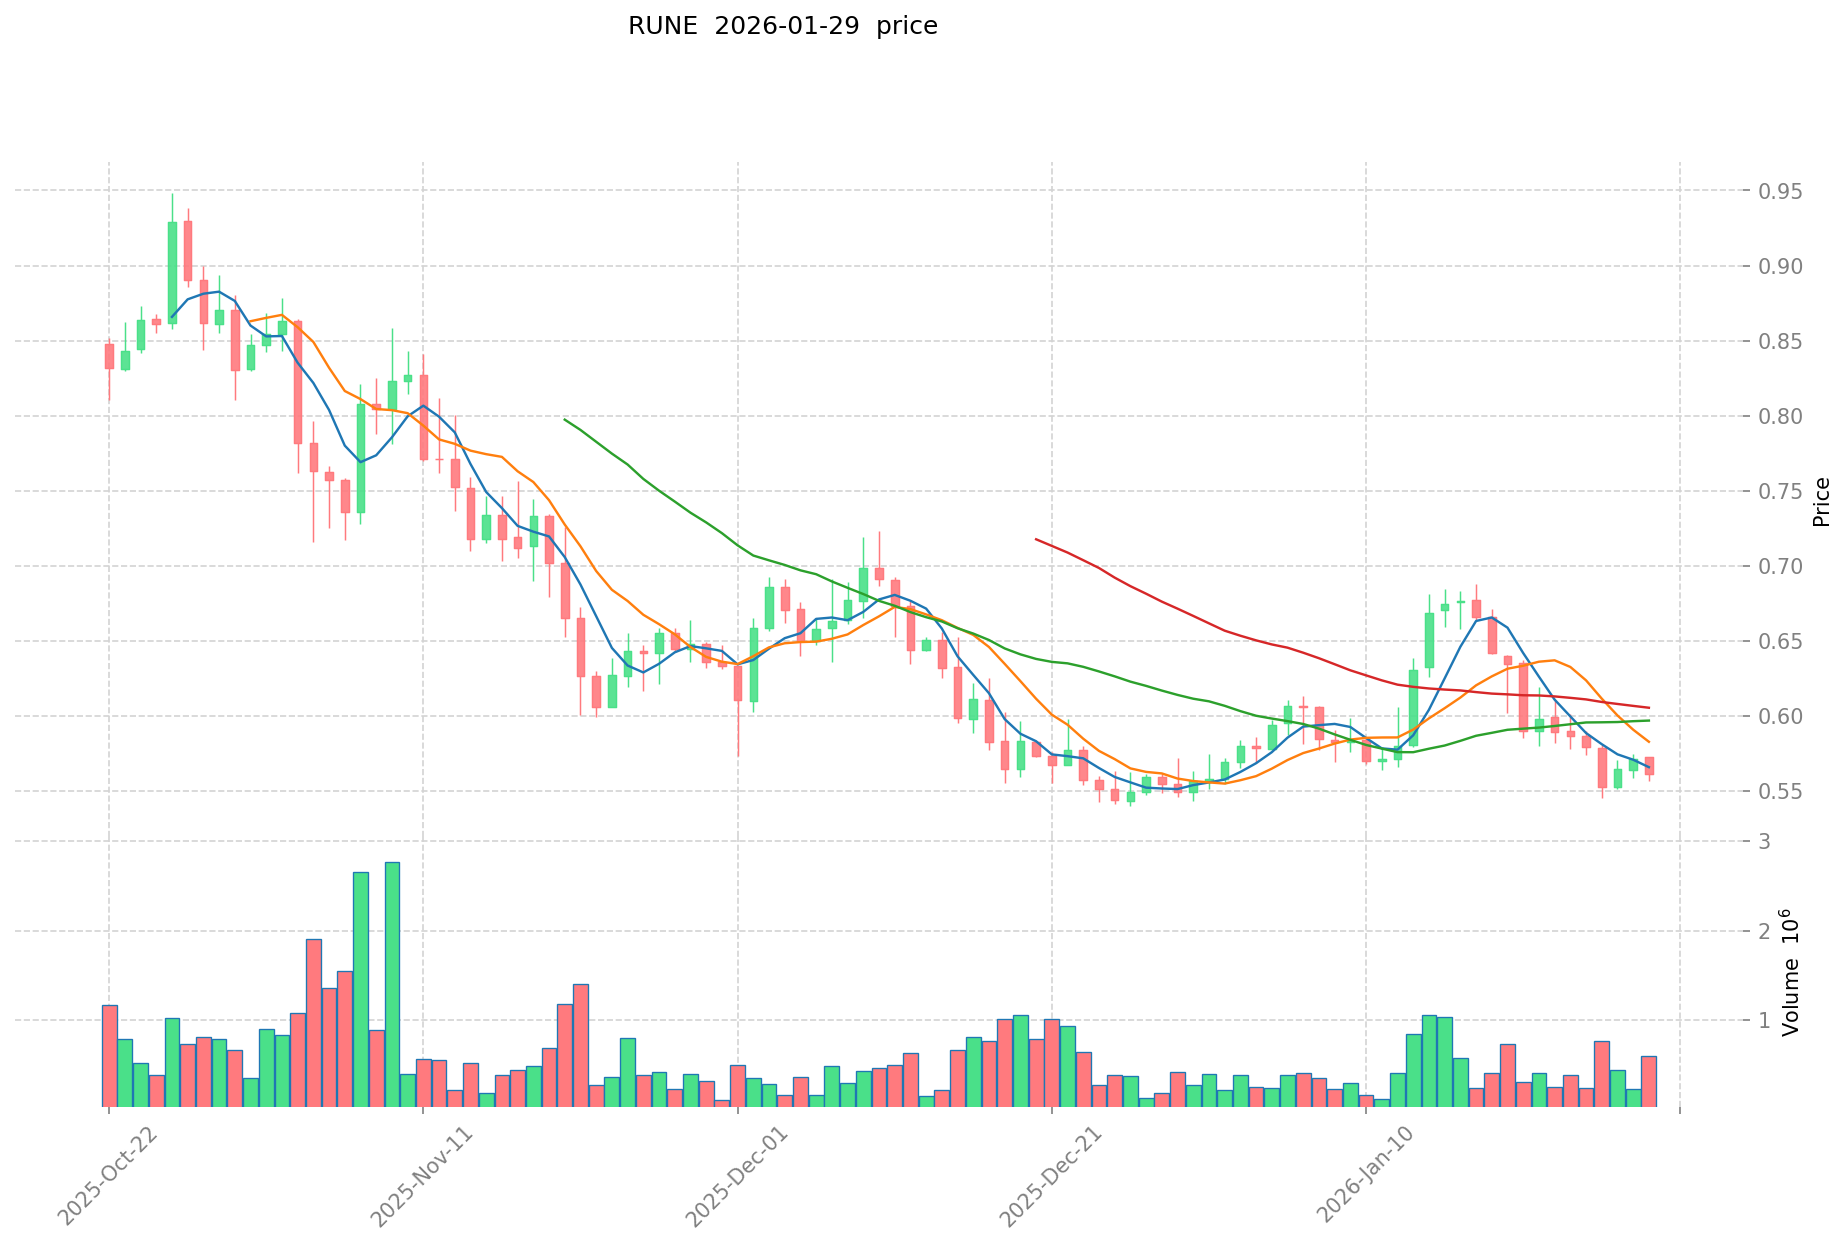
- 2026: Both assets have experienced considerable declines from their historical peaks. HMT recorded a low of $0.00491941 on January 29, 2026, while RUNE has declined to approximately $0.5192.
- Comparative Analysis: During the recent market cycle, HMT has declined from its historical high of $1.37 to current levels around $0.005093, representing a substantial decrease. RUNE has similarly declined from its peak of $20.87 to approximately $0.5192, showing a significant price contraction across both assets.
Current Market Status (January 30, 2026)
- HMT Current Price: $0.005093
- RUNE Current Price: $0.5192
- 24-Hour Trading Volume: HMT $14,034.19 vs RUNE $278,201.11
- Market Sentiment Index (Fear & Greed Index): 26 (Fear)
View Real-Time Prices:
II. Core Factors Affecting HMT vs RUNE Investment Value
Based on the available materials, limited specific information is provided regarding the core investment factors for HMT and RUNE. The reference materials primarily indicate that investment value for these assets may be influenced by market demand, technological development, and industry trends, with market supply-demand dynamics and technological innovation serving as potential driving factors.
Supply Mechanism Comparison (Tokenomics)
Specific tokenomics details for HMT and RUNE, including supply mechanisms, distribution models, or token release schedules, are not available in the provided materials.
Institutional Adoption and Market Application
The provided materials do not contain specific information regarding institutional holdings, enterprise adoption, or regulatory attitudes toward HMT and RUNE across different jurisdictions.
Technology Development and Ecosystem Building
While the materials suggest that technological development and innovation may influence investment value, specific technical upgrades, protocol improvements, or ecosystem developments for either HMT or RUNE are not detailed in the available references.
Macroeconomic Factors and Market Cycles
The reference materials do not provide specific analysis regarding how macroeconomic conditions, monetary policy changes, or geopolitical factors may differentially impact HMT and RUNE. General market dynamics and supply-demand relationships are mentioned as relevant considerations for digital asset investments.
III. 2026-2031 Price Forecast: HMT vs RUNE
Short-term Forecast (2026)
- HMT: Conservative $0.00433 - $0.00509 | Optimistic $0.00509 - $0.00672
- RUNE: Conservative $0.383 - $0.518 | Optimistic $0.518 - $0.648
Mid-term Forecast (2028-2029)
- HMT may enter a gradual growth phase, with projected price range of $0.00584 - $0.00755 in 2028, potentially reaching $0.00647 - $0.00920 by 2029
- RUNE may enter an accelerated expansion phase, with projected price range of $0.390 - $0.712 in 2028, potentially reaching $0.475 - $1.020 by 2029
- Key drivers: institutional capital inflows, ETF developments, ecosystem expansion
Long-term Forecast (2030-2031)
- HMT: Baseline scenario $0.00697 - $0.00801 (2030) | Optimistic scenario $0.00694 - $0.01295 (2031)
- RUNE: Baseline scenario $0.610 - $0.859 (2030) | Optimistic scenario $0.725 - $1.460 (2031)
View detailed price predictions for HMT and RUNE
Disclaimer
HMT:
| Year |
Predicted High Price |
Predicted Average Price |
Predicted Low Price |
Price Change |
| 2026 |
0.00672276 |
0.005093 |
0.00432905 |
0 |
| 2027 |
0.0062623528 |
0.00590788 |
0.0051398556 |
16 |
| 2028 |
0.007545544336 |
0.0060851164 |
0.005841711744 |
19 |
| 2029 |
0.0092006959968 |
0.006815330368 |
0.0064745638496 |
33 |
| 2030 |
0.010490497268944 |
0.0080080131824 |
0.006966971468688 |
57 |
| 2031 |
0.01294895731594 |
0.009249255225672 |
0.006936941419254 |
81 |
RUNE:
| Year |
Predicted High Price |
Predicted Average Price |
Predicted Low Price |
Price Change |
| 2026 |
0.6475 |
0.518 |
0.38332 |
0 |
| 2027 |
0.7867125 |
0.58275 |
0.361305 |
12 |
| 2028 |
0.7121205 |
0.68473125 |
0.3902968125 |
31 |
| 2029 |
1.0197017775 |
0.698425875 |
0.474929595 |
34 |
| 2030 |
1.2112799950125 |
0.85906382625 |
0.6099353166375 |
65 |
| 2031 |
1.459592393990062 |
1.03517191063125 |
0.724620337441875 |
99 |
IV. Investment Strategy Comparison: HMT vs RUNE
Long-term vs Short-term Investment Strategies
- HMT: May appeal to investors interested in human-machine collaborative work systems and emerging protocol-based labor markets, though current market conditions suggest heightened volatility considerations
- RUNE: May attract investors focused on cross-chain liquidity infrastructure and decentralized exchange protocols, with attention to ecosystem development trajectories
Risk Management and Asset Allocation
- Conservative Investors: HMT 20-30% vs RUNE 70-80% allocation considerations based on relative market positioning and liquidity profiles
- Aggressive Investors: HMT 40-50% vs RUNE 50-60% allocation approaches reflecting risk tolerance and growth orientation
- Hedging Tools: Stablecoin reserves for portfolio balance, derivatives instruments where available, and cross-asset diversification strategies
V. Potential Risk Comparison
Market Risks
- HMT: Exposure to lower liquidity conditions as reflected in 24-hour trading volume of $14,034.19, with price volatility considerations given substantial contraction from historical levels
- RUNE: Market fluctuation exposure with 24-hour trading volume of $278,201.11, subject to broader cross-chain protocol adoption dynamics and competitive landscape developments
Technical Risks
- HMT: Network scalability considerations and operational stability factors relevant to protocol-based labor market infrastructure
- RUNE: Cross-chain bridge security considerations, liquidity pool mechanism resilience, and protocol upgrade execution factors
Regulatory Risks
- Evolving regulatory frameworks across different jurisdictions may impact both assets differently based on their functional classifications and operational models, with particular attention to labor market protocols and decentralized exchange infrastructure
VI. Conclusion: Which Is the Better Buy?
📌 Investment Value Summary:
- HMT Considerations: Positioning in human-machine collaborative systems represents an emerging application area, though current market metrics indicate significant price compression and lower trading volume relative to historical benchmarks
- RUNE Considerations: Cross-chain liquidity protocol infrastructure addresses interoperability needs in the decentralized finance ecosystem, with relatively higher trading volume and established market presence since 2019
✅ Investment Perspectives:
- Newer Market Participants: Consider gradual exposure with emphasis on fundamental research, risk assessment, and portfolio diversification across multiple asset classes rather than concentrated positions
- Experienced Market Participants: May evaluate technical ecosystem developments, adoption metrics, and competitive positioning alongside traditional risk-return analysis frameworks
- Institutional Participants: Comprehensive due diligence on protocol architecture, governance structures, regulatory compliance considerations, and liquidity depth analysis recommended
⚠️ Risk Notice: Cryptocurrency markets exhibit significant volatility characteristics. This content does not constitute investment advice.
VII. FAQ
Q1: What are the primary differences between HMT and RUNE in terms of their use cases?
HMT focuses on human-machine collaborative work systems and automated job markets, while RUNE serves as a cross-chain liquidity protocol for decentralized exchanges. HMT enables network participants to compensate labor and reward validators in protocol-based labor markets, launched in 2021. RUNE, launched in 2019, functions as the native token of THORChain ecosystem, used for transaction fees, maintaining liquidity pools, and block rewards in cross-chain infrastructure.
Q2: How do the current trading volumes compare between HMT and RUNE, and what does this indicate?
RUNE demonstrates significantly higher trading volume at $278,201.11 compared to HMT's $14,034.19 in 24-hour trading activity. This substantial difference indicates RUNE maintains notably greater market liquidity and broader market participation. The lower trading volume for HMT suggests reduced immediate liquidity conditions, which may impact price execution and volatility characteristics for investors considering position entries or exits.
Q3: What are the projected price ranges for HMT and RUNE through 2031?
For HMT, conservative forecasts suggest ranges from $0.00433-$0.00509 in 2026, potentially reaching $0.00694-$0.01295 by 2031 under optimistic scenarios. For RUNE, projections indicate $0.383-$0.648 in 2026, with potential growth to $0.725-$1.460 by 2031 in optimistic scenarios. These forecasts reflect baseline and optimistic scenarios considering institutional adoption, ecosystem expansion, and market cycle dynamics, though actual outcomes may vary significantly based on multiple unpredictable factors.
Q4: What risk considerations should investors evaluate when comparing HMT and RUNE?
Key risk considerations include market liquidity differences, with HMT showing lower trading volume suggesting higher liquidity risk. Technical risks vary by protocol focus—HMT faces network scalability considerations for labor market infrastructure, while RUNE confronts cross-chain bridge security and liquidity pool mechanism challenges. Both assets remain subject to evolving regulatory frameworks that may impact them differently based on their functional classifications. Additionally, both have experienced substantial price contractions from historical peaks, indicating significant volatility characteristics.
Q5: How might different investor profiles approach allocation between HMT and RUNE?
Conservative investors might consider a 20-30% HMT and 70-80% RUNE allocation, emphasizing RUNE's higher liquidity and established market presence. Aggressive investors with higher risk tolerance might allocate 40-50% to HMT and 50-60% to RUNE, reflecting growth orientation toward emerging protocol applications. All investor profiles should maintain stablecoin reserves for portfolio balance and implement cross-asset diversification strategies. Comprehensive due diligence on protocol architecture, adoption metrics, and competitive positioning remains essential regardless of risk profile.
Q6: What factors historically influenced the price peaks for HMT and RUNE?
HMT reached $1.37 in August 2021, while RUNE achieved approximately $20.87 in May 2021, both during periods of broader market expansion and increased capital inflows to cryptocurrency assets. These peaks occurred during similar market cycle conditions characterized by heightened investor interest in decentralized protocols and alternative blockchain applications. The subsequent significant contractions from these levels—HMT to approximately $0.005093 and RUNE to $0.5192—reflect broader market cycle transitions and shifting demand dynamics across the cryptocurrency sector.
Q7: What technological ecosystem factors differentiate HMT from RUNE?
HMT's ecosystem centers on protocol-based labor markets enabling automated job distribution, compensation mechanisms, and validator reward systems for human-machine collaborative workflows. RUNE's ecosystem focuses on cross-chain liquidity infrastructure, enabling decentralized exchange functionality across different blockchain networks through liquidity pools and interoperability protocols. While both represent infrastructure-layer protocols, their applications address distinct market needs—HMT targeting decentralized work coordination and RUNE addressing cross-chain asset exchange and liquidity provisioning challenges.
Q8: What does the current Fear & Greed Index reading of 26 suggest for investment timing?
A Fear & Greed Index reading of 26 indicates "Fear" sentiment prevailing in the market as of January 30, 2026. This metric suggests market participants exhibit cautious or pessimistic positioning, which historically has preceded both continued downward pressure and potential reversal opportunities depending on broader market catalysts. For contrarian investors, fear readings may indicate potential accumulation opportunities, while risk-averse participants might interpret this as validation for maintaining defensive positioning or awaiting clearer positive momentum signals before establishing or expanding positions.
* The information is not intended to be and does not constitute financial advice or any other recommendation of any sort offered or endorsed by Gate.