This comprehensive guide introduces beginners to cryptocurrency candlestick charts, essential tools for analyzing market trends on Gate exchange and other platforms. Learn how candlestick components—body, wicks, timeframes, and price axes—reveal bullish and bearish price movements. Discover key patterns like Doji, Morning Star, Hammer, and Engulfing that signal potential trend reversals. Master reading charts by identifying overall trends, recognizing patterns, and analyzing volume and support/resistance levels. Combine candlestick analysis with technical indicators such as Moving Averages, RSI, and Fibonacci Retracement for accurate trading signals. Avoid critical mistakes including over-relying on patterns, neglecting stop-loss orders, and ignoring market trends. By integrating proper risk management, discipline, and multi-indicator confirmation, traders can develop effective strategies and improve trading success in volatile cryptocurrency markets.
The Importance of Candlestick Charts in Crypto Trading
Candlestick charts are essential tools in crypto trading because they provide a clear visual representation of price movements, making it easier for traders to identify patterns and make informed decisions. In the volatile and rapidly changing world of cryptocurrency trading, having the right analytical tools is crucial for understanding market movements and trends.
These charts give you immediate visual feedback on whether current price action is bullish (rising) or bearish (falling) and whether the trend is strengthening or weakening. This real-time insight allows traders to respond quickly to market changes and adjust their strategies accordingly. The visual nature of candlestick charts makes complex price data more digestible, especially for traders who need to make split-second decisions in fast-moving markets.
Furthermore, candlestick charts help you identify key support and resistance levels, which are invaluable for setting stop-loss (SL) and take-profit (TP) orders. By recognizing these critical price levels, traders can better manage their risk exposure and protect their capital while maximizing potential profits. The ability to quickly spot trend reversals and continuation patterns gives traders a significant advantage in timing their market entries and exits.
Components of Candlestick Charts
Candlestick charts consist of several key components that provide valuable information to traders. Understanding each element is fundamental to effectively reading and interpreting market data.
Time Frame
Candlestick charts represent price movements within specific time frames, which can range from minutes to months. The time frame you choose depends on your trading preferences and strategy. Day traders might focus on 5-minute or 15-minute charts, while swing traders may prefer daily or weekly charts. Each candlestick represents one complete period within your chosen time frame, capturing all the price action that occurred during that interval.
X-Axis
The x-axis on a candlestick chart represents the time period being analyzed. Each candlestick corresponds to a specific period, such as one hour, day, or week. This horizontal timeline allows traders to track how price patterns develop over time and identify temporal relationships between different market movements. The chronological arrangement helps in recognizing recurring patterns and seasonal trends.
Y-Axis
The y-axis on a candlestick chart represents the price range for the given time frame. This range is typically displayed in dollars, euros, or other currencies, depending on the trading pair being analyzed. The vertical scale allows traders to quickly assess the magnitude of price movements and compare relative price levels across different time periods.
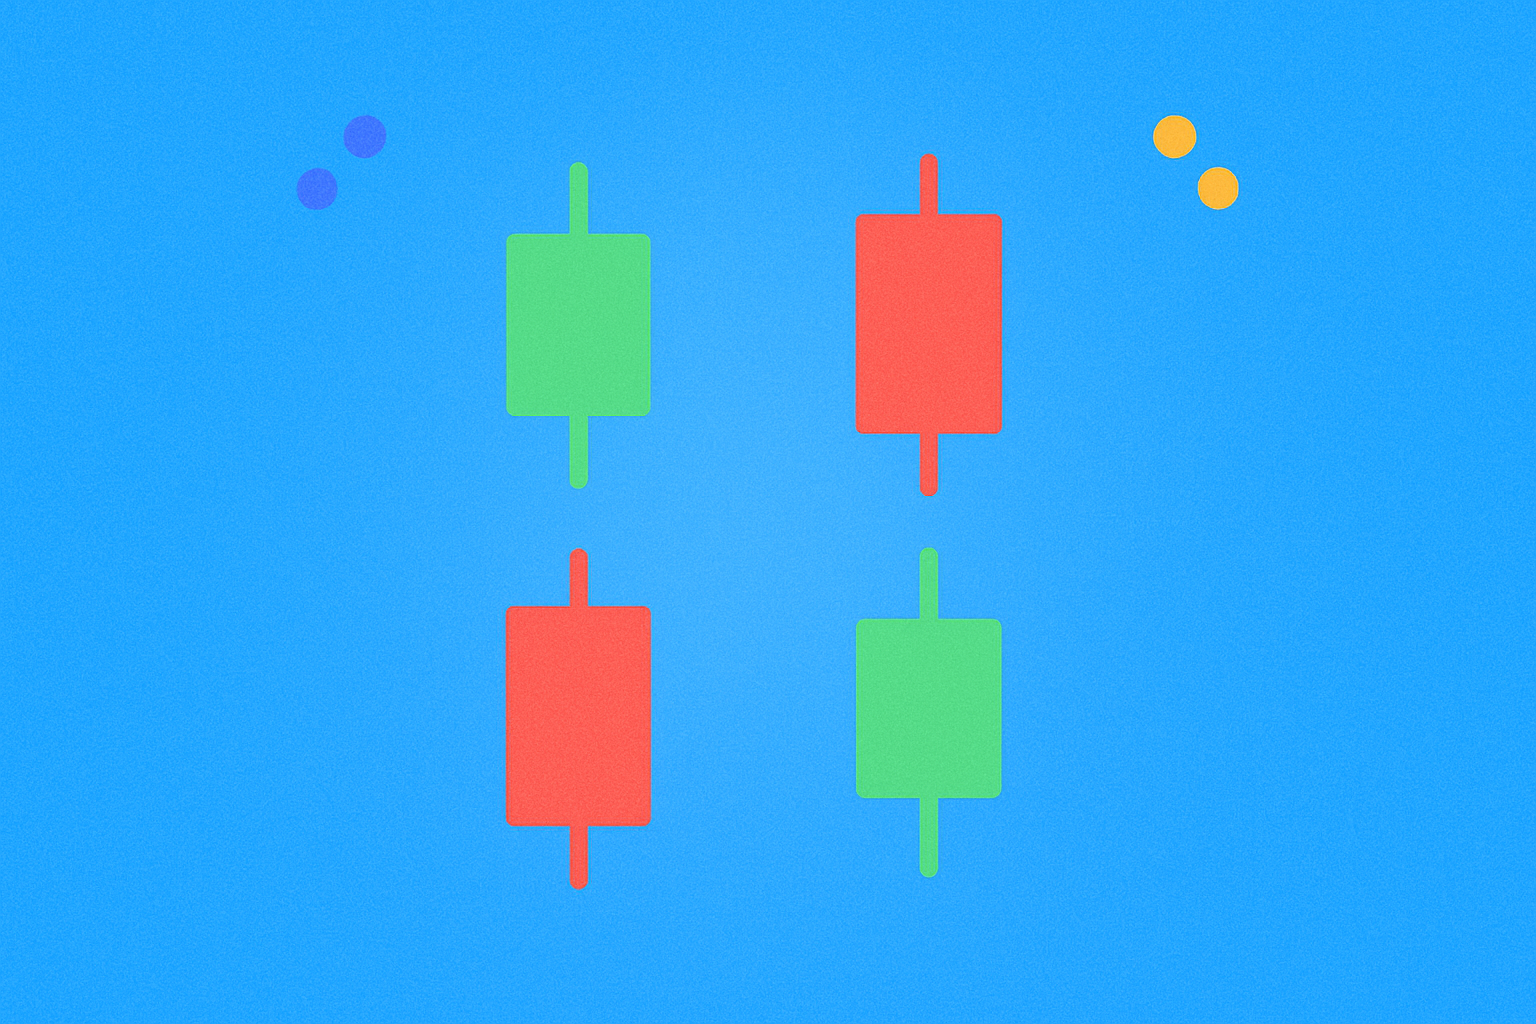
Body
The body of a candlestick represents the opening and closing prices for a given time frame. The color of the body indicates whether the period was bullish (market rising) or bearish (market falling). A green or white body indicates an upward market trend, where the closing price is higher than the opening price. Conversely, a red or black body indicates a downward market trend, where the closing price is lower than the opening price. The size of the body reflects the strength of buying or selling pressure during that period.
Wicks
Wicks, also known as shadows or tails, represent the highest and lowest prices reached during the given time frame. The length of the wicks indicates the price range for that period. Long upper wicks suggest that buyers pushed prices higher but sellers drove them back down, while long lower wicks indicate that sellers pushed prices lower but buyers stepped in to drive them back up. Analyzing wick patterns helps traders understand the battle between buyers and sellers.
Common Candlestick Patterns
Candlestick patterns are important for identifying potential crypto market trends and making informed trading decisions. Recognizing these patterns can significantly improve your trading accuracy. Here are some common candlestick patterns you should know:
Doji
This is a candlestick with a small body and long wicks, indicating uncertainty in the market. A Doji pattern can signal a potential reversal or continuation of the current trend. It forms when opening and closing prices are virtually equal, suggesting indecision between buyers and sellers. Doji patterns are particularly significant when they appear after extended trends, as they may indicate exhaustion and potential reversal.
Morning Star
This bullish reversal pattern occurs after a downtrend. It consists of three candlesticks: a long bearish candle, a small candle with a short body and long wicks, and a long bullish candle. The pattern suggests that selling pressure is diminishing and buyers are regaining control. The middle candle represents the transition period where neither buyers nor sellers dominate, followed by strong buying pressure in the third candle.
Evening Star
This bearish reversal pattern occurs after an uptrend. It consists of three candlesticks: a long bullish candle, a small candle with a short body and long wicks, and a long bearish candle. This pattern indicates that buying momentum is fading and sellers are taking control of the market. Traders often use this pattern as a signal to close long positions or initiate short positions.
Harami
A Harami pattern occurs when a small candle with a short body is contained within the body of a larger preceding candle. This pattern can indicate a potential reversal or continuation of the current trend. The term "Harami" means "pregnant" in Japanese, referring to the visual appearance of a smaller candle inside a larger one. This pattern suggests a pause in the current trend and potential shift in market sentiment.
Bullish and Bearish Patterns
Candlestick patterns can be classified as bullish or bearish, depending on whether they indicate a potential upward or downward trend in the market. Understanding these patterns helps traders anticipate market direction and position themselves accordingly.
Bullish Patterns
Hammer
This is a bullish reversal pattern that typically occurs at the bottom of a downtrend. The Hammer pattern is characterized by a small body and a long lower wick, indicating that buyers have stepped in and pushed prices higher. The long lower wick shows that despite significant selling pressure during the period, buyers were strong enough to push prices back up near the opening level. This demonstrates a potential shift from bearish to bullish sentiment.
Bullish Engulfing
A bullish engulfing pattern occurs when a large bullish candle follows a small bearish candle, completely engulfing its body. This pattern indicates that buyers have overwhelmed sellers and are pushing prices higher. The larger the engulfing candle, the stronger the bullish signal. This pattern is particularly powerful when it appears at support levels or after extended downtrends.
Three White Soldiers
This pattern occurs when three consecutive bullish candlesticks appear on the chart. It indicates a strong upward trend and is a bullish signal. Each candle should open within the previous candle's body and close progressively higher. This pattern demonstrates sustained buying pressure and strong bullish momentum, often marking the beginning of significant upward price movements.
Bearish Patterns
Shooting Star
This is a bearish reversal pattern that occurs at the top of an uptrend. The candlestick is characterized by a small body and a long upper wick, indicating that sellers have stepped in and pushed prices lower. The long upper wick shows that although buyers pushed prices significantly higher during the period, sellers were strong enough to drive prices back down near the opening level, suggesting a potential trend reversal.
Bearish Engulfing
A bearish engulfing pattern occurs when a large bearish candle follows a small bullish candle, completely engulfing its body. This pattern indicates that sellers have overwhelmed buyers and are pushing prices lower. The pattern is especially significant when it appears at resistance levels or after extended uptrends, often signaling the beginning of a downward trend.
Three Black Crows
This pattern occurs when three consecutive bearish candlesticks appear on the chart. It indicates a strong downward trend and is a bearish signal. Each candle should open within the previous candle's body and close progressively lower. This pattern demonstrates sustained selling pressure and strong bearish momentum, often marking the beginning of significant downward price movements.
Understanding these and other bullish and bearish patterns will help you gain valuable insights into market trends and potential trading opportunities. However, it's important to note that candlestick patterns should be used in conjunction with technical indicators and other market analysis tools for more reliable trading signals.
Reading Candlestick Charts for Trading
Candlestick charts provide valuable insights into market trends that you can use to make smarter trading decisions. Mastering the art of reading these charts is essential for successful crypto trading. Here's how to use candlestick charts to identify trends:
1. Identify the Overall Trend
The first step is to identify the overall market trend. Generally, is the price trending upward, downward, or moving sideways? This can be determined by looking at long-term charts and identifying whether they are forming higher highs or lower lows. Understanding the broader trend context helps you align your trades with the dominant market direction, increasing your probability of success.
2. Look for Patterns
Next, look for patterns in the candlestick chart that indicate trend strength. Bullish patterns like hammers, bullish engulfing patterns, or Morning Stars indicate upward trends. Conversely, bearish patterns like shooting stars, bearish engulfing patterns, or Evening Stars indicate downward trends. Recognizing these patterns early allows you to enter trades at optimal points and avoid false signals.
3. Check Volume
Volume is an important factor in determining trend strength. High trading volume during a particular candlestick period indicates that the trend is likely to continue. Volume confirmation adds credibility to price movements and helps distinguish between genuine trends and temporary price fluctuations. When significant price movements occur on high volume, it suggests strong conviction among market participants.
4. Identify Support and Resistance Levels
This can help traders identify potential entry and exit points. These levels can be identified by looking for areas where prices have previously bounced back up (support) or fallen back down (resistance). Support and resistance levels act as psychological barriers where buying or selling pressure tends to increase. Understanding these levels helps you set realistic price targets and manage risk effectively.
Combining Candlestick Patterns with Other Technical Indicators
While candlestick patterns are powerful tools for analyzing market trends, they should not be used in isolation. To get a comprehensive view of the market, you should combine candlestick patterns with other technical indicators. This multi-indicator approach provides confirmation and reduces the likelihood of false signals. Here are some common technical indicators that can be used alongside candlestick patterns:
Moving Averages
Moving averages are used to smooth price data and identify trends. By combining moving averages with candlestick patterns, you can confirm potential entry and exit points and develop more effective trading strategies. For example, a bullish candlestick pattern appearing above a rising moving average provides stronger confirmation of an uptrend. Common moving averages include the 50-day and 200-day moving averages, which help identify long-term trends.
This is a momentum indicator that measures the strength of a trend. By combining RSI with candlestick patterns, you can identify oversold or overbought conditions in the market and adjust your trading strategy accordingly. RSI values above 70 typically indicate overbought conditions, while values below 30 suggest oversold conditions. When candlestick reversal patterns align with extreme RSI readings, the probability of a trend reversal increases significantly.
Fibonacci Retracement
Fibonacci retracement levels are used to identify potential support and resistance levels. By combining Fibonacci retracement levels with candlestick patterns, you will be better able to develop accurate predictions about market trends and potential entry and exit points. These levels are based on the mathematical relationships found in nature and are widely respected by traders. Common retracement levels include 38.2%, 50%, and 61.8%, which often act as key turning points in price movements.
Volume Indicators
Volume indicators provide valuable insights into trend strength. By combining volume indicators with candlestick patterns, you can confirm potential entry and exit points and develop more effective trading strategies. Volume indicators like On-Balance Volume (OBV) and Volume Weighted Average Price (VWAP) help traders understand the conviction behind price movements. High volume accompanying bullish candlestick patterns suggests strong buying pressure, while high volume with bearish patterns indicates strong selling pressure.
Meanwhile, by combining candlestick patterns with other technical indicators, you can gain a more comprehensive view of the crypto market and make informed trading decisions. This integrated approach helps filter out false signals and increases your overall trading accuracy.
Common Mistakes to Avoid
While candlestick charts can provide valuable insights into market trends, there are several common mistakes you should avoid when using them. Being aware of these pitfalls can save you from costly trading errors:
Over-Relying on Candlestick Patterns
Candlestick patterns are just one tool in a trader's toolbox. Over-relying on candlestick patterns while ignoring technical indicators and other market analysis can lead to inaccurate predictions and poor trading decisions. No single indicator provides a complete picture of market conditions. Successful traders use multiple confirmation methods before entering trades, combining candlestick analysis with fundamental analysis, market sentiment, and broader economic factors.
Failing to Use Stop-Loss Orders
Stop-loss orders are used to limit losses when trades don't go as expected. Failing to use stop-loss orders can result in significant losses, especially when trading in volatile markets like cryptocurrencies. Every trade should have a predetermined exit point that protects your capital from catastrophic losses. Stop-loss orders help remove emotional decision-making from trading and enforce disciplined risk management.
Failing to Practice Proper Risk Management
Proper risk management is essential for trading success. You should not risk losses beyond your capacity and should always have a plan to manage risk. This includes position sizing, diversification, and never risking more than a small percentage of your trading capital on any single trade. Professional traders typically risk no more than 1-2% of their account on individual trades, ensuring that a series of losses won't devastate their trading capital.
Ignoring Market Trends
Ignoring market trends can lead to poor trading decisions. Therefore, it's important to pay attention to overall market trends and use them as the basis for your trading strategy. Trading against the dominant trend significantly reduces your probability of success. The saying "the trend is your friend" exists for good reason – aligning your trades with the prevailing market direction increases your chances of profitable outcomes.
Conclusion
Candlestick charts are powerful crypto trading tools for analyzing market trends and making informed trading decisions. By identifying common candlestick patterns and using candlestick charts alongside technical indicators and other market analysis, you can gain valuable insights into the market and develop effective trading strategies.
However, it's important to remember that no single indicator or tool can guarantee trading success. Proper risk management, discipline, and commitment to continuous learning and improvement are essential for trading success. The cryptocurrency market is constantly evolving, and successful traders adapt their strategies based on changing market conditions.
By avoiding common mistakes such as over-relying on candlestick patterns, failing to use stop-loss orders, and ignoring market trends, you can improve your chances of success and achieve your trading goals. Consistent practice, ongoing education, and maintaining realistic expectations will help you develop into a more skilled and profitable trader over time.
FAQ
What do the open price, close price, high price, and low price on a candlestick chart represent respectively?
Open price is the initial trading price at the period's start. Close price is the final trading price at the period's end. High price represents the highest price reached during the period. Low price represents the lowest price reached during the period.
How to identify bullish and bearish signals in candlestick charts?
Bullish candles have long bodies with prices rising; bearish candles have long shadows with prices falling. Key bullish signals include hammer patterns and bullish engulfing formations. Watch for these patterns to identify potential uptrends and trading opportunities.
What are key candlestick patterns such as hammer, engulfing, and doji, and their trading significance?
Hammer signals bullish reversal with small body and long lower wick. Engulfing shows trend reversal when one candle completely covers the previous. Doji indicates market uncertainty with equal open-close prices. These patterns help predict potential price reversals and continuations.
How to use support and resistance levels to assist in candlestick chart analysis?
Support and resistance levels identify key price turning points. Support prevents further price declines through buyer strength, while resistance prevents further increases through seller pressure. Use these levels to determine optimal entry and exit points for trades.
What are the differences between candlestick charts at different time intervals (1-minute, 1-hour, 1-day) in crypto trading?
Different timeframes show price movements at varying scales. 1-minute charts capture short-term volatility, 1-hour charts display medium-term trends, and 1-day charts reveal long-term patterns. Each candlestick represents open, close, high, and low prices for that period.
How should candlestick charts be used together with other technical indicators like moving averages and RSI?
Combine candlestick patterns with moving averages and RSI for better accuracy. When RSI is elevated and moving averages trend upward, it signals strong momentum. Use these indicators together to identify optimal entry and exit points for crypto trading.
How should beginners avoid common mistakes in candlestick chart analysis?
Beginners should avoid relying solely on candlestick patterns and must pay attention to trading volume. Volume confirms the authenticity of candlestick signals. Ignoring volume leads to incorrect judgments. Always combine price action with volume analysis for reliable trading decisions.
* The information is not intended to be and does not constitute financial advice or any other recommendation of any sort offered or endorsed by Gate.