This comprehensive guide compares HuobiToken (HT) and Cronos (CRO), two leading cryptocurrency exchange tokens, analyzing their investment potential and market dynamics. Currently, HT trades at $0.2141 with lower liquidity ($12,630 daily volume), while CRO trades at $0.09231 with significantly higher trading volume ($660,199). Both tokens have experienced substantial declines from historical peaks—HT down 80.57% and CRO down 33.69% over one year—amid extreme market fear conditions. The article examines historical price trends, supply mechanisms, ecosystem applications, and provides forecasts through 2031, with HT projected at $0.1687-$0.4178 and CRO at $0.0516-$0.1707. Key investment considerations include market risks, liquidity differences, regulatory factors, and appropriate strategies for conservative, aggressive, and institutional investors on Gate. Both tokens warrant careful evaluation before investment decisions.
Introduction: HT Investment Value, Price Prediction, and Risk Analysis
In the cryptocurrency market, HuobiToken (HT) represents a unique category of exchange-issued tokens that serve multiple functions within a blockchain ecosystem. Since its launch in 2018, HT has evolved from a simple trading fee discount token to an integral component of the Huobi ecosystem, supporting various applications across the platform's global operations.
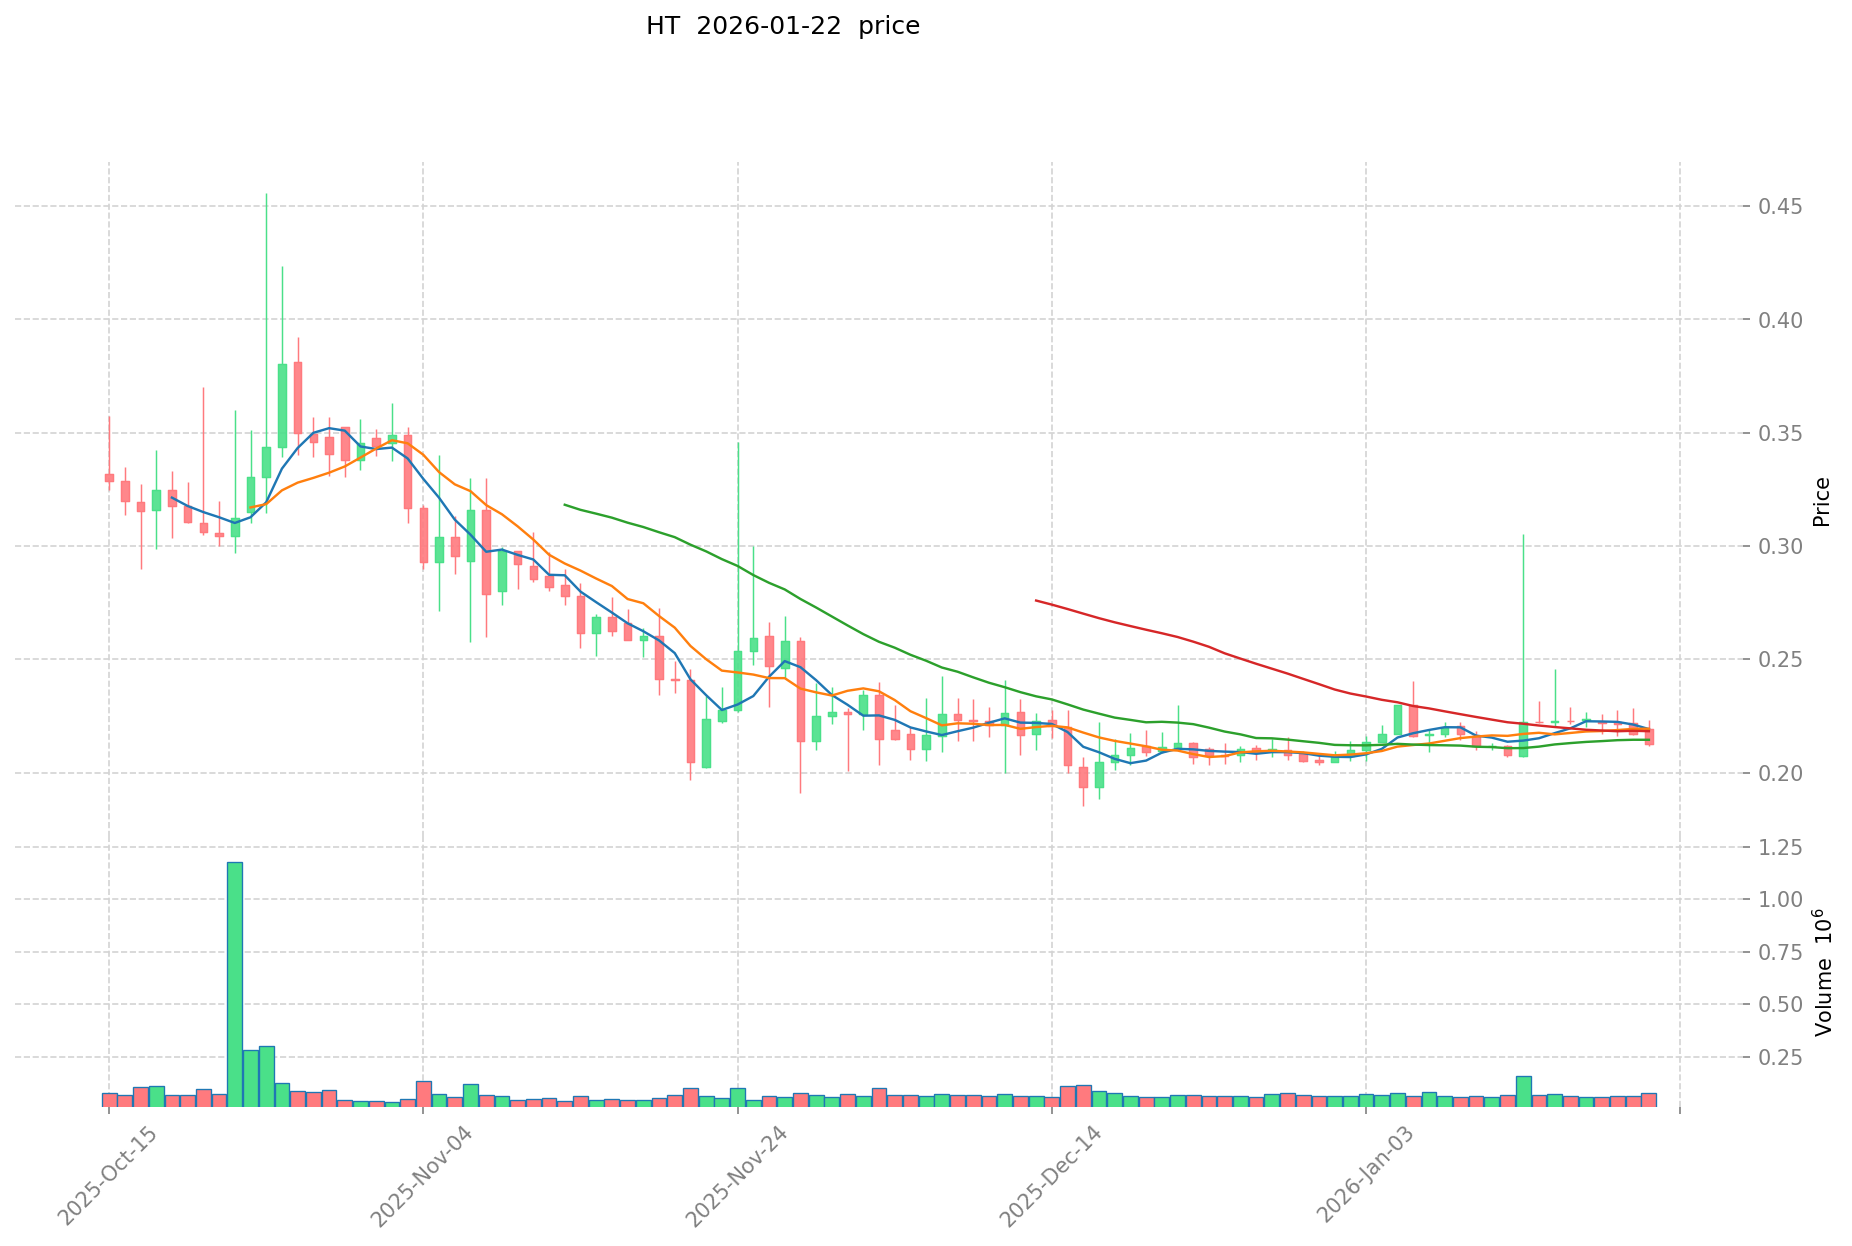
HT is a decentralized digital asset based on Ethereum, with a maximum supply capped at 500 million tokens. As of January 22, 2026, HT is trading at $0.2141, with a market capitalization of approximately $23.42 million and a market ranking of 812. The token's circulating supply stands at approximately 109.4 million tokens, representing 21.88% of its total supply.
This article provides a comprehensive analysis of HT's investment potential, covering historical price performance, supply mechanisms, ecosystem applications, and future outlook. We will address key questions that investors commonly consider:
"What factors influence HT's price movement?"
"How does HT's utility within the Huobi ecosystem affect its value?"
"What are the potential risks and opportunities for HT investors?"
Through examining price trends, token economics, platform developments, and market dynamics, this analysis aims to provide investors with a detailed understanding of HT's investment characteristics and help inform decision-making in the context of the broader cryptocurrency market.
I. Historical Price Comparison and Current Market Status
Price Trend History of HT (Coin A) and CRO (Coin B)
- 2021: HT reached a price of 39.66 on May 12, 2021, representing a historical peak during the market bull cycle.
- 2021: CRO experienced significant price movement, reaching a historical high of 0.965407 on November 24, 2021, driven by ecosystem expansion and platform development.
- 2025: HT recorded a historical low of 0.145929 on June 22, 2025, reflecting substantial price decline during market correction.
- Comparative Analysis: During the market cycle from 2021 to 2025, HT declined from its peak of 39.66 to a low of 0.145929, demonstrating approximately 99.6% decline, while CRO experienced a decline from 0.965407 to its historical low of 0.0121196 recorded in February 2019, showing different volatility patterns across market cycles.
Current Market Situation (January 22, 2026)
- HT Current Price: 0.2141 USD
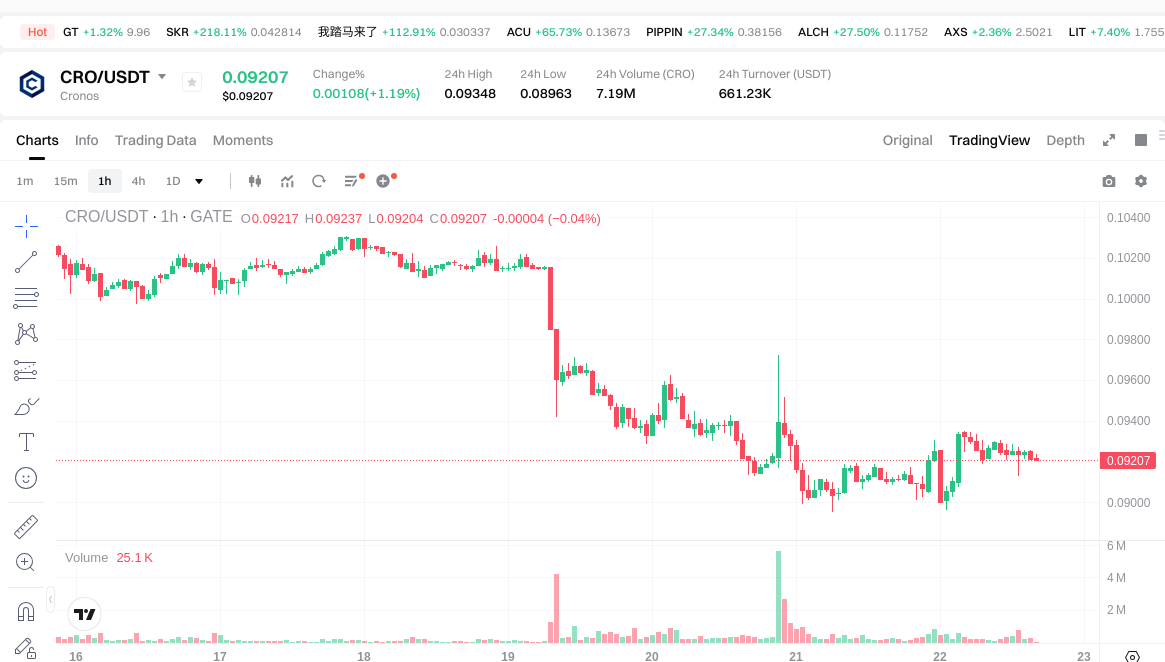
- CRO Current Price: 0.09231 USD
- 24-Hour Trading Volume: HT at 12,630.03 USD vs CRO at 660,199.22 USD
- Market Sentiment Index (Fear & Greed Index): 20 (Extreme Fear)
- 24-Hour Price Change: HT up 0.8% vs CRO up 1.49%
- 7-Day Performance: HT down 3.86% vs CRO down 9.76%
- 1-Year Performance: HT down 80.57% vs CRO down 33.69%
View real-time prices:
II. Core Factors Affecting HT vs CRO Investment Value
Supply Mechanism Comparison (Tokenomics)
- HT: Information regarding the specific supply mechanism is not available in the provided materials.
- CRO: Information regarding the specific supply mechanism is not available in the provided materials.
Institutional Adoption and Market Application
- Institutional Holdings: Data on institutional preference between HT and CRO is not available in the provided materials.
- Enterprise Adoption: Information comparing HT and CRO applications in cross-border payments, settlements, and investment portfolios is not available in the provided materials.
- National Policies: Details on regulatory attitudes toward both assets across different jurisdictions are not available in the provided materials.
Technological Development and Ecosystem Building
- HT Technical Upgrades: Information on recent or planned technical upgrades and their potential impact is not available in the provided materials.
- CRO Technical Development: Information on recent or planned technical developments and their potential impact is not available in the provided materials.
- Ecosystem Comparison: Data comparing DeFi, NFT, payment, and smart contract implementations between HT and CRO ecosystems is not available in the provided materials.
Macroeconomic Environment and Market Cycles
- Performance in Inflationary Environment: Information on which asset demonstrates stronger inflation-resistant properties is not available in the provided materials.
- Macroeconomic Monetary Policy: Data on how interest rates and the US Dollar Index affect both assets is not available in the provided materials.
- Geopolitical Factors: Information on cross-border transaction demand and international circumstances affecting both assets is not available in the provided materials.
III. 2026-2031 Price Forecast: HT vs CRO
Short-term Forecast (2026)
- HT: Conservative $0.1687 - $0.2136 | Optimistic $0.2136 - $0.2884
- CRO: Conservative $0.0516 - $0.0922 | Optimistic $0.0922 - $0.1226
Mid-term Forecast (2028-2029)
- HT may enter a consolidation phase, with projected prices ranging from $0.1403 to $0.3302
- CRO may enter a growth phase, with projected prices ranging from $0.0692 to $0.1517
- Key drivers: institutional capital inflows, ETF developments, ecosystem expansion
Long-term Forecast (2030-2031)
- HT: Base scenario $0.2482 - $0.3602 | Optimistic scenario $0.3602 - $0.4178
- CRO: Base scenario $0.1031 - $0.1498 | Optimistic scenario $0.1498 - $0.1707
View detailed price predictions for HT and CRO
Disclaimer
HT:
| Year |
Predicted High Price |
Predicted Average Price |
Predicted Low Price |
Price Change |
| 2026 |
0.28836 |
0.2136 |
0.168744 |
0 |
| 2027 |
0.288627 |
0.25098 |
0.2359212 |
17 |
| 2028 |
0.28059564 |
0.2698035 |
0.14029782 |
26 |
| 2029 |
0.330239484 |
0.27519957 |
0.2284156431 |
28 |
| 2030 |
0.41775294726 |
0.302719527 |
0.24823001214 |
41 |
| 2031 |
0.396259860843 |
0.36023623713 |
0.2845866273327 |
68 |
CRO:
| Year |
Predicted High Price |
Predicted Average Price |
Predicted Low Price |
Price Change |
| 2026 |
0.1225994 |
0.09218 |
0.0516208 |
0 |
| 2027 |
0.135311022 |
0.1073897 |
0.104168009 |
16 |
| 2028 |
0.15168795125 |
0.121350361 |
0.06916970577 |
31 |
| 2029 |
0.14607549705375 |
0.136519156125 |
0.10785013333875 |
48 |
| 2030 |
0.1582530057801 |
0.141297326589375 |
0.103147048410243 |
53 |
| 2031 |
0.1707436894506 |
0.149775166184737 |
0.133299897904416 |
62 |
IV. Investment Strategy Comparison: HT vs CRO
Long-term vs Short-term Investment Strategies
-
HT: May appeal to investors focusing on exchange token fundamentals and platform-specific utility, though the token has experienced substantial price decline from historical levels. The limited trading volume of $12,630.03 in 24 hours suggests lower liquidity considerations for position sizing.
-
CRO: May attract investors interested in ecosystem expansion and broader market applications, with relatively higher trading volume of $660,199.22 in 24 hours indicating potentially better liquidity for entry and exit positions.
Risk Management and Asset Allocation
-
Conservative Investors: Consider limited exposure given the current Extreme Fear market sentiment (Fear & Greed Index: 20). A cautious approach might involve minimal allocation to exchange tokens, with HT representing higher volatility risk given its 80.57% decline over one year compared to CRO's 33.69% decline.
-
Aggressive Investors: May consider higher allocation to assets showing recovery potential, though both tokens demonstrate negative performance over recent periods. Position sizing should account for the significant price volatility demonstrated in historical data.
-
Hedging Tools: Diversification across stablecoins, consideration of derivatives for downside protection, and cross-asset portfolio construction may help manage exposure to exchange token volatility.
V. Potential Risk Comparison
Market Risk
-
HT: The token has declined approximately 99.6% from its May 2021 peak of $39.66 to its June 2025 low of $0.145929, demonstrating substantial market risk and volatility. Current trading at $0.2141 remains significantly below historical levels, with a 7-day decline of 3.86% and 1-year decline of 80.57%.
-
CRO: Experienced a decline from its November 2021 peak of $0.965407, showing market cycle sensitivity. Recent performance indicates a 9.76% decline over 7 days and 33.69% decline over 1 year, reflecting ongoing market pressure though relatively less severe than HT.
Technical Risk
-
HT: Specific technical development information and upgrade schedules are not available in current materials. The relatively low trading volume may present liquidity challenges during market stress periods.
-
CRO: Technical infrastructure details and development roadmap information are not available in current materials. Investors should conduct independent research on network stability and scalability considerations.
Regulatory Risk
- Exchange-issued tokens face regulatory considerations across different jurisdictions. Both HT and CRO operate within the framework of their respective platforms, which may be subject to evolving regulatory requirements. Investors should monitor regulatory developments in key markets that may affect exchange operations and token utility.
VI. Conclusion: Which Is the Better Buy?
📌 Investment Value Summary:
-
HT Considerations: Currently trading at $0.2141 with a market cap of approximately $23.42 million and market ranking of 812. The token shows a circulating supply of 21.88% of total supply. Price forecasts suggest potential ranges from $0.1687 to $0.4178 through 2031, though historical performance indicates substantial volatility.
-
CRO Considerations: Currently trading at $0.09231 with relatively higher trading volume compared to HT. Price forecasts suggest potential ranges from $0.0516 to $0.1707 through 2031. The token demonstrates different market dynamics with less severe recent declines compared to HT.
✅ Investment Considerations:
-
New Investors: Given the current Extreme Fear market sentiment (Index: 20) and substantial price declines for both tokens, new investors should approach exchange tokens with caution. Consider starting with smaller positions and prioritizing education on exchange token mechanics and platform fundamentals.
-
Experienced Investors: May evaluate both tokens based on their respective platform developments, ecosystem growth, and recovery potential. The significant difference in trading volumes and price performance suggests different risk-reward profiles requiring careful analysis.
-
Institutional Investors: Should conduct comprehensive due diligence on platform fundamentals, regulatory positioning, and long-term viability of exchange token models. The substantial price declines and varying liquidity levels require careful consideration for position sizing.
⚠️ Risk Warning: The cryptocurrency market exhibits extreme volatility. This article does not constitute investment advice. Both HT and CRO have demonstrated substantial price declines from historical peaks, and past performance does not guarantee future results. Investors should conduct independent research and consider their risk tolerance before making investment decisions.
VII. FAQ
Q1: What are the main differences between HT and CRO as exchange tokens?
HT and CRO represent different exchange ecosystems with distinct market positions and performance characteristics. HT is the native token of the Huobi platform, currently trading at $0.2141 with a market cap of approximately $23.42 million and a circulating supply of 21.88% (109.4 million tokens out of 500 million maximum supply). CRO, associated with the Crypto.com platform, trades at $0.09231 and demonstrates significantly higher trading volume ($660,199.22 vs HT's $12,630.03 in 24 hours), indicating greater liquidity. The most notable difference lies in their recent performance: HT has declined 80.57% over one year compared to CRO's 33.69% decline, reflecting different levels of market pressure and investor sentiment toward each platform.
Q2: How have HT and CRO performed during the recent market cycle?
Both tokens have experienced substantial declines from their historical peaks, though with different magnitudes. HT reached its all-time high of $39.66 on May 12, 2021, and subsequently fell to a historical low of $0.145929 on June 22, 2025, representing approximately a 99.6% decline. CRO achieved its peak of $0.965407 on November 24, 2021, during a period of ecosystem expansion. As of January 22, 2026, both tokens show negative short-term performance with HT down 3.86% over 7 days and CRO down 9.76% over the same period, reflecting ongoing market challenges amid an Extreme Fear sentiment environment (Fear & Greed Index: 20).
Q3: What are the price forecasts for HT and CRO through 2031?
Price forecasts suggest different trajectories for both tokens. For HT, short-term 2026 predictions range from a conservative $0.1687-$0.2136 to an optimistic $0.2136-$0.2884, with long-term 2030-2031 forecasts projecting a base scenario of $0.2482-$0.3602 and an optimistic scenario of $0.3602-$0.4178. CRO's forecasts are more modest, with 2026 conservative estimates of $0.0516-$0.0922 and optimistic projections of $0.0922-$0.1226, extending to long-term 2030-2031 forecasts of $0.1031-$0.1498 (base scenario) and $0.1498-$0.1707 (optimistic scenario). These projections assume various factors including institutional capital inflows, ETF developments, and ecosystem expansion, though investors should note that forecasts are inherently uncertain and subject to market conditions.
Q4: What are the primary risks associated with investing in exchange tokens like HT and CRO?
Exchange tokens face multiple risk categories that investors should carefully evaluate. Market risk is particularly significant, as demonstrated by HT's 99.6% decline from peak levels and ongoing volatility, while CRO has shown relatively better but still negative performance. Liquidity risk varies between the tokens, with HT's substantially lower trading volume ($12,630.03 vs CRO's $660,199.22) potentially creating challenges during periods of market stress. Regulatory risk affects both tokens as exchange-issued assets subject to evolving compliance requirements across different jurisdictions. Additionally, platform-specific risks tie token value to the success and operations of their respective exchanges, making them dependent on platform developments, user adoption, and competitive positioning within the broader cryptocurrency exchange landscape.
Q5: Which investment strategy is more suitable for HT versus CRO?
The appropriate investment strategy depends on investor profile and risk tolerance. Conservative investors should approach both tokens cautiously given the current Extreme Fear market sentiment and substantial historical declines, potentially limiting exposure to minimal allocations within a diversified portfolio. For those considering exchange tokens, CRO's higher trading volume suggests better liquidity for position management, while HT may appeal to investors specifically focused on Huobi platform developments despite its lower liquidity. Aggressive investors evaluating recovery potential should account for the significant performance differences, with HT showing greater volatility and risk but potentially higher upside from depressed levels, while CRO demonstrates relatively more stable recent performance. Position sizing should carefully consider the 24-hour trading volumes, with larger positions more feasible in CRO given its superior liquidity characteristics.
Q6: What factors should investors monitor when evaluating HT and CRO?
Investors should track several key metrics and developments when assessing exchange tokens. Trading volume trends are critical, as the substantial difference between HT ($12,630.03) and CRO ($660,199.22) indicates varying levels of market interest and liquidity. Market sentiment indicators, such as the current Fear & Greed Index at 20 (Extreme Fear), provide context for broader market conditions affecting both tokens. Platform-specific developments including user growth, trading volume on respective exchanges, new feature implementations, and ecosystem expansion efforts directly impact token utility and value. Regulatory developments across major jurisdictions may significantly affect exchange operations and token usage. Additionally, investors should monitor circulating supply changes, token burn mechanisms if implemented, and any adjustments to tokenomics that could influence supply-demand dynamics.
Q7: How does the circulating supply of HT compare to its total supply, and why does this matter?
HT currently has a circulating supply of approximately 109.4 million tokens, representing 21.88% of its maximum supply cap of 500 million tokens. This relatively low circulation rate means that approximately 78% of total tokens remain outside current circulation, which creates potential considerations for investors. A lower circulating supply relative to total supply can indicate significant token reserves held by the platform, team, or allocated for future use, which may be released over time and potentially affect price dynamics through increased supply. Investors should seek clarity on the token release schedule, vesting periods, and intended use of non-circulating tokens to understand potential future supply pressure. The substantial gap between circulating and total supply also means that current market capitalization calculations based on circulating supply may not fully represent the diluted valuation if all tokens were to enter circulation.
Q8: Given the current market conditions, what approach should new investors take toward HT and CRO?
New investors should adopt a cautious, educational approach to exchange tokens in the current environment. With both HT and CRO showing substantial declines from historical peaks and the market sentiment at Extreme Fear levels, new investors should prioritize understanding exchange token mechanics, platform fundamentals, and the specific utility each token provides within its ecosystem before committing capital. Starting with smaller positions allows for learning while managing risk exposure, particularly given HT's significant volatility (80.57% decline over one year) and lower liquidity. New investors should also consider that exchange tokens' value is closely tied to platform success, making research into exchange user growth, competitive positioning, and regulatory standing essential. Rather than attempting to time market bottoms, new investors might consider gradual position building if they have conviction in the long-term prospects of the underlying exchange platform, while maintaining appropriate diversification across different asset categories within their overall cryptocurrency portfolio.
* The information is not intended to be and does not constitute financial advice or any other recommendation of any sort offered or endorsed by Gate.