This comprehensive guide compares INJ and GMX, two leading decentralized exchange tokens, to help investors make informed decisions. INJ operates as an interoperable Layer-1 blockchain optimized for DeFi and Web3 applications, while GMX functions as a decentralized perpetual exchange with revenue-generating capabilities. The analysis examines historical price trends, tokenomics differences, institutional adoption, technological ecosystems, and provides price forecasts through 2031. INJ features deflationary supply mechanics through burn mechanisms, whereas GMX offers yield-generating opportunities via fee distribution to staked holders. The article addresses critical investment questions through market comparison, risk assessment across technical and regulatory dimensions, and tailored investment recommendations for novice, experienced, and institutional investors, including practical FAQ guidance on tokenomics, technical risks, and portfolio allocation strategies suitable for different risk profiles and mark
Introduction: Investment Comparison Between INJ and GMX
In the cryptocurrency market, the comparison between INJ vs GMX has consistently been a topic investors cannot overlook. These two assets show notable differences in market cap ranking, application scenarios, and price performance, representing distinct positions within the crypto asset landscape.
Injective (INJ): Since its launch in 2020, it has gained market recognition by positioning itself as an interoperable Layer-1 blockchain optimized for building DeFi and Web3 applications.
GMX (GMX): As a decentralized perpetual exchange, GMX has established itself in the derivatives trading space with its utility and governance token model.
This article will comprehensively analyze the investment value comparison of INJ vs GMX through historical price trends, supply mechanisms, institutional adoption, technical ecosystems, and future predictions, attempting to address investors' most pressing question:
"Which is the better buy right now?"
I. Historical Price Comparison and Market Status
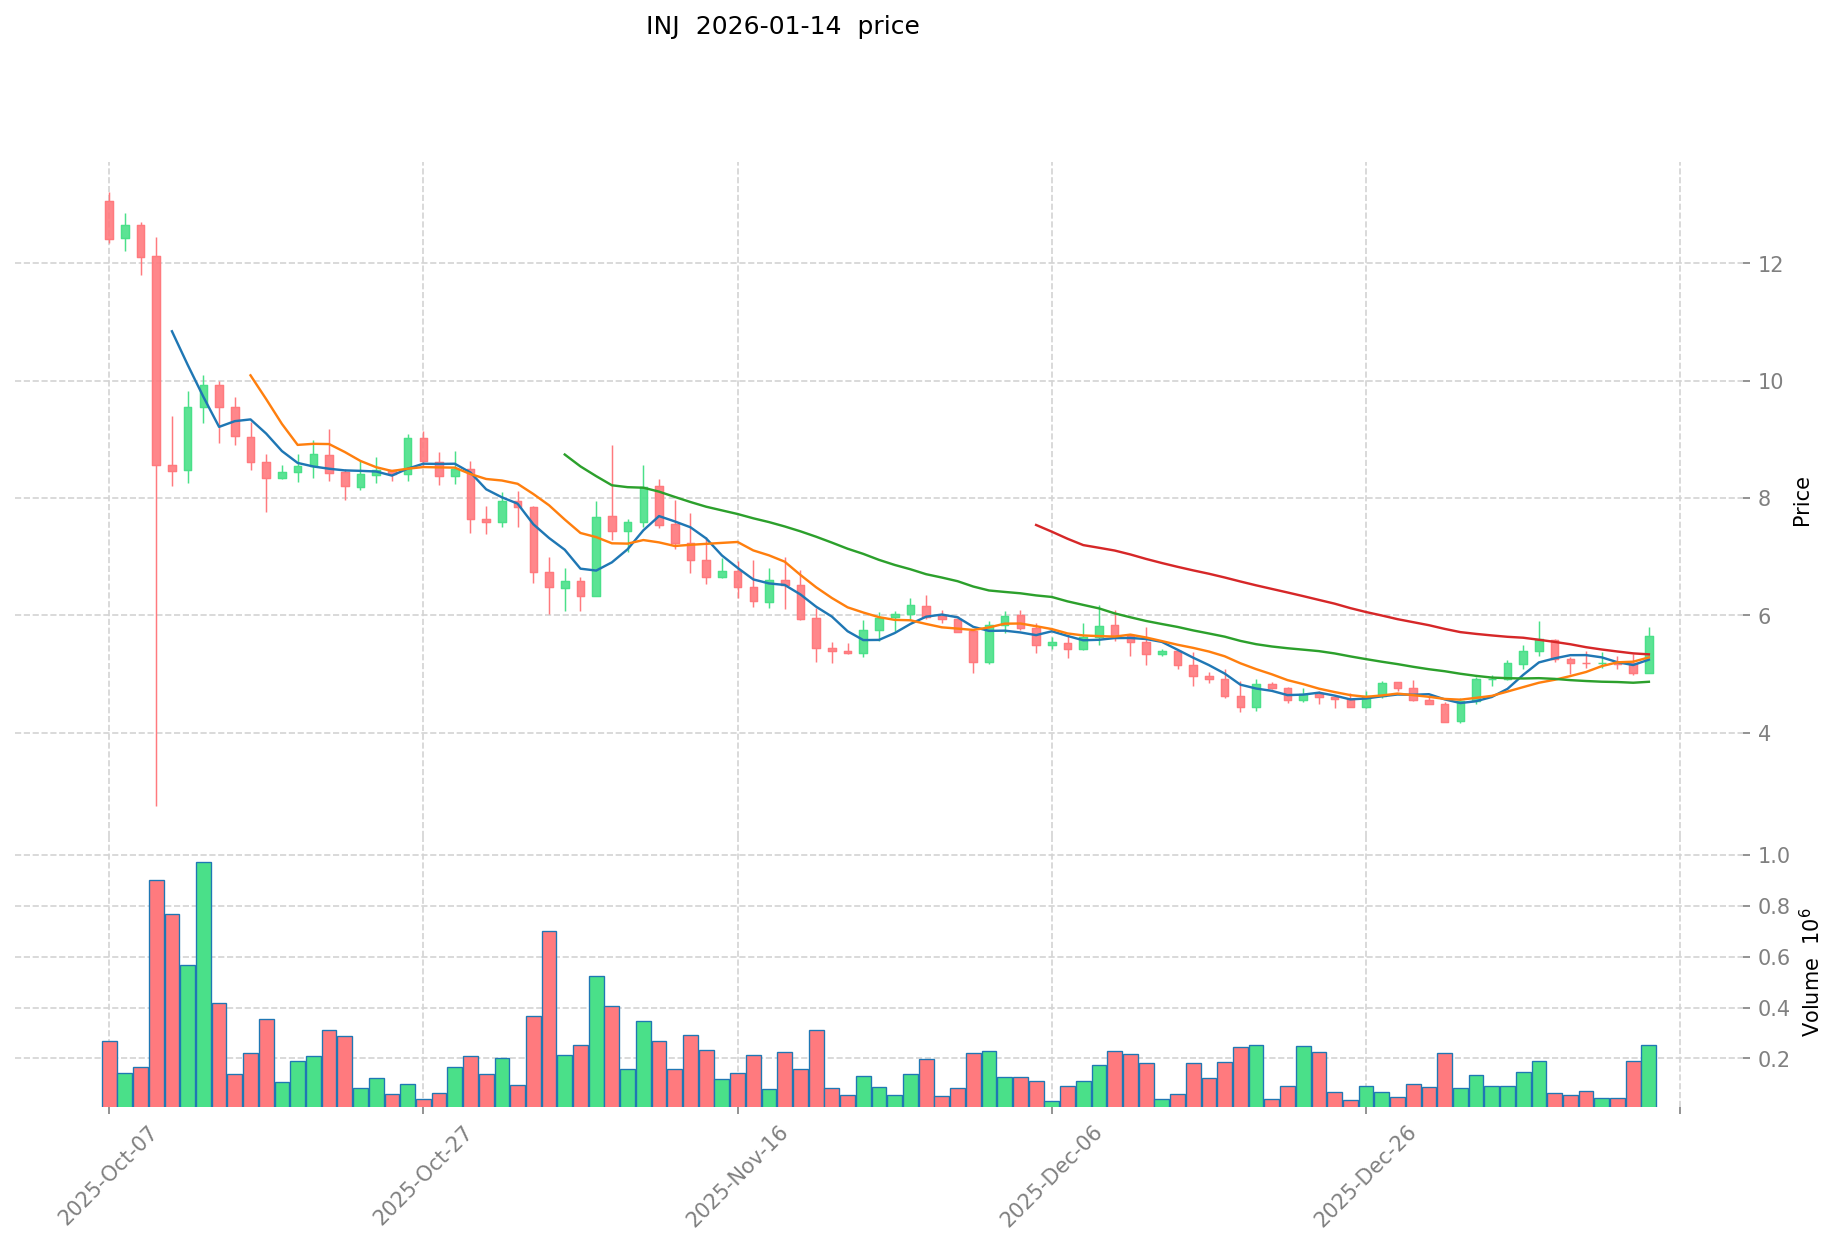
Historical Price Trends of INJ (Coin A) and GMX (Coin B)
- 2024: INJ experienced significant price volatility, reaching an all-time high of $52.62 on March 14, 2024, driven by ecosystem expansion and growing DeFi adoption. The token subsequently declined as market sentiment shifted.
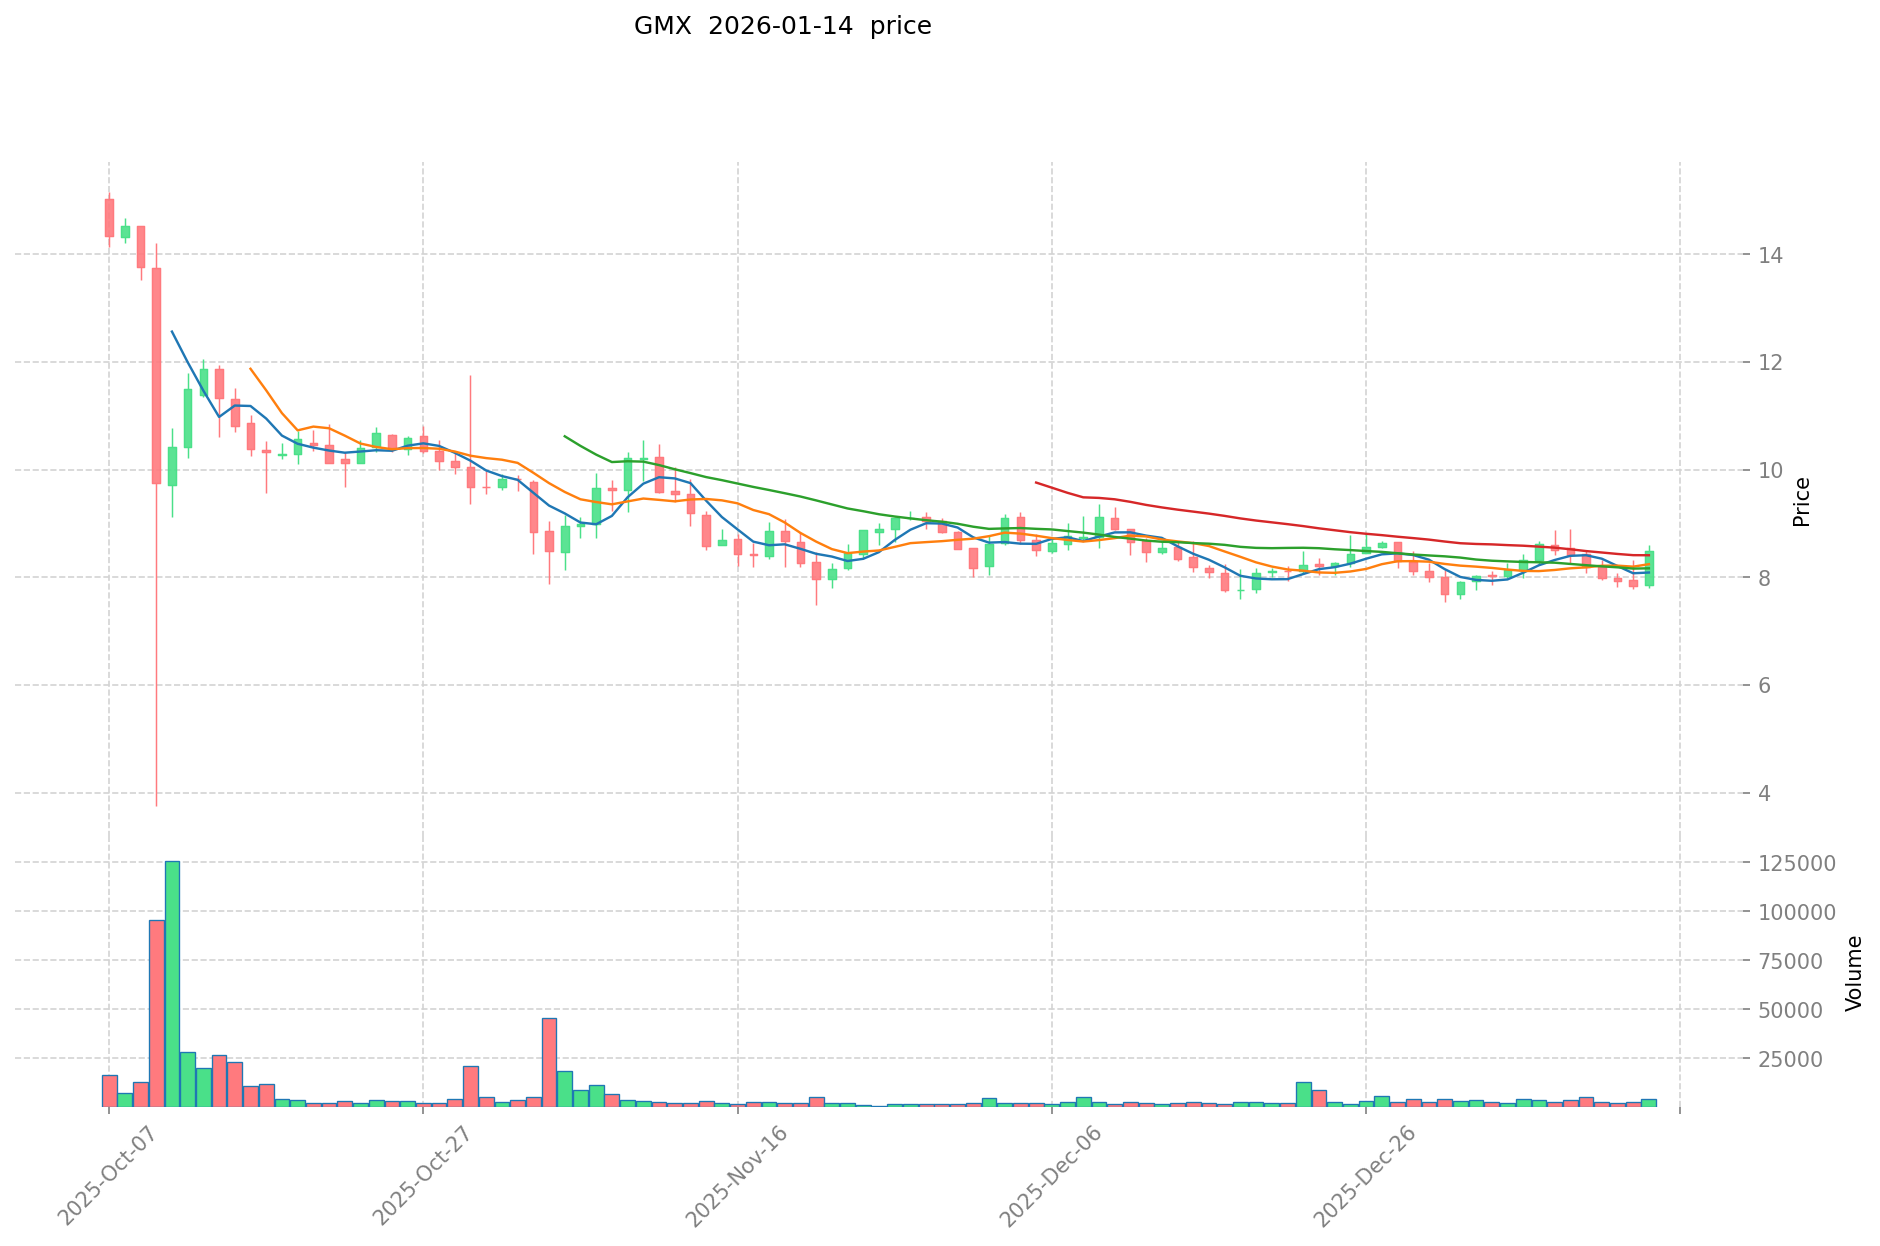
- 2023: GMX peaked at $91.07 on April 18, 2023, reflecting strong interest in decentralized perpetual exchanges. The price later corrected as the DeFi sector faced broader market pressure.
- Comparative analysis: During the 2024-2025 market cycle, INJ declined from its high of $52.62 to approximately $5.52, representing a decrease of around 89.5%. Meanwhile, GMX fell from its peak of $91.07 to approximately $8.27, marking a decline of about 90.9%. Both assets exhibited similar downward trajectories, reflecting challenges across the DeFi sector during this period.
Current Market Status (January 14, 2026)
- INJ current price: $5.519
- GMX current price: $8.269
- 24-hour trading volume: INJ recorded approximately $2.56 million vs GMX at $64,342.65
- Market sentiment index (Fear & Greed Index): 48 (Neutral)
View real-time prices:
II. Core Factors Influencing INJ vs GMX Investment Value
Supply Mechanism Comparison (Tokenomics)
-
INJ: Fixed total supply of 100 million tokens with circulation rate reaching 84.25%. The economic model incorporates a deflationary mechanism through buyback-and-burn using trading fee revenue, with an annual burn rate of approximately 3.2% following the 2025 economic model upgrade.
-
GMX: Operates a dual-token ecosystem consisting of GMX and GLP tokens. 30% of fees generated from swaps and leverage trading are converted to ETH/AVAX and distributed to staked GMX holders, while 70% goes to GLP providers. The protocol features a floor price fund mechanism that helps ensure liquidity stability.
-
📌 Historical Pattern: Supply mechanisms have influenced price dynamics differently—INJ's deflationary pressure from burn mechanisms may create scarcity-driven value appreciation, while GMX's revenue-sharing model provides yield-based value accrual for token holders.
Institutional Adoption and Market Application
-
Institutional Holdings: INJ has received backing from prominent institutions including Binance Labs and Pantera Capital, with Coinbase Custody support enhancing institutional credibility. GMX's institutional adoption data was not extensively detailed in available materials.
-
Enterprise Adoption: INJ's Injective Protocol supports cross-chain spot and futures contract trading across stocks, forex, and crypto assets through modular architecture. GMX focuses on decentralized derivatives trading with its GLP liquidity pool model, capturing substantial protocol fees within the derivatives DEX sector.
-
National Policy: Both projects operate in evolving regulatory environments. INJ has expanded through partnerships including the Chicago DeFi Alliance accelerator membership and Chainlink collaboration. Specific comparative regulatory treatment across jurisdictions was not detailed in source materials.
Technology Development and Ecosystem Building
-
INJ Technology Upgrades: Utilizes zkRollup technology for Layer-2 scaling achieving second-level settlement with significantly higher throughput than traditional Layer-1 chains. Cross-chain compatibility through Cosmos IBC, Wormhole, and Polkadot XCMP protocols. Integration of AI data sources in 2025 enhanced oracle price feed efficiency. Introduction of Real-World Assets (RWA) bond tokenization module expands application scenarios.
-
GMX Technology Development: GMX V2 launched in August 2023 introduced isolated liquidity pools (GM pools) to enhance protocol security and balance. Implemented dynamic fee mechanisms to maintain long-short position equilibrium. Partnership with Chainlink provides more timely oracle services reducing price manipulation risks. Added coin-margined contracts alongside existing USDT-margined contracts.
-
Ecosystem Comparison: INJ operates on its own execution layer allowing third-party permissionless platform construction with shared order book maximizing capital efficiency. GMX V1's GLP model simplified liquidity provision lowering participation barriers, successfully capturing organic user traffic especially following FTX collapse. Both projects demonstrate strong positioning in DeFi derivatives, though GMX V2 faced challenges maintaining growth momentum amid increased sector competition.
Macroeconomic Factors and Market Cycles
-
Performance in Inflationary Environment: DeFi derivatives trading volume represented 65% of total crypto market volume in 2025, suggesting sector growth potential. Specific inflation-hedging characteristics of INJ versus GMX were not comparatively analyzed in source materials.
-
Macroeconomic Monetary Policy: Both tokens operate within the broader cryptocurrency market influenced by interest rates and US dollar index movements. INJ showed 103.5% gains over one month during favorable market conditions. GMX protocol revenue positioning reflected changing market dynamics and competitive pressures.
-
Geopolitical Factors: Cross-border trading demand and international developments affect both projects. The FTX collapse in November 2022 created market opportunity that GMX captured by offering decentralized alternatives with user-controlled assets. INJ's cross-chain architecture positions it for international interoperability, though specific geopolitical impact comparisons were not detailed in available materials.
III. 2026-2031 Price Forecast: INJ vs GMX
Short-term Forecast (2026)
- INJ: Conservative $4.44-$5.55 | Optimistic $5.55-$8.10
- GMX: Conservative $7.47-$8.30 | Optimistic $8.30-$12.12
Mid-term Forecast (2028-2029)
- INJ may enter a growth phase with projected price range of $4.15-$10.33
- GMX may enter an expansion stage with projected price range of $6.43-$15.68
- Key drivers: institutional capital inflows, ETF developments, ecosystem expansion
Long-term Forecast (2030-2031)
- INJ: Baseline scenario $6.87-$9.14 | Optimistic scenario $9.82-$12.67
- GMX: Baseline scenario $11.06-$14.11 | Optimistic scenario $14.74-$19.90
View detailed price predictions for INJ and GMX
Disclaimer
INJ:
| Year |
Predicted High Price |
Predicted Average Price |
Predicted Low Price |
Price Change |
| 2026 |
8.10154 |
5.549 |
4.4392 |
0 |
| 2027 |
7.2347862 |
6.82527 |
4.6411836 |
23 |
| 2028 |
8.857835406 |
7.0300281 |
4.147716579 |
27 |
| 2029 |
10.3271112789 |
7.943931753 |
6.75234199005 |
43 |
| 2030 |
10.5058497433425 |
9.13552151595 |
7.7651932885575 |
65 |
| 2031 |
12.668684462243662 |
9.82068562964625 |
6.874479940752375 |
77 |
GMX:
| Year |
Predicted High Price |
Predicted Average Price |
Predicted Low Price |
Price Change |
| 2026 |
12.12092 |
8.302 |
7.4718 |
0 |
| 2027 |
14.5002732 |
10.21146 |
6.4332198 |
23 |
| 2028 |
12.726542598 |
12.3558666 |
11.490955938 |
49 |
| 2029 |
15.67650574875 |
12.541204599 |
8.02637094336 |
51 |
| 2030 |
15.37865213952375 |
14.108855173875 |
13.68558951865875 |
70 |
| 2031 |
19.904067436544156 |
14.743753656699375 |
11.057815242524531 |
78 |
IV. Investment Strategy Comparison: INJ vs GMX
Long-term vs Short-term Investment Strategies
-
INJ: Suitable for investors seeking exposure to interoperable blockchain infrastructure and DeFi ecosystem expansion. The deflationary tokenomics through buyback-and-burn mechanisms may appeal to those anticipating long-term value appreciation driven by supply reduction. The cross-chain architecture and RWA integration position INJ for potential growth as institutional adoption of DeFi infrastructure increases.
-
GMX: Suitable for investors interested in revenue-generating assets within the decentralized derivatives sector. The dual-token model provides yield opportunities through fee distribution to staked GMX holders, attracting income-focused participants. The protocol's established position in perpetual trading may appeal to those seeking exposure to derivative market growth.
Risk Management and Asset Allocation
-
Conservative Investors: INJ 30-40% vs GMX 60-70%. This allocation reflects GMX's revenue-sharing mechanism providing relatively more predictable yield streams, while maintaining moderate INJ exposure for potential upside from ecosystem development.
-
Aggressive Investors: INJ 50-60% vs GMX 40-50%. Higher INJ allocation capitalizes on potential growth from technology upgrades, institutional backing, and deflationary pressure, while GMX provides portfolio balance through established protocol revenues.
-
Hedging Tools: Stablecoin allocation (15-25% of total portfolio), options contracts for downside protection, cross-asset diversification including established DeFi protocols, consideration of yield-bearing stablecoin strategies to reduce overall portfolio volatility.
V. Potential Risk Comparison
Market Risks
-
INJ: Subject to broader DeFi sector sentiment and adoption rates of Layer-1 blockchain infrastructure. Price correlation with general crypto market cycles, as evidenced by the substantial decline from 2024 peak. Dependency on continued ecosystem growth and developer activity to sustain valuations. Competition from other interoperable blockchain platforms may impact market share.
-
GMX: Exposed to derivatives trading volume fluctuations and competitive pressures within the decentralized exchange sector. The transition to V2 architecture demonstrated execution risks during protocol upgrades. Market share erosion from competing perpetual trading platforms may affect protocol revenue and token value. Liquidity concentration in GLP pools creates potential systemic vulnerabilities during extreme market conditions.
Technical Risks
-
INJ: Scalability challenges despite zkRollup implementation as transaction volumes increase. Network stability during high-traffic periods requires ongoing infrastructure optimization. Cross-chain bridge dependencies introduce potential attack vectors. Smart contract complexity in the modular architecture increases audit requirements and potential vulnerability surface area.
-
GMX: Oracle dependency creates price feed manipulation risks despite Chainlink integration. GLP liquidity pool model concentrates counterparty risk, particularly during one-sided market movements. Smart contract vulnerabilities in complex derivative protocols pose ongoing security concerns. V2 isolated pool architecture, while improving risk management, introduces additional complexity requiring continuous monitoring.
Regulatory Risks
- Global regulatory developments affect both projects differently based on their functional characteristics. INJ's positioning as blockchain infrastructure may face different scrutiny compared to application-layer protocols. GMX's derivatives trading functionality may attract increased regulatory attention in jurisdictions implementing stricter controls on leveraged products. Evolving DeFi regulations across major markets could impact operational models, token classifications, and geographic accessibility for both projects.
VI. Conclusion: Which Is the Better Buy?
📌 Investment Value Summary:
-
INJ Advantages: Institutional backing from established investors including Binance Labs and Pantera Capital provides credibility. Deflationary tokenomics through systematic burn mechanisms may support long-term value appreciation. Cross-chain interoperability and modular architecture position the protocol for diverse application development. RWA integration and AI-enhanced oracle systems demonstrate forward-looking technical development. Strong ecosystem development potential supported by permissionless platform construction.
-
GMX Advantages: Established revenue generation through fee distribution creates yield opportunities for token holders. Proven product-market fit in decentralized perpetual trading with substantial historical trading volumes. Dual-token economic model provides multiple value accrual mechanisms. V2 architecture improvements address previous limitations through isolated liquidity pools and dynamic fee mechanisms. Strong positioning within the growing derivatives trading sector.
✅ Investment Recommendations:
-
Novice Investors: Consider starting with smaller allocations to both assets (combined 5-10% of portfolio) while maintaining substantial stablecoin positions. Focus on understanding fundamental differences between infrastructure protocols (INJ) and application-layer protocols (GMX). Utilize dollar-cost averaging to mitigate timing risks during high volatility periods.
-
Experienced Investors: Evaluate portfolio allocation based on risk tolerance and market outlook. Those anticipating infrastructure growth may favor INJ exposure, while those seeking yield-generating assets may prefer GMX positioning. Consider dynamic rebalancing strategies based on relative performance and fundamental developments. Monitor ecosystem metrics including developer activity, protocol revenues, and user adoption trends.
-
Institutional Investors: Assess both projects within broader DeFi allocation strategies considering correlation characteristics and liquidity profiles. INJ may provide infrastructure exposure complementing application-layer holdings. GMX offers derivatives sector exposure with established revenue streams. Consider custody solutions, regulatory compliance requirements, and risk management frameworks appropriate for institutional mandates.
⚠️ Risk Warning: The cryptocurrency market exhibits extreme volatility. This content does not constitute investment advice. Investors should conduct independent research and consider personal financial circumstances before making investment decisions.
VII. FAQ
Q1: What are the key differences in tokenomics between INJ and GMX?
INJ features a deflationary model with a fixed supply of 100 million tokens and a buyback-and-burn mechanism achieving approximately 3.2% annual burn rate, while GMX operates a dual-token ecosystem (GMX and GLP) with revenue-sharing where 30% of protocol fees are distributed to staked GMX holders and 70% to GLP providers. INJ's model creates scarcity-driven value appreciation through systematic supply reduction, whereas GMX provides yield-based value accrual through continuous fee distribution. The fundamental difference lies in their value propositions: INJ emphasizes long-term deflationary pressure, while GMX focuses on generating passive income for token holders through protocol revenues.
Q2: Which token offers better institutional backing and credibility?
INJ demonstrates stronger institutional backing with support from Binance Labs, Pantera Capital, and Coinbase Custody integration, providing enhanced institutional credibility and infrastructure. GMX's institutional adoption data is less extensively documented in available materials. INJ's partnerships include membership in the Chicago DeFi Alliance accelerator and collaboration with Chainlink for oracle services. For institutional investors prioritizing established backing and custody solutions, INJ currently presents a more developed institutional infrastructure, though both projects operate within evolving regulatory frameworks that require ongoing monitoring.
Q3: How do INJ and GMX compare in terms of revenue generation and sustainability?
GMX generates direct revenue through trading fees from its perpetual exchange operations, distributing 30% to GMX stakers and 70% to GLP liquidity providers, creating immediate yield opportunities for participants. INJ's revenue model centers on ecosystem development through trading fee collection that funds the buyback-and-burn mechanism rather than direct distribution. GMX's model provides more immediate cash flow visibility and yield generation, making it attractive for income-focused investors. INJ's approach prioritizes long-term value creation through supply reduction and ecosystem expansion. The sustainability of both models depends on maintaining competitive positions within their respective market segments—derivatives trading for GMX and blockchain infrastructure for INJ.
Q4: What are the primary technical risks associated with each protocol?
INJ faces scalability challenges during high-traffic periods despite zkRollup implementation, cross-chain bridge vulnerabilities, and smart contract complexity from its modular architecture requiring comprehensive security audits. GMX encounters oracle dependency risks despite Chainlink integration, liquidity pool concentration creating counterparty exposure during one-sided markets, and smart contract vulnerabilities inherent in complex derivative protocols. Additionally, GMX's V2 transition introduced architectural complexity through isolated pools requiring continuous monitoring. Both protocols require ongoing security assessments, though INJ's infrastructure-layer positioning involves broader systemic dependencies while GMX's application-layer focus concentrates risks within the derivatives trading functionality.
Q5: Which token is more suitable for conservative versus aggressive investors?
Conservative investors may favor GMX (60-70% allocation) due to its revenue-sharing mechanism providing relatively predictable yield streams and established product-market fit in derivatives trading, balanced with moderate INJ exposure (30-40%) for potential ecosystem development upside. Aggressive investors might prefer higher INJ allocation (50-60%) to capitalize on potential growth from technology upgrades, institutional backing, and deflationary pressure, while maintaining GMX positioning (40-50%) for portfolio balance through protocol revenues. The key distinction lies in risk-return profiles: GMX offers more immediate yield generation with established revenues, while INJ presents higher growth potential through infrastructure development and supply reduction mechanisms, though with greater uncertainty regarding adoption timelines.
Q6: How have INJ and GMX performed during major market downturns?
Both tokens experienced significant declines during the 2024-2025 market cycle, with INJ falling approximately 89.5% from its $52.62 peak to around $5.52, and GMX declining about 90.9% from $91.07 to approximately $8.27. These similar trajectories reflect broader DeFi sector challenges during this period. However, GMX demonstrated resilience following the FTX collapse in November 2022, capturing market share as users sought decentralized alternatives with self-custody features. INJ's performance correlated more closely with general Layer-1 blockchain sentiment and DeFi adoption rates. Historical patterns suggest both assets exhibit high correlation with broader crypto market cycles, emphasizing the importance of diversification and risk management strategies regardless of individual project fundamentals.
Q7: What are the long-term growth drivers for INJ versus GMX through 2031?
INJ's long-term growth drivers include cross-chain interoperability expansion, RWA tokenization module adoption, AI-enhanced oracle integration, institutional DeFi infrastructure demand, and deflationary supply pressure from burn mechanisms. Price projections suggest potential appreciation from current levels to $9.82-$12.67 range by 2031 under optimistic scenarios. GMX's growth catalysts center on derivatives trading sector expansion, V2 architecture efficiency improvements, revenue generation sustainability, and market share retention against competitors. Projections indicate potential growth to $14.74-$19.90 range by 2031 in optimistic scenarios. The fundamental difference lies in their positioning: INJ as blockchain infrastructure benefiting from broader DeFi ecosystem growth, versus GMX as an application-layer protocol dependent on maintaining competitive advantages in derivatives trading. Both face execution risks and market competition that could significantly impact these projections.
Q8: Should investors hold both INJ and GMX or concentrate in one asset?
Diversified exposure to both assets provides portfolio benefits by capturing different value propositions within the DeFi sector—infrastructure development (INJ) and derivatives trading (GMX). This approach reduces concentration risk while maintaining exposure to complementary growth drivers. Portfolio allocation should reflect individual risk tolerance, with conservative strategies favoring GMX's yield generation (60-70%) and moderate INJ exposure (30-40%), while aggressive approaches might emphasize INJ's growth potential (50-60%) balanced with GMX revenues (40-50%). Concentration in a single asset increases both potential returns and risks, suitable only for investors with high conviction and risk tolerance. Regular rebalancing based on relative performance and fundamental developments helps maintain target allocations. Both assets exhibit high volatility and correlation with broader crypto markets, emphasizing the importance of overall portfolio construction including stablecoin allocations (15-25%) and other risk management strategies regardless of the INJ-GMX allocation decision.
* The information is not intended to be and does not constitute financial advice or any other recommendation of any sort offered or endorsed by Gate.