This article provides a comprehensive comparison between INJ and MANA, two distinct cryptocurrency assets serving different blockchain ecosystems. INJ operates as a Layer-1 blockchain infrastructure focused on DeFi applications with strong institutional backing from Pantera Capital and Jump Crypto, currently trading at $5.58. MANA functions as the native token for Decentraland's blockchain-based virtual world platform, centered on digital property ownership and content creation, currently at $0.15. The analysis examines historical price trends, tokenomics, institutional adoption patterns, technical infrastructure, and regulatory environments for both assets. Key differences include INJ's DeFi infrastructure positioning versus MANA's metaverse focus, their distinct trading volumes ($2.57M vs $190K), and regulatory classifications. The article outlines investment strategies tailored for conservative and aggressive investors, risk management frameworks, and detailed price analysis across 2026-2031 timeframes. Co
Introduction: Investment Comparison Between INJ and MANA
In the cryptocurrency market, the comparison between INJ and MANA represents two distinct approaches to blockchain applications. Both assets occupy different positions in market capitalization rankings, use cases, and price performance, reflecting divergent strategic directions within the crypto ecosystem.
Injective (INJ): Launched in October 2020, this Layer-1 blockchain has positioned itself as an infrastructure platform for decentralized finance (DeFi) and Web3 applications. Supported by Binance incubation and backed by prominent investors including Pantera Capital and Jump Crypto, INJ currently ranks 122nd by market capitalization with a circulating supply of 100 million tokens.
Decentraland (MANA): Originating in September 2017, MANA serves as the native token for a blockchain-based virtual world platform. The project aims to enable content creators and users to hold and monetize virtual property rights without intermediary fees. With over 1.9 billion tokens in circulation, MANA ranks 192nd in market capitalization and maintains a presence across 61 exchanges.
This article will examine these two assets through the lens of historical price performance, supply mechanisms, ecosystem development, and technical infrastructure. By analyzing market data, trading patterns, and fundamental characteristics, we aim to provide a comparative framework for understanding the investment considerations associated with each token.
"Which asset aligns better with specific investment objectives in the current market environment?"
I. Historical Price Comparison and Market Status
INJ and MANA Historical Price Trends
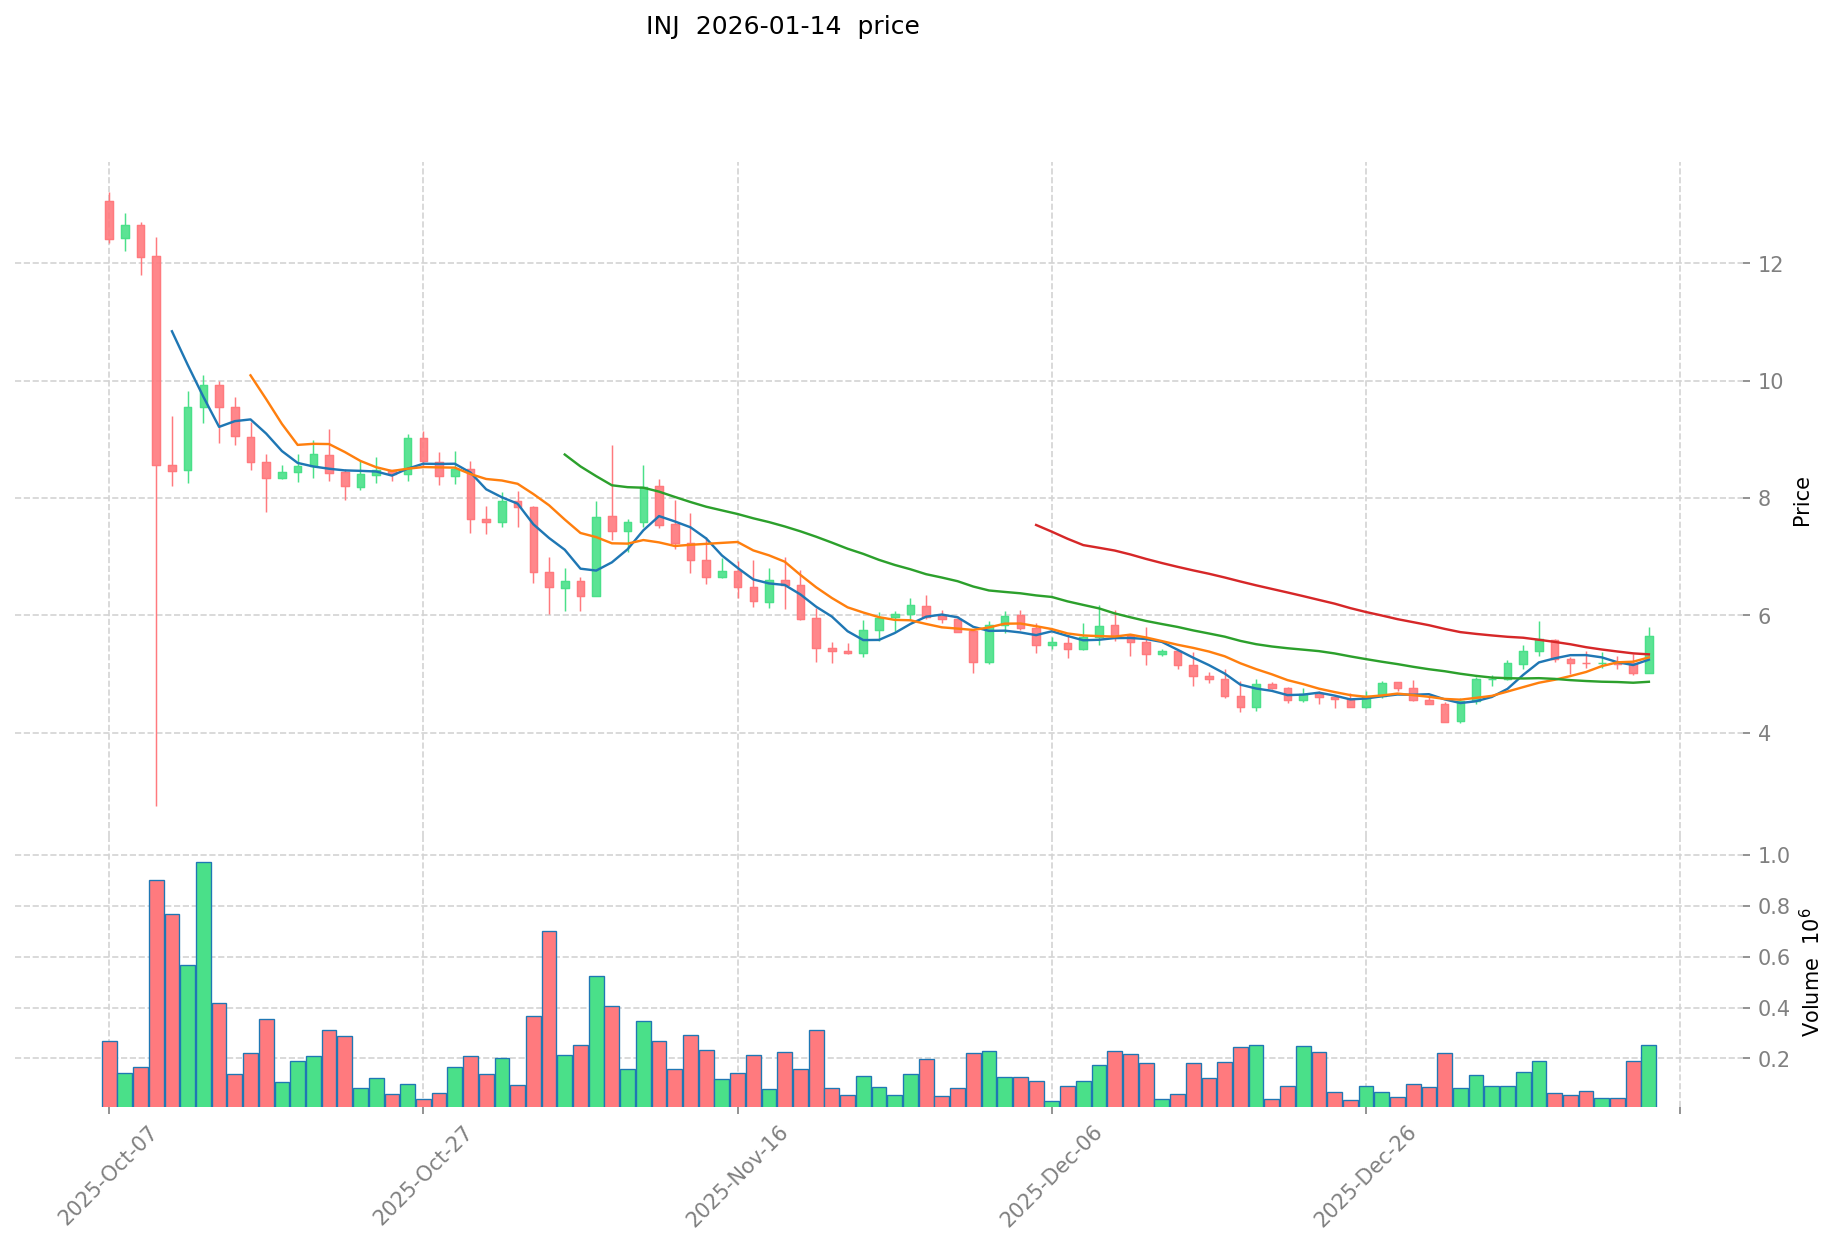
- 2024: INJ experienced notable price fluctuations, reaching a recorded high of $52.62 on March 14, 2024, driven by increased platform activity and ecosystem expansion. However, the price has since declined significantly.
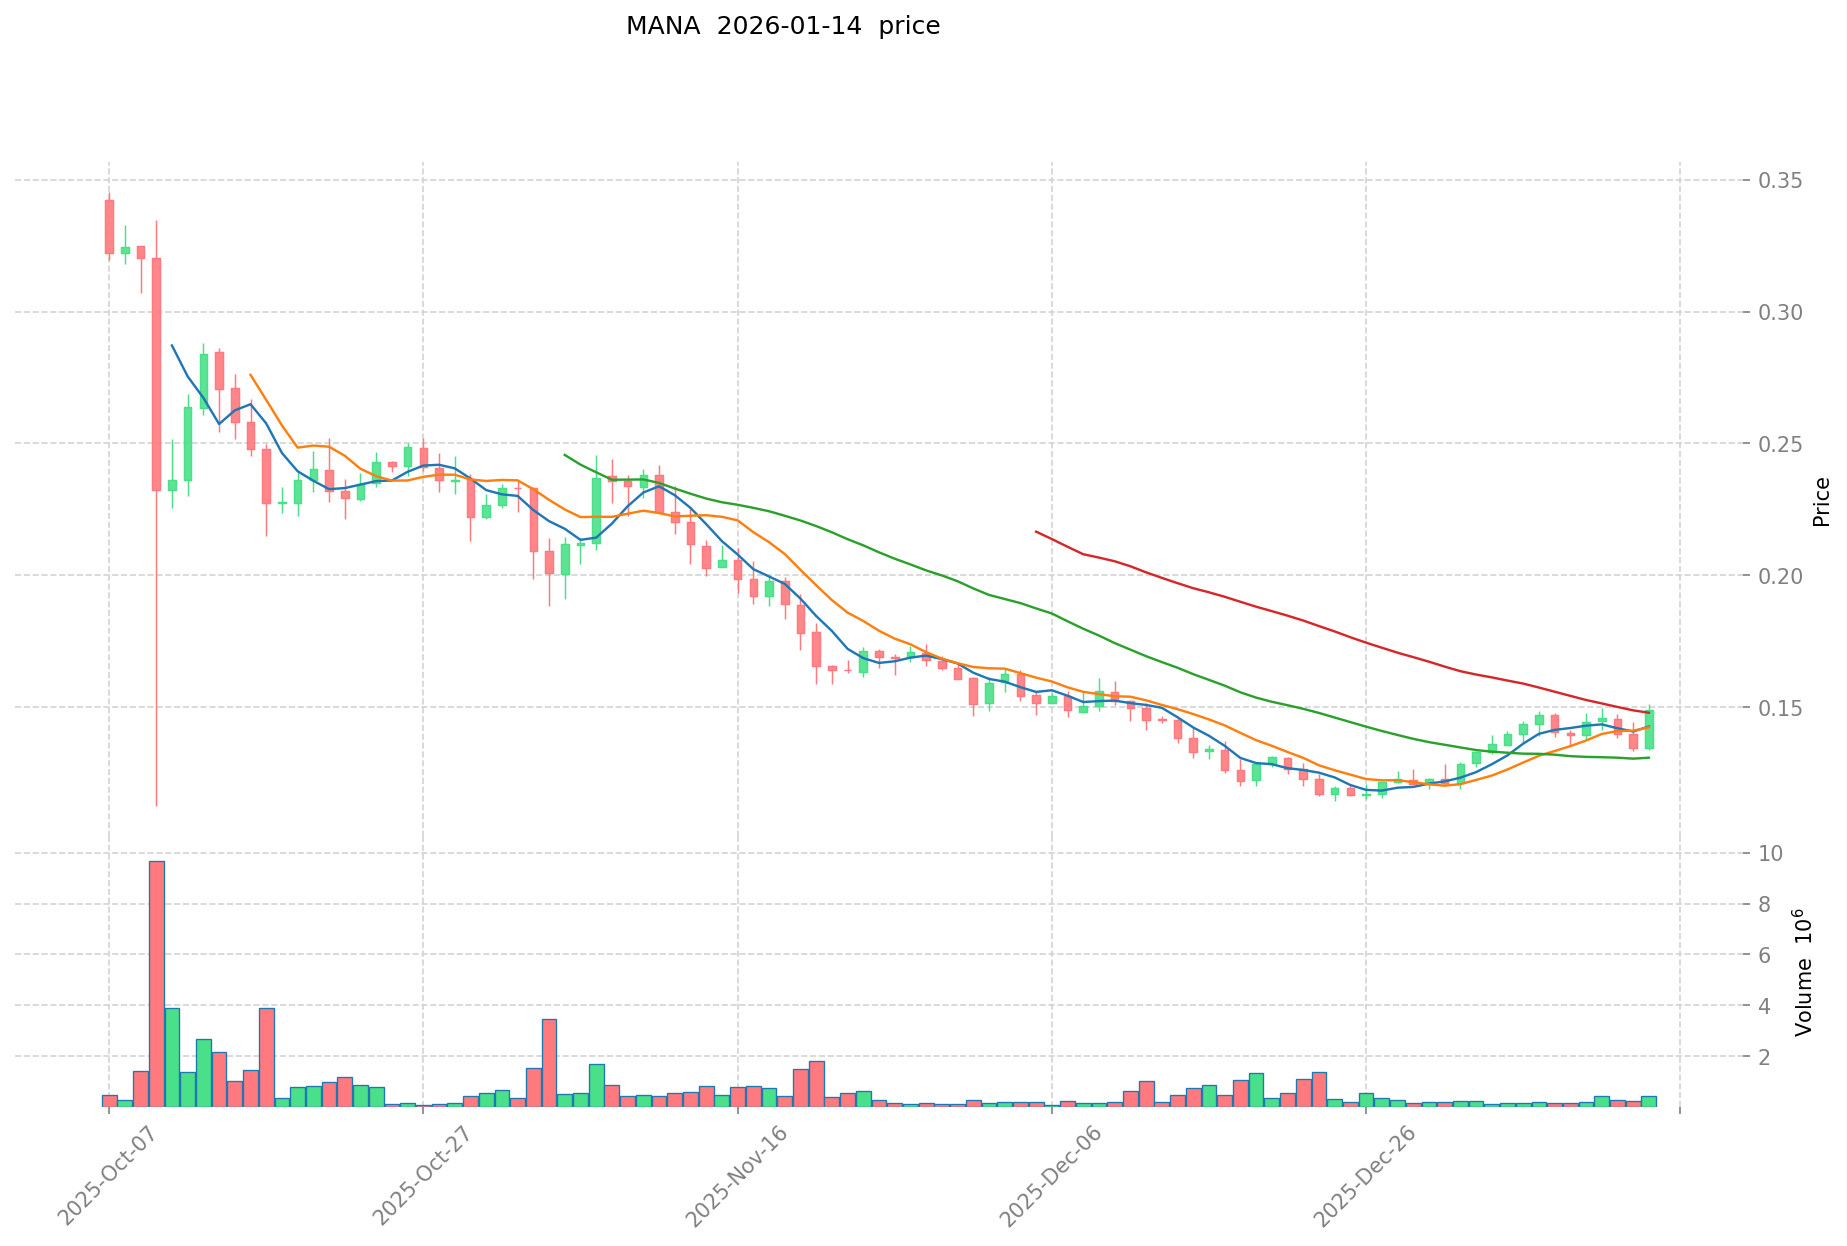
- 2021: MANA benefited from the metaverse boom, achieving its all-time high of $5.85 on November 25, 2021, as virtual reality platforms gained mainstream attention and adoption.
- Comparative Analysis: During the recent market cycle, INJ declined from its peak of $52.62 to the current level of approximately $5.58, representing a substantial correction. Meanwhile, MANA has experienced a similar downward trend, dropping from its historical high of $5.85 to around $0.15, reflecting broader challenges in the metaverse and NFT sectors.
Current Market Status (2026-01-14)
- INJ Current Price: $5.58
- MANA Current Price: $0.15
- 24-Hour Trading Volume: INJ recorded approximately $2.57 million, while MANA showed around $190,031
- Market Sentiment Index (Fear & Greed Index): 48 (Neutral)
View real-time prices:
II. Core Factors Influencing INJ vs MANA Investment Value
Tokenomics Comparison
-
INJ: The reference materials indicate that Injective has established a leading technical position with accelerating institutional adoption. However, specific supply mechanism details such as fixed supply or deflationary models are not provided in the available materials.
-
MANA: According to the materials, MANA has been issued and sold as an investment contract since its initial offering, and is considered a security. The price of all MANA tokens rises or falls together. Specific details regarding supply mechanisms such as halving are not mentioned in the provided materials.
-
📌 Historical Pattern: The materials do not contain sufficient information regarding how supply mechanisms have historically driven price cycle changes for either asset.
Institutional Adoption and Market Application
-
Institutional Holdings: According to the materials, Injective shows signs of accelerating institutional adoption, suggesting it may be gaining favor among institutional investors. Specific institutional holding data for MANA is not provided in the available materials.
-
Enterprise Adoption: The materials do not provide specific information regarding INJ or MANA's application in cross-border payments, settlement, or investment portfolios.
-
National Policies: The materials note that MANA is viewed as a security by the SEC. Regulatory attitudes toward INJ from different jurisdictions are not detailed in the provided materials.
Technical Development and Ecosystem Building
-
INJ Technical Development: The materials mention that Injective has established a leading technical position and shows potential in the RWA (Real World Assets) market. Specific technical upgrade details and their potential impacts are not elaborated in the provided materials.
-
MANA Technical Development: The materials indicate that Decentraland is a virtual reality platform launched in 2017, built on the Ethereum blockchain, providing an open and decentralized metaverse environment. Users can own, create, and trade virtual assets and digital real estate. Specific ongoing technical developments are not detailed in the available materials.
-
Ecosystem Comparison: The materials mention Decentraland's connection to virtual reality and metaverse applications, while Injective shows institutional adoption trends. Specific comparisons regarding DeFi, NFT, payment, and smart contract implementations are not provided in the available materials.
Macroeconomic Environment and Market Cycles
-
Performance in Inflationary Environments: The materials do not contain information regarding which asset demonstrates stronger anti-inflation properties.
-
Macroeconomic Monetary Policy: The materials do not provide analysis of how interest rates or the US Dollar Index affect either INJ or MANA.
-
Geopolitical Factors: The materials do not contain information regarding how cross-border transaction demand or international situations impact either asset.
III. 2026-2031 Price Forecast: INJ vs MANA
Short-term Forecast (2026)
- INJ: Conservative $4.09-$5.60 | Optimistic $5.60-$6.38
- MANA: Conservative $0.13-$0.15 | Optimistic $0.15-$0.16
Mid-term Forecast (2028-2029)
- INJ may enter a growth phase, with estimated price range of $6.69-$10.42
- MANA may enter a consolidation phase, with estimated price range of $0.10-$0.23
- Key drivers: institutional capital inflows, ETF developments, ecosystem expansion
Long-term Forecast (2030-2031)
- INJ: Baseline scenario $4.66-$8.96 | Optimistic scenario $8.96-$13.18
- MANA: Baseline scenario $0.15-$0.22 | Optimistic scenario $0.22-$0.27
View detailed price predictions for INJ and MANA
Disclaimer
INJ:
| Year |
Predicted High Price |
Predicted Average Price |
Predicted Low Price |
Price Change |
| 2026 |
6.38058 |
5.597 |
4.08581 |
0 |
| 2027 |
8.5639697 |
5.98879 |
5.5695747 |
7 |
| 2028 |
7.712962641 |
7.27637985 |
6.694269462 |
30 |
| 2029 |
10.417593031245 |
7.4946712455 |
4.04712247257 |
34 |
| 2030 |
10.56823592327955 |
8.9561321383725 |
4.6571887119537 |
60 |
| 2031 |
13.178948441615133 |
9.762184030826025 |
5.759688578187354 |
75 |
MANA:
| Year |
Predicted High Price |
Predicted Average Price |
Predicted Low Price |
Price Change |
| 2026 |
0.16308 |
0.151 |
0.13439 |
0 |
| 2027 |
0.2229968 |
0.15704 |
0.1130688 |
3 |
| 2028 |
0.233722632 |
0.1900184 |
0.102609936 |
25 |
| 2029 |
0.22882015728 |
0.211870516 |
0.1165287838 |
40 |
| 2030 |
0.2489902304032 |
0.22034533664 |
0.1476313755488 |
45 |
| 2031 |
0.267521273214624 |
0.2346677835216 |
0.16426744846512 |
55 |
IV. Investment Strategy Comparison: INJ vs MANA
Long-term vs Short-term Investment Strategies
-
INJ: May suit investors focused on institutional adoption trends and DeFi infrastructure development. The asset has shown interest from institutional participants and maintains a presence in the Layer-1 blockchain space. Investors considering INJ might evaluate its role within the evolving decentralized finance ecosystem.
-
MANA: May appeal to investors interested in virtual reality and metaverse-related applications. As an early entrant in the blockchain-based virtual world sector since 2017, MANA's positioning centers around digital property rights and content creation platforms. Investors might consider MANA within the context of broader metaverse development trends.
Risk Management and Asset Allocation
-
Conservative Investors: A potential allocation framework could consider 30-40% INJ vs 60-70% MANA, reflecting the different risk profiles associated with DeFi infrastructure versus metaverse applications. Conservative approaches typically emphasize diversification across different crypto sectors.
-
Aggressive Investors: A more active allocation might involve 60-70% INJ vs 30-40% MANA, potentially favoring assets with institutional adoption momentum. Aggressive strategies may involve higher exposure to assets showing institutional interest patterns.
-
Hedging Tools: Portfolio risk management approaches may include stablecoin allocations for liquidity management, options instruments where available, and cross-asset diversification strategies to mitigate sector-specific volatility.
V. Potential Risk Comparison
Market Risks
-
INJ: The asset has experienced notable volatility, with substantial corrections from previous highs. Price movements may correlate with broader DeFi sector trends, institutional sentiment shifts, and Layer-1 blockchain competition dynamics. Market liquidity conditions and trading volume fluctuations represent ongoing considerations.
-
MANA: Historical price patterns show significant sensitivity to metaverse sector sentiment and NFT market cycles. The asset demonstrated substantial decline from previous peaks, reflecting challenges within virtual reality adoption trends. Market interest in metaverse applications and digital property concepts may influence price dynamics.
Technical Risks
-
INJ: As a Layer-1 blockchain infrastructure, considerations include network scalability requirements, transaction processing capabilities, and ecosystem development pace. The competitive landscape among DeFi-focused blockchains presents ongoing technical and adoption challenges.
-
MANA: Built on Ethereum blockchain infrastructure, the asset's technical considerations relate to underlying network performance, gas fee impacts on platform usage, and virtual world platform scalability. User adoption rates and content creator participation levels represent technical ecosystem factors.
Regulatory Risks
-
According to available materials, MANA has been characterized as a security by regulatory authorities, which may influence its trading, custody, and distribution considerations across different jurisdictions.
-
Regulatory perspectives on DeFi infrastructure and Layer-1 blockchains continue evolving globally, with varying approaches across different regulatory frameworks. Both assets face ongoing regulatory development considerations.
-
Cross-border regulatory coordination efforts and evolving digital asset classification frameworks may affect both assets differently based on their respective use cases and technical implementations.
VI. Conclusion: Which Is the Better Buy?
📌 Investment Value Summary:
-
INJ Characteristics: The asset demonstrates institutional adoption patterns and positioning within DeFi infrastructure development. Technical capabilities in the Layer-1 blockchain space and potential RWA market applications represent notable aspects. However, substantial price volatility and corrections from previous highs warrant consideration.
-
MANA Characteristics: As an established presence in blockchain-based virtual worlds since 2017, MANA represents exposure to metaverse and digital property concepts. The platform's focus on content creation and virtual asset ownership provides distinct positioning, though sector-specific challenges and regulatory considerations exist.
✅ Investment Considerations:
-
Entry-level Investors: May benefit from gradual position building with emphasis on risk management and portfolio diversification. Understanding each asset's distinct sector exposure—DeFi infrastructure versus metaverse applications—helps inform allocation decisions. Starting with smaller positions while monitoring market developments may suit those newer to crypto investing.
-
Experienced Investors: Might evaluate relative valuations, technical developments, and sector rotation dynamics between DeFi and metaverse segments. Active monitoring of institutional adoption trends, ecosystem growth metrics, and regulatory developments can inform tactical allocation adjustments. Risk-adjusted return expectations should account for each asset's historical volatility patterns.
-
Institutional Participants: May focus on liquidity profiles, custody solutions, regulatory clarity, and long-term sector positioning. Institutional considerations often include counterparty risk management, compliance frameworks, and strategic allocation within broader digital asset portfolios. Due diligence regarding technical infrastructure, governance mechanisms, and ecosystem sustainability remains essential.
⚠️ Risk Disclosure: Cryptocurrency markets exhibit substantial volatility and uncertainty. This analysis does not constitute investment advice, financial recommendations, or endorsement of any particular investment strategy. Market conditions, regulatory environments, and technical developments may change rapidly. Potential investors should conduct independent research, assess personal risk tolerance, and consider consultation with qualified financial advisors before making investment decisions.
VII. FAQ
Q1: What are the fundamental differences between INJ and MANA's use cases?
INJ serves as a Layer-1 blockchain infrastructure focused on decentralized finance (DeFi) and Web3 applications, while MANA functions as the native token for a blockchain-based virtual world platform centered on digital property ownership and content creation. INJ targets institutional adoption and financial infrastructure development, backed by prominent investors including Pantera Capital and Jump Crypto since its October 2020 launch. MANA, established in September 2017, concentrates on metaverse applications, enabling users to own, create, and trade virtual assets without intermediary fees within the Decentraland ecosystem.
Q2: How do their regulatory statuses differ?
MANA has been characterized as a security by regulatory authorities, which may influence its trading, custody, and distribution across different jurisdictions. INJ's specific regulatory classification varies by jurisdiction, though as a Layer-1 blockchain infrastructure project, it faces evolving global perspectives on DeFi platforms. The security classification for MANA potentially subjects it to additional compliance requirements and restrictions compared to assets not designated as securities. Both assets remain subject to ongoing regulatory developments in the digital asset space.
Q3: What explains the significant price corrections from their historical peaks?
INJ declined from $52.62 (March 2024) to approximately $5.58, representing substantial correction, while MANA dropped from $5.85 (November 2021) to around $0.15. These corrections reflect sector-specific challenges: INJ's decline correlates with broader DeFi market adjustments and competitive pressures among Layer-1 blockchains, while MANA's substantial decrease mirrors declining interest in metaverse and NFT sectors following the 2021 boom. Both assets experienced significant drawdowns consistent with crypto market cycles and shifting investor sentiment toward their respective sectors.
Q4: How do their circulating supplies and market capitalizations compare?
INJ maintains a circulating supply of 100 million tokens and ranks 122nd by market capitalization, suggesting a more concentrated token distribution. MANA circulates over 1.9 billion tokens and ranks 192nd in market capitalization, indicating a broader token distribution with lower per-token value. The substantial difference in circulating supply—approximately 19 times more MANA tokens—directly impacts pricing dynamics and market capitalization rankings. This supply differential represents distinct tokenomics approaches between the two projects.
Q5: What factors drive institutional adoption differences between these assets?
INJ demonstrates accelerating institutional adoption patterns, supported by backing from established crypto investors and positioning within DeFi infrastructure development. The project's focus on institutional-grade financial applications and Layer-1 blockchain capabilities appears to attract institutional interest. MANA's institutional adoption profile differs due to its metaverse-focused application, consumer-oriented platform design, and security classification. Institutional participants may view INJ's financial infrastructure positioning as more aligned with institutional use cases compared to MANA's virtual world applications.
Q6: How do their trading volumes reflect market interest?
Current 24-hour trading volumes show INJ at approximately $2.57 million compared to MANA's $190,031, indicating roughly 13.5 times higher trading activity for INJ. This volume differential suggests stronger active market participation and liquidity for INJ relative to MANA. Higher trading volumes generally facilitate easier position entry and exit, potentially reducing execution costs and price slippage. The volume disparity reflects current market interest levels in DeFi infrastructure versus metaverse applications.
Q7: What are the key technical infrastructure differences?
INJ operates as an independent Layer-1 blockchain designed specifically for DeFi and Web3 applications, providing native infrastructure for decentralized financial services. MANA functions on Ethereum blockchain infrastructure, relying on Ethereum's network for transaction processing and smart contract execution. This architectural difference means INJ controls its network parameters and scalability approach, while MANA's performance ties to Ethereum network conditions, including gas fees and transaction throughput. The Layer-1 versus Ethereum-based distinction represents fundamentally different technical implementation approaches.
Q8: How should allocation strategies differ between conservative and aggressive investors?
Conservative investors might consider a 30-40% INJ versus 60-70% MANA allocation, emphasizing diversification across different crypto sectors while managing exposure to institutional adoption trends and metaverse applications. Aggressive investors potentially favor 60-70% INJ versus 30-40% MANA, increasing exposure to assets showing institutional interest patterns while accepting higher concentration risk. Both approaches should incorporate risk management tools including stablecoin allocations for liquidity management and cross-asset diversification. Individual risk tolerance, investment timeframe, and market outlook should inform specific allocation decisions rather than following standardized frameworks.
* The information is not intended to be and does not constitute financial advice or any other recommendation of any sort offered or endorsed by Gate.