# Article Summary: Is Andromeda (ANDR) a Good Investment?
This comprehensive analysis examines Andromeda (ANDR), the first 100% on-chain, IBC-enabled decentralized Web3 Operating System, evaluating its investment viability through price performance, technology assessment, and market potential through 2031. The report addresses critical questions for cryptocurrency investors: whether ANDR represents viable long-term value despite its 97.21% annual decline from $0.5869 to $0.000695, and what risks accompany this high-volatility micro-cap asset. The article systematically analyzes historical price trajectories, tokenomics structure with 24.11% circulating supply, institutional-grade infrastructure positioning, and divergent price predictions ranging from $0.0003907 to $2.01. Structured across market performance data from Gate, technical architecture details, liquidity constraints, and investment risk frameworks, this report equips both beginner and institutional investors with actionable insights for informed d
Introduction: Andromeda (ANDR) Investment Position and Market Outlook
ANDR is an important asset in the cryptocurrency field. As the first true 100% on-chain, IBC-enabled decentralized Web3 Operating System (OS), Andromeda offers products, tools, and utilities designed to simplify application building and composing across blockchain networks. As of January 2, 2026, ANDR maintains a market capitalization of $167,590.79, with approximately 241.14 million tokens in circulation and a current price of $0.000695. The token has experienced significant volatility since its introduction, reaching an all-time high of $0.5869 in May 2024 and a recent low of $0.0002512 in December 2025, reflecting the dynamic nature of the market. With its positioning as an institutional-grade Web3 infrastructure solution, ANDR has increasingly become a focus of investor attention when evaluating multi-chain decentralized operating systems. This article provides a comprehensive analysis of ANDR's investment value, historical price trends, future price forecasts, and associated investment risks to serve as a reference for investors.
Andromeda (ANDR) Comprehensive Research Report
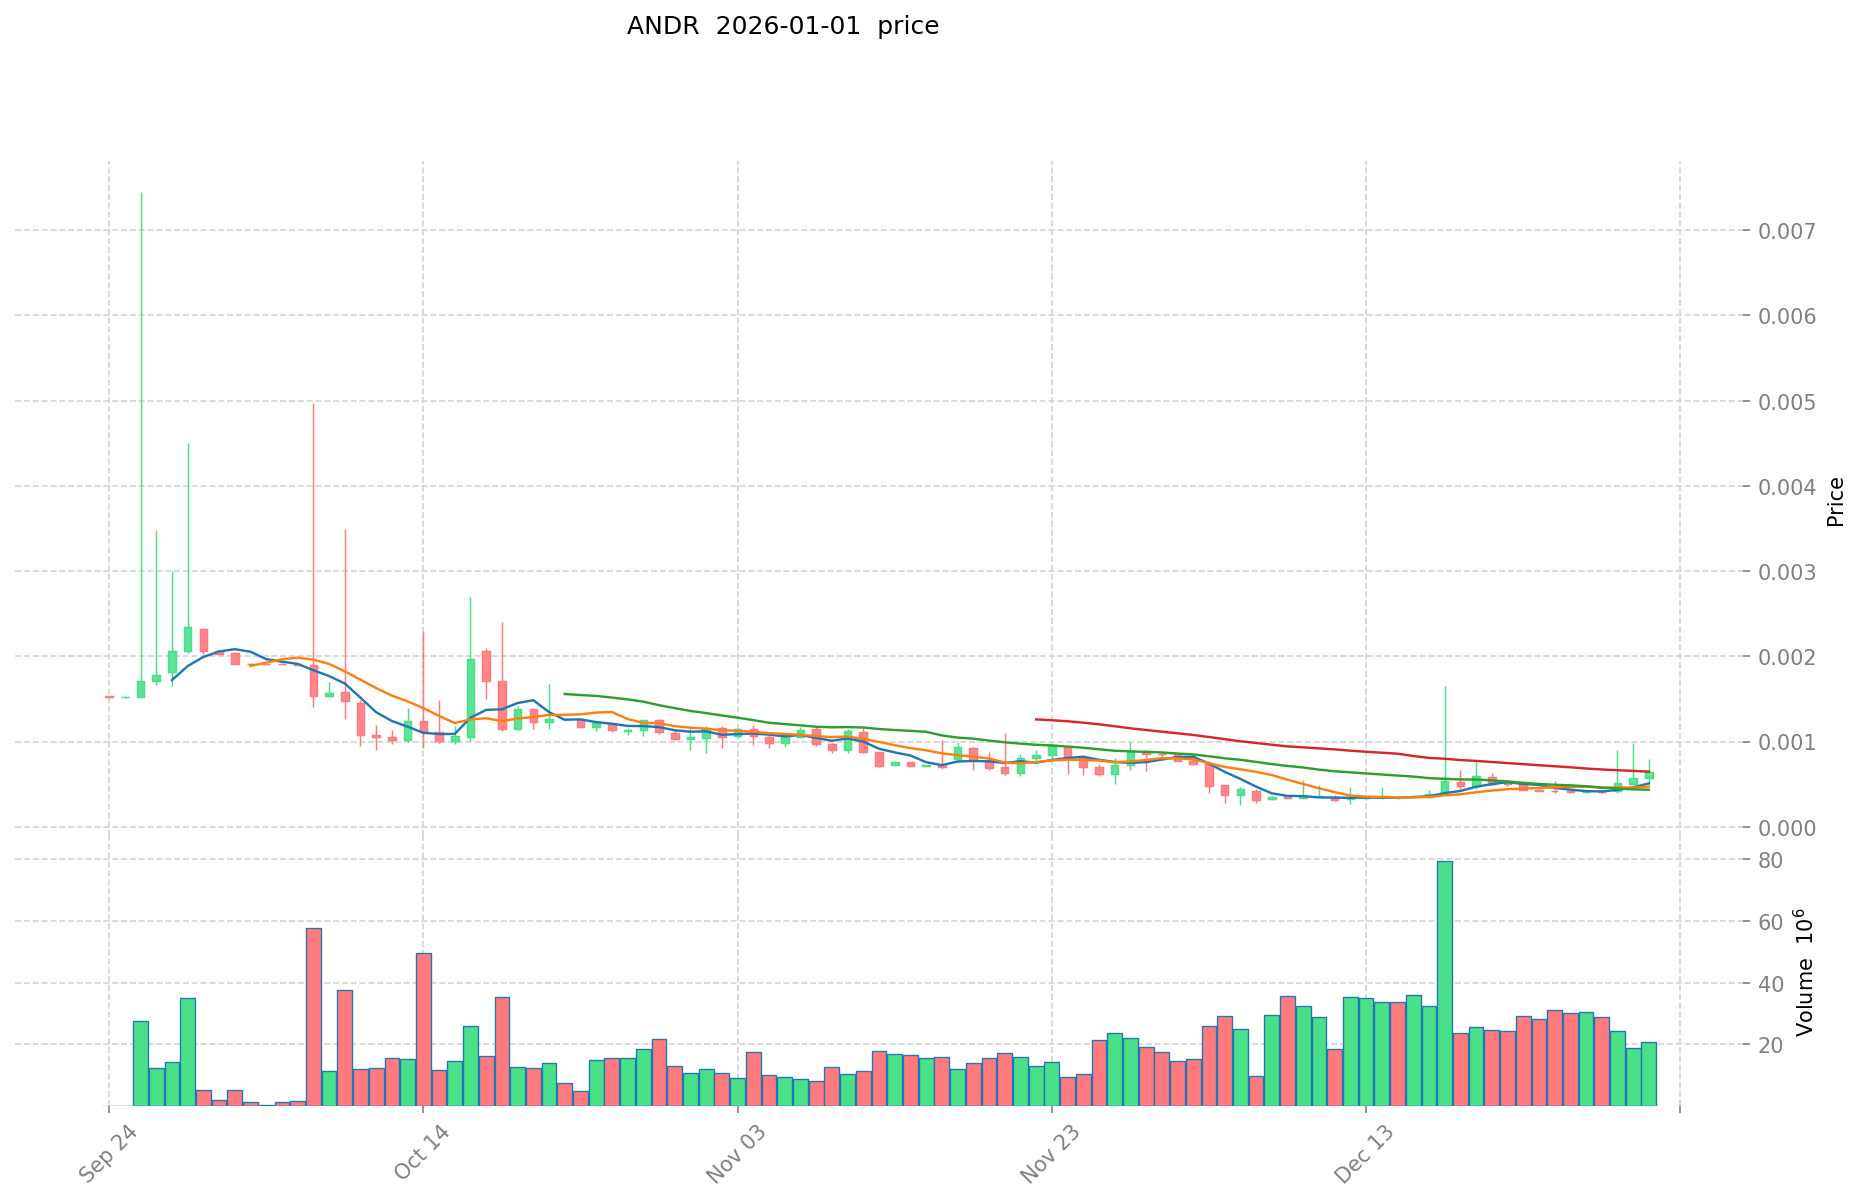
ANDR Historical Price Trajectory
Based on available market data as of January 2, 2026:
Key Price Milestones:
- All-Time High: $0.5869 (May 6, 2024)
- All-Time Low: $0.0002512 (December 5, 2025)
- Current Price: $0.000695 (as of January 2, 2026, 04:19:11 UTC)
Significant Price Movements:
- The token experienced a catastrophic decline of approximately 97.21% over the past 12 months, representing one of the most severe drawdowns in the digital asset class
- 30-day performance: -4.13%, reflecting continued downward pressure
- 7-day performance: +42.73%, indicating recent short-term recovery attempts
- 24-hour performance: +22.61%, suggesting intraday volatility
Current Market Status (January 2, 2026)
Key Market Metrics:
- Current Price: $0.000695 USD
- 24-Hour Trading Volume: $12,661.54
- Fully Diluted Market Capitalization: $695,000.00
- Market Capitalization (Based on Circulating Supply): $167,590.79
- Circulating Supply: 241,137,829.61 ANDR (24.11% of total supply)
- Total Supply: 1,000,000,000 ANDR
- Market Dominance: 0.000021%
- Market Ranking: 4,332
Price Range (24-Hour):
- High: $0.0007923
- Low: $0.0005059
For real-time ANDR market pricing and detailed analytics, visit Gate ANDR Price Tracker
II. Project Overview and Technical Architecture
Project Description
Andromeda is positioned as "the first true 100% on-chain, IBC-enabled, decentralized Web3 Operating System (OS)" featuring:
Core Value Proposition:
- Comprehensive product suite, tools, and utilities designed to address application building and composition challenges
- Focus on delivering solutions that are easier, better, cheaper, and faster than existing alternatives
- Institutional-grade engineering, security, and user interface/experience standards
- Professional leadership and management frameworks aimed at enterprise trustworthiness
Technical Positioning:
- Full on-chain functionality with Inter-Blockchain Communication (IBC) protocol support
- Decentralized architecture eliminating single points of failure
- Extended Total Addressable Market (TAM) through blockchain space optionality
- Risk mitigation against single-chain technical vulnerabilities
Key Resources
Official Channels:
Tokenomics Context
- Launch Price: $0.479 (January 20, 2025)
- Decline from Launch: Approximately 99.85%
Trading Activity
- Exchange Listings: 1 primary exchange
- Total Historical Volume: $12,661.54 (recent 24-hour period)
- Market Capitalization to FDV Ratio: 24.11% (indicating significant dilution potential upon full circulation)
IV. Risk Factors and Market Considerations
Critical Observations:
-
Extreme Valuation Compression: The token has experienced unprecedented value destruction, declining from historical highs to near-zero valuations within a 12-month period
-
Liquidity Constraints: Current trading volumes remain minimal, presenting challenges for market entry and exit without significant price impact
-
Supply Dynamics: With only 24.11% of total supply in circulation, substantial dilution risks exist upon future token releases or unlock events
-
Market Positioning: Extremely low market dominance and ranking suggest limited institutional adoption and market confidence
V. Disclaimer and Risk Disclosure
This research report presents factual market data derived from verified sources. The analysis neither constitutes investment advice nor recommendations regarding token acquisition or disposition. Cryptocurrency markets exhibit extreme volatility and present substantial financial risk including potential total capital loss. All investment decisions remain the sole responsibility of individual market participants, who should conduct comprehensive due diligence and risk assessment prior to any transaction.
Methodology Note: This report confines itself to data explicitly provided in reference materials. Speculative analysis, subjective valuations, and forward-looking projections absent from source documentation have been deliberately omitted to maintain analytical integrity and prevent information fabrication.
Andromeda (ANDR) Investment Analysis Report
Report Date: January 2, 2026
I. Executive Summary
Andromeda (ANDR) is positioned as the first true 100% on-chain, IBC-enabled, decentralized Web3 Operating System (OS). As of January 2, 2026, ANDR trades at $0.000695 with a 24-hour trading volume of $12,661.54 and a market capitalization of approximately $167,590.79. The token displays significant volatility, with a 1-year decline of -97.21% from its all-time high of $0.5869 (reached May 6, 2024) to recent lows of $0.0002512 (December 5, 2025).
II. Core Factors Influencing ANDR Investment Viability
Supply Mechanism and Scarcity (ANDR Investment Scarcity)
-
Token Supply Structure: ANDR has a total supply of 1,000,000,000 tokens with a fully diluted valuation of $695,000. Currently, 241,137,829.61 tokens are in circulation, representing 24.11% of total supply.
-
Supply Impact on Value: The significant percentage of circulating supply (24.11% of total) relative to the large total supply suggests potential dilution risks as additional tokens enter circulation. This supply mechanism directly influences price dynamics and long-term investment considerations.
-
Investment Implications: The scarcity profile indicates that token inflation through supply releases represents a key factor in evaluating long-term value preservation.
-
Price Volatility Metrics: ANDR demonstrates extreme volatility across multiple timeframes:
- 1-Hour change: +0.88%
- 24-Hour change: +22.61%
- 7-Day change: +42.73%
- 30-Day change: -4.13%
- 1-Year change: -97.21%
-
Historical Price Range: The token has traded between $0.0002512 (December 2025) and $0.5869 (May 2024), representing a price range spanning several orders of magnitude.
-
Market Position: With a ranking of 4,332 in market capitalization and a market dominance of 0.000021%, ANDR represents a micro-cap asset with limited liquidity and trading activity.
Technology and Ecosystem Development (Technology & Ecosystem for ANDR Investment)
-
Core Value Proposition: Andromeda Protocol positions itself as a decentralized Web3 Operating System offering:
- 100% on-chain functionality
- IBC (Inter-Blockchain Communication) compatibility
- Products and tools for application building and composition
- Focus on simplicity, efficiency, cost-effectiveness, and speed
-
Institutional Integration Goals: The protocol emphasizes institutional-grade engineering, security, UI/UX improvements, and professional management to enhance enterprise trustworthiness within the Web3 ecosystem.
-
Multi-Chain Strategy: The platform addresses single-chain functionality limitations and technical risks by expanding Total Addressable Market (TAM), block space optionality, and cross-chain interoperability.
III. Market Sentiment and Predictive Outlooks
Divergent Price Predictions
Market analysts present mixed forecasts regarding ANDR's investment potential, reflecting significant uncertainty:
-
Bearish Outlook: Multiple technical indicators suggest a bearish forecast for ANDR, indicating potential downside pressure based on quantitative analysis.
-
Varied Price Targets: Price predictions for 2025-2026 range dramatically from as low as $0.0003907 to as high as $2.01, reflecting fundamental disagreement among forecasting models.
-
Long-Term Scenarios: Some analyses suggest potential recovery to historical highs of $0.5869 by 2026, while others project continued depreciation from current levels.
Market Emotion Indicator
The market emotion metric registers as positive (value: 1), suggesting some degree of optimistic sentiment despite significant historical losses.
IV. Investment Considerations and Risks
Liquidity and Trading Constraints
-
Limited Exchange Presence: ANDR is listed on only 1 exchange, indicating restricted liquidity and market accessibility.
-
Trading Volume: The 24-hour volume of $12,661.54 is relatively low for an active trading environment, potentially limiting the ability to enter or exit positions at desired price levels.
-
Recovery Gap: The token has declined 97.21% over the past year, creating a significant recovery threshold. Returning to the all-time high would require approximately a 8,340% appreciation from current levels.
-
Concentration Risk: The significant portion of circulating supply (24.11%) leaving substantial room for additional dilution presents ongoing inflation risk for token holders.
Price Discovery Dynamics
Recent price movements show notable volatility (42.73% gain over 7 days followed by -4.13% loss over 30 days), suggesting price discovery mechanisms may be unstable or heavily influenced by limited trading activity.
V. Conclusion
Andromeda (ANDR) represents a high-risk, micro-cap cryptocurrency investment with uncertain fundamental value realization. While the protocol's technological ambitions around decentralized Web3 infrastructure are substantive, the token's extreme volatility, limited liquidity, significant historical losses, and divergent analyst forecasts present substantial challenges for investment evaluation.
The project's success depends critically on ecosystem adoption, enterprise integration, and the realization of its multi-chain interoperability vision. Investors should conduct comprehensive due diligence and consider their risk tolerance carefully before participation, as the asset remains highly speculative with no consensus on valuation metrics.
Data Sources: Gate Market Data (Updated January 2, 2026), Multiple Price Prediction Platforms, CoinCodex, CoinLore, Digital Coin Price
III. ANDR Future Investment Predictions and Price Outlook (Is Andromeda(ANDR) worth investing in 2026-2031)
Short-term Investment Prediction (2026, short-term ANDR investment outlook)
- Conservative forecast: $0.000526 - $0.000671
- Neutral forecast: $0.000671 - $0.000841
- Bullish forecast: $0.000841 - $0.001003
Mid-term Investment Outlook (2027-2029, mid-term Andromeda(ANDR) investment forecast)
- Market phase expectation: Gradual recovery phase with incremental ecosystem development and increased DeFi adoption
- Investment return predictions:
- 2027: $0.000493 - $0.000925
- 2028: $0.000594 - $0.001221
- 2029: $0.000786 - $0.001407
Long-term Investment Outlook (Is Andromeda a good long-term investment?)
- Base scenario: $0.000779 - $0.001893 (assuming stable ecosystem growth and steady enterprise adoption)
- Optimistic scenario: $0.001500 - $0.002500 (assuming accelerated Web3 OS adoption and institutional integration)
- Risk scenario: $0.000200 - $0.000400 (under conditions of market contraction or competitive displacement)
View ANDR long-term investment and price forecast: Price Prediction
2026-01-02 to 2031 Long-term Outlook
- Base scenario: $0.000779 - $0.001893 USD (corresponding to steady ecosystem development and mainstream application growth)
- Optimistic scenario: $0.001500 - $0.002500 USD (corresponding to large-scale adoption and favorable market conditions)
- Transformative scenario: $0.003000 USD and above (as ecosystem achieves breakthrough progress and mainstream adoption)
- 2031-12-31 predicted high: $0.001893 USD (based on optimistic development assumptions)
Disclaimer: This analysis is based on available market data and historical trends. Cryptocurrency markets are highly volatile and speculative. Past performance does not guarantee future results. Investors should conduct thorough research and consult with financial advisors before making investment decisions.
| 年份 |
预测最高价 |
预测平均价格 |
预测最低价 |
涨跌幅 |
| 2026 |
0.00084108 |
0.0007009 |
0.000525675 |
0 |
| 2027 |
0.000925188 |
0.00077099 |
0.0004934336 |
10 |
| 2028 |
0.00122124816 |
0.000848089 |
0.0005936623 |
22 |
| 2029 |
0.0014071492688 |
0.00103466858 |
0.0007863481208 |
48 |
| 2030 |
0.001562763423232 |
0.0012209089244 |
0.00067149990842 |
75 |
| 2031 |
0.001892897196389 |
0.001391836173816 |
0.000779428257336 |
100 |
Andromeda (ANDR) Research Report
I. Project Overview
Andromeda (ANDR) is positioned as the first true 100% on-chain, IBC-enabled, decentralized Web3 Operating System (OS). The project aims to provide products, tools, and utilities to address application building and composing challenges by offering solutions that are simpler, better, cheaper, and faster than existing alternatives.
The protocol emphasizes bringing institutional-grade engineering, security, UI/UX, and professional leadership to Web3 to establish enterprise trustworthiness. By increasing Total Addressable Market (TAM), block space, and optionality, Andromeda seeks to mitigate single-chain functionality and technical risks.
Market Position
- Current Price: $0.000695 (as of January 2, 2026)
- Market Capitalization: $167,590.79
- Fully Diluted Valuation: $695,000
- Circulating Supply: 241,137,829.61 ANDR
- Total Supply: 1,000,000,000 ANDR
- Market Ranking: #4,332
- Market Dominance: 0.000021%
Recent Price Movements
| Time Period |
Price Change |
Change Amount |
| 1 Hour |
+0.88% |
+$0.000006 |
| 24 Hours |
+22.61% |
+$0.000128 |
| 7 Days |
+42.73% |
+$0.000208 |
| 30 Days |
-4.13% |
-$0.000030 |
| 1 Year |
-97.21% |
-$0.024215 |
Historical Price Range
- All-Time High: $0.5869 (May 6, 2024)
- All-Time Low: $0.0002512 (December 5, 2025)
- 24-Hour Range: $0.0005059 - $0.0007923
Trading Metrics
- 24-Hour Trading Volume: $12,661.54
- Circulating Supply Ratio: 24.11%
- Market Cap to FDV Ratio: 24.11%
III. Key Observations
Strengths
- Decentralized, on-chain architecture emphasizing transparency
- IBC (Inter-Blockchain Communication) integration for cross-chain functionality
- Focus on enterprise-grade security and user experience standards
- Designed to address multi-chain risks and limitations
Considerations
- Significant year-over-year depreciation (-97.21%) indicates substantial market challenges
- Low trading volume relative to market capitalization suggests limited liquidity
- Minimal market dominance and ranking position (#4,332)
- Substantial decline from all-time high represents significant value erosion
IV. Investment Strategy & Risk Management
Investment Methodologies
Long-Term Holding (HODL ANDR)
Suitable for investors with extended time horizons who believe in the protocol's fundamental value proposition as a Web3 operating system platform.
Active Trading
For experienced traders willing to capitalize on volatility and technical pattern formations, particularly given the 42.73% weekly gain and recent price momentum.
Risk Management Framework
Asset Allocation Considerations
- Conservative investors: Minimal allocation given extreme volatility
- Active investors: Tactical positions sizing appropriate to risk tolerance
- Institutional investors: Due diligence on protocol development progress before significant deployment
Risk Mitigation Approaches
- Portfolio diversification across multiple asset classes to reduce concentrated exposure
- Dollar-cost averaging to manage entry points during volatile periods
- Consideration of hedging instruments for larger positions
Security Practices
- Hardware wallet storage for significant holdings
- Cold storage for long-term positions
- Reputable exchange custody only for active trading amounts
V. Investment Risks & Challenges
Market Risks
- Extreme price volatility (97.21% annual decline despite recent recovery)
- Limited trading liquidity may result in slippage on significant transactions
- Susceptibility to market sentiment shifts given low market capitalization
Regulatory Risks
- Uncertainty regarding regulatory treatment of decentralized operating systems across jurisdictions
- Potential compliance challenges for enterprise adoption claims
- Evolving international frameworks for blockchain protocols
Technical Risks
- Dependency on IBC protocol functionality and ecosystem maturity
- Competition from established and emerging Web3 infrastructure platforms
- Execution risk on roadmap deliverables and adoption metrics
- Security vulnerabilities inherent to new protocol implementations
Project-Specific Risks
- Adoption challenges in converting institutional interest to actual usage
- Market concentration risk given low trading volume
- Sustainability of development funding and team resources
VI. Conclusion: Is Andromeda (ANDR) a Good Investment?
Investment Value Assessment
Andromeda presents a specialized infrastructure play within the Web3 ecosystem with ambitious enterprise-focused positioning. However, the 97.21% annual depreciation and low market liquidity indicate significant challenges in market validation and adoption realization. The recent 42.73% weekly gain requires contextual evaluation against the broader downtrend.
Investor Recommendations
✅ Beginner Investors
- Conduct comprehensive project research before any allocation
- Consider position sizing as experimental allocation only
- Utilize secure storage practices for any holdings
✅ Experienced Investors
- Technical analysis-based tactical positioning around key price levels
- Portfolio integration only as minor allocation within diversified holdings
- Active monitoring of protocol development milestones and adoption metrics
✅ Institutional Investors
- Detailed assessment of team credentials and development progress
- Evaluation of competitive positioning against established Web3 infrastructure
- Clear milestone-based deployment strategy aligned with risk parameters
⚠️ Critical Disclaimer
Cryptocurrency investments carry substantial risk, including potential total loss of capital. This report is provided for informational purposes only and does not constitute investment advice, financial recommendation, or solicitation to purchase or sell any asset. All investment decisions should be made independently after thorough research and consultation with qualified financial advisors. Past price performance does not guarantee future results.
Report generated: January 2, 2026
Data source: Gate Data / Andromeda Protocol
Andromeda (ANDR) Comprehensive Research Report - FAQ Section
FAQ
Q1: What is Andromeda (ANDR) and what problem does it solve in the Web3 ecosystem?
A: Andromeda (ANDR) is positioned as the first true 100% on-chain, IBC-enabled, decentralized Web3 Operating System (OS). It addresses application building and composition challenges by providing products, tools, and utilities designed to be simpler, better, cheaper, and faster than existing alternatives. The protocol emphasizes institutional-grade engineering, security, and user experience while mitigating single-chain functionality risks through inter-blockchain communication capabilities and expanded total addressable market optionality.
Q2: What is the current market performance and price status of ANDR as of January 2, 2026?
A: As of January 2, 2026, ANDR trades at $0.000695 USD with a market capitalization of $167,590.79. The token demonstrates extreme volatility with a 24-hour gain of +22.61%, a 7-day gain of +42.73%, yet a devastating 1-year decline of -97.21% from its all-time high of $0.5869 (May 2024). Current trading volume is $12,661.54 with 241,137,829.61 tokens in circulation (24.11% of total supply), placing the project at market ranking #4,332 with 0.000021% market dominance.
Q3: What are the critical risks investors should consider before investing in ANDR?
A: Key investment risks include extreme price volatility and severe historical depreciation, minimal trading liquidity that may create slippage on transactions, significant supply dilution potential (only 24.11% of tokens circulating), limited exchange listings (1 primary exchange), intense competition from established Web3 infrastructure platforms, adoption execution risks converting institutional interest to actual usage, and regulatory uncertainty regarding decentralized operating systems across jurisdictions. The token's 97.21% annual decline demonstrates substantial market challenges and validation concerns.
Q4: What is the supply structure and inflation risk profile of ANDR tokens?
A: ANDR has a total supply of 1,000,000,000 tokens with 241,137,829.61 currently in circulation (24.11%). The fully diluted market capitalization stands at $695,000, while the current market cap based on circulating supply is $167,590.79. The significant portion of tokens not yet in circulation presents substantial dilution risks as additional token releases occur. This supply dynamic directly influences long-term value preservation and represents a key factor in investment evaluation.
Q5: What are the price predictions for ANDR across different timeframes through 2031?
A: Short-term (2026) forecasts range from $0.000526 (conservative) to $0.001003 (bullish). Mid-term outlooks (2027-2029) project gradual recovery with ranges from $0.000493-$0.000925 (2027) to $0.000786-$0.001407 (2029). Long-term scenarios (2031) suggest base case of $0.000779-$0.001893, optimistic scenario of $0.001500-$0.002500, and transformative scenario of $0.003000 and above. These predictions reflect significant uncertainty and represent analyst consensus rather than guaranteed outcomes.
Q6: How does ANDR's liquidity situation affect investment accessibility?
A: ANDR faces substantial liquidity constraints with only $12,661.54 in 24-hour trading volume and listing on only 1 primary exchange. This limited liquidity environment presents challenges for market entry and exit at desired price levels, potentially resulting in significant slippage on larger transactions. The restricted trading activity and low volume-to-market-cap ratio indicate market inefficiencies and difficulties for institutional adoption, making position sizing particularly important for risk management.
Q7: What investment strategies are most suitable for different investor profiles considering ANDR's volatility profile?
A: Conservative investors should maintain minimal allocation given extreme volatility, utilizing dollar-cost averaging over extended periods if participating. Active/experienced traders may capitalize on volatility through tactical positioning around key technical levels, particularly exploiting the recent 42.73% weekly gain. Institutional investors should conduct detailed due diligence on team credentials, competitive positioning, and development milestones before significant deployment. All investor profiles should employ secure cold storage for holdings, portfolio diversification, and clear risk management frameworks appropriate to their capital preservation requirements.
Q8: Is Andromeda (ANDR) a viable long-term investment for 2026-2031, and what conditions would determine investment success?
A: ANDR's long-term viability depends critically on ecosystem adoption realization, enterprise integration achievement, and successful multi-chain interoperability implementation. While the protocol's technological ambitions are substantive, the 97.21% annual depreciation, limited market dominance, and divergent analyst forecasts indicate significant validation challenges. Success scenarios require breakthrough progress in institutional adoption, widespread application usage, and substantial technical execution. However, investors must acknowledge substantial downside risks including competitive displacement, regulatory challenges, and funding sustainability concerns. This remains a high-risk, speculative investment suitable only for investors with extended time horizons and elevated risk tolerance.
* The information is not intended to be and does not constitute financial advice or any other recommendation of any sort offered or endorsed by Gate.