This comprehensive analysis examines whether deBridge (DBR) is a sound investment for 2024 and beyond. DBR, a cross-chain DeFi liquidity infrastructure token launched October 2024 on Solana, trades at $0.01798 with a $32.36 million market capitalization. The article evaluates core investment factors including token supply mechanisms (1.8 billion circulating of 10 billion total), institutional adoption patterns across 26 Gate exchanges, and technological advantages in cross-chain asset movement. Price forecasts range from conservative $0.0127-$0.0204 (2026) to optimistic $0.0350-$0.0412 scenarios through 2031. Critical analysis addresses market volatility (-38.82% annually), regulatory uncertainties in multiple jurisdictions, and smart contract risks inherent in bridge protocols. Investment strategies accommodate different risk profiles through position sizing, dollar-cost averaging, and secure storage recommendations. The analysis concludes DBR represents a specialized mid-cap DeFi infrastructure play requiri
Introduction: deBridge (DBR) Investment Position and Market Outlook
deBridge (DBR) represents a notable asset in the cryptocurrency sector, having launched in October 2024 with a focus on decentralized finance (DeFi) cross-chain liquidity infrastructure. As of January 21, 2026, DBR maintains a market capitalization of approximately $32.36 million, with a circulating supply of 1.8 billion tokens and a current price of $0.01798. The token operates on the Solana blockchain and is traded across 26 exchanges, with approximately 89,266 holders. Positioned as DeFi's internet of liquidity, deBridge enables real-time movement of assets and information across the DeFi landscape without the bottlenecks and risks associated with traditional liquidity pools. The platform's approach to supporting cross-chain interactions through deep liquidity, tight spreads, and guaranteed rates has positioned it within discussions regarding emerging cross-chain infrastructure solutions. This analysis examines DBR's investment characteristics, historical performance, future price considerations, and associated risks to provide reference information for market participants evaluating the token's position within the broader cryptocurrency ecosystem.
I. DBR Price History Review and Current Investment Value
- 2024: Token launch on October 17 → DBR opened at $0.03, experiencing initial market volatility
- 2024: Peak valuation reached on December 22 → DBR price climbed to $0.05764
- 2024-2026: Market adjustment phase → Price declined from December peak to current levels
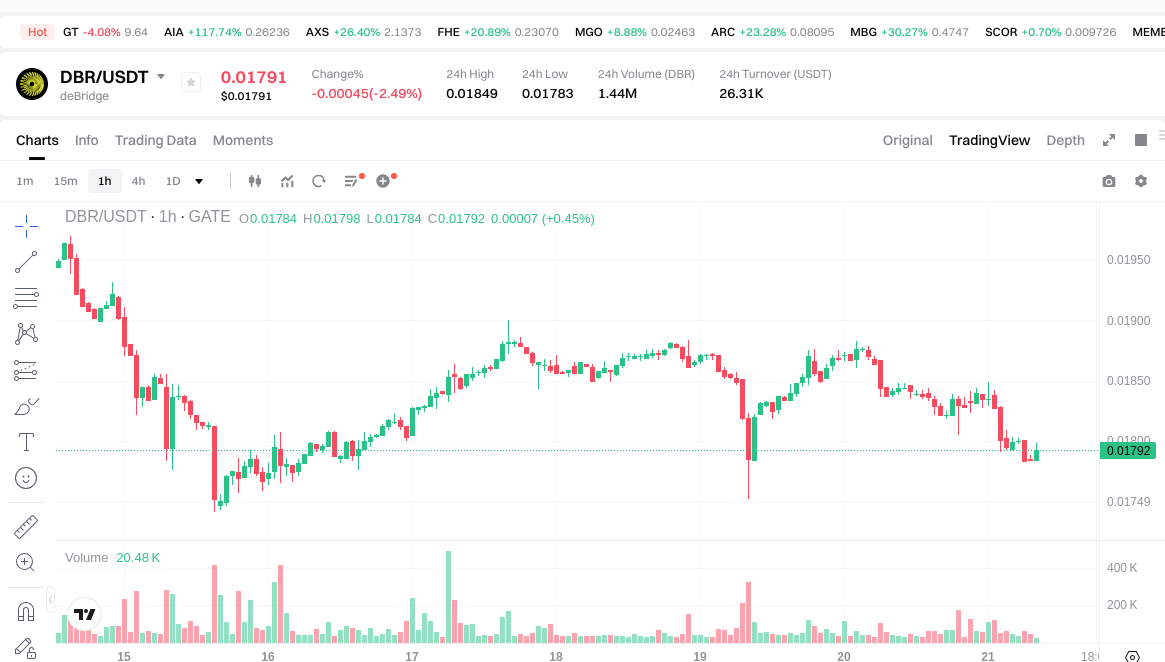
Current DBR Investment Market Status (January 2026)
- DBR current price: $0.01798
- 24-hour price change: -2.71%
- 24-hour trading volume: $26,293.33
- 24-hour price range: $0.01783 - $0.01849
- Market capitalization: $32.36 million
- Circulating supply: 1.8 billion DBR (18% of total supply)
- Fully diluted valuation: $179.8 million
- Total supply: 10 billion DBR
- Number of holders: 89,266
- Listed on 26 exchanges
Click to view real-time DBR market price
II. Core Factors Affecting Whether DBR Is a Good Investment (Is deBridge(DBR) a Good Investment)
Supply Mechanism and Scarcity (DBR investment scarcity)
- Supply Structure → Influences price and investment value
- DBR has a maximum supply of 10,000,000,000 tokens, with 1,800,000,000 currently in circulation (18% circulating supply)
- The circulating supply represents a relatively small portion of the total supply, suggesting potential for future token releases that could impact scarcity dynamics
- As of January 21, 2026, the market capitalization stands at approximately $32.36 million, with a fully diluted valuation of $179.8 million
- Investment Significance: The controlled release of tokens and the gap between circulating and maximum supply could influence long-term investment considerations, as increased circulation may affect supply-side dynamics
Institutional Investment and Mainstream Adoption (Institutional investment in DBR)
- Holder Distribution: DBR currently has 89,266 token holders, indicating a growing community base
- Exchange Presence: The token is listed on 26 exchanges, providing accessibility for investors across multiple platforms
- Market Positioning: deBridge positions itself as DeFi's internet of liquidity, enabling real-time movement of assets and information across the DeFi landscape without the bottlenecks and risks of traditional liquidity pools
Macroeconomic Environment's Impact on DBR Investment
- Market Performance Context: DBR's price has declined 38.82% over the past year, reflecting broader market sentiment and macroeconomic conditions affecting the cryptocurrency sector
- Volatility Considerations: Recent price action shows a 24-hour decline of 2.71% and a 7-day decline of 6.92%, demonstrating the asset's sensitivity to short-term market fluctuations
- Market Capitalization: With a market dominance of 0.0057%, DBR represents a smaller-cap investment within the cryptocurrency ecosystem, which may be influenced by broader economic trends and risk appetite
Technology and Ecosystem Development (Technology & Ecosystem for DBR investment)
- Core Technology: deBridge operates as a cross-chain interoperability protocol, supporting asset and information transfers across the DeFi landscape with features including deep liquidity, tight spreads, and guaranteed rates
- Technical Infrastructure: The protocol eliminates traditional liquidity pool bottlenecks and associated risks, potentially offering efficiency advantages for cross-chain interactions
- DeFi Integration: deBridge's positioning within the DeFi ecosystem provides exposure to decentralized finance applications, which could support investment value through ecosystem expansion and increased cross-chain activity
- Blockchain Standard: DBR utilizes the SPL20 token standard, operating within the Solana ecosystem, which may benefit from Solana's technical characteristics and network developments
III. DBR Future Investment Forecast & Price Outlook (Is deBridge(DBR) worth investing in 2026-2031)
Short-term Investment Outlook (2026, short-term DBR investment outlook)
- Conservative forecast: $0.0127 - $0.0179
- Neutral forecast: $0.0179 - $0.0204
- Optimistic forecast: $0.0204 - $0.0220
Mid-term Investment Outlook (2027-2029, mid-term deBridge(DBR) investment forecast)
- Market stage expectation: Based on price prediction data, DBR may experience gradual growth during this period, with potential price appreciation driven by cross-chain liquidity demand and DeFi ecosystem development.
- Investment return forecast:
- 2027: $0.0106 - $0.0255
- 2028: $0.0163 - $0.0257
- 2029: $0.0183 - $0.0336
- Key catalysts: Cross-chain protocol adoption, expansion of DeFi liquidity solutions, and broader integration across multiple blockchain networks.
Long-term Investment Outlook (Is DBR a good long-term investment?)
- Base scenario: $0.0217 - $0.0350 (assuming steady protocol development and moderate market growth)
- Optimistic scenario: $0.0350 - $0.0412 (assuming increased cross-chain activity and favorable DeFi market conditions)
- Risk scenario: $0.0127 - $0.0183 (under adverse market conditions or reduced adoption)
Click to view DBR long-term investment & price prediction: Price Prediction
2026-01-21 - 2031 Long-term Outlook
- Base scenario: $0.0217 - $0.0350 (corresponding to steady progress and gradual mainstream application growth)
- Optimistic scenario: $0.0350 - $0.0412 (corresponding to large-scale adoption and favorable market environment)
- Transformational scenario: Above $0.0412 (in case of breakthrough ecosystem developments and mainstream adoption)
- 2031-12-31 predicted high: $0.0392 (based on optimistic development assumptions)
Disclaimer: The above forecasts are based on historical data and market analysis models. Cryptocurrency investments carry significant risks, and past performance does not guarantee future results. Investors should conduct independent research and consider their risk tolerance before making investment decisions.
| Year |
Predicted High Price |
Predicted Average Price |
Predicted Low Price |
Price Change |
| 2026 |
0.0204288 |
0.01792 |
0.0127232 |
0 |
| 2027 |
0.025501952 |
0.0191744 |
0.01054592 |
6 |
| 2028 |
0.0256889024 |
0.022338176 |
0.01630686848 |
24 |
| 2029 |
0.03361895488 |
0.0240135392 |
0.018250289792 |
33 |
| 2030 |
0.0412072332672 |
0.02881624704 |
0.0253582973952 |
60 |
| 2031 |
0.039213148972032 |
0.0350117401536 |
0.021707278895232 |
94 |
IV. DBR Investment Strategy and Risk Management (How to invest in deBridge)
Investment Methodology (DBR investment strategy)
Long-term Holding (HODL DBR)
For conservative investors seeking exposure to cross-chain DeFi infrastructure, a long-term holding strategy may be considered. This approach involves:
- Dollar-Cost Averaging (DCA): Regular purchases at fixed intervals to mitigate timing risk
- Position Building: Gradual accumulation during market corrections
- Holding Period: Multi-year horizon aligned with DeFi ecosystem development
This strategy suits investors who believe in the fundamental value proposition of deBridge's liquidity infrastructure and are willing to weather short-term volatility.
Active Trading
Experienced traders may employ active strategies based on:
- Technical Analysis: Chart patterns, support/resistance levels, and momentum indicators
- Swing Trading: Capitalizing on price fluctuations within identified ranges
- Event-Driven Trading: Positioning around protocol updates, partnership announcements, or market catalysts
Given DBR's 24-hour volatility range of $0.01783-$0.01849 and recent price movements, active traders should maintain strict discipline with entry and exit points.
Risk Management (Risk management for DBR investment)
Asset Allocation Guidelines
Conservative Investors (Low Risk Tolerance)
- DBR allocation: 1-3% of crypto portfolio
- Total crypto exposure: 5-10% of overall investment portfolio
- Focus on established assets with DBR as a satellite position
Aggressive Investors (Moderate Risk Tolerance)
- DBR allocation: 5-10% of crypto portfolio
- Total crypto exposure: 15-25% of overall investment portfolio
- Balanced approach combining major cryptocurrencies and infrastructure tokens
Professional/Sophisticated Investors
- DBR allocation: Up to 15% of crypto portfolio
- Total crypto exposure: 25%+ of overall investment portfolio
- Strategic positioning in DeFi infrastructure with active management
Risk Hedging Strategies
Portfolio Diversification
- Combine DBR with assets across different categories (Layer 1s, DeFi protocols, stablecoins)
- Geographic and regulatory diversification
- Balance between high-volatility and stable assets
Hedging Instruments
- Stablecoin reserves for rebalancing opportunities
- Correlation analysis with broader DeFi sector
- Consider portfolio rebalancing during extreme market movements
Secure Storage Solutions
Cold Storage Options
- Hardware wallets compatible with Solana ecosystem (given DBR's SPL20 standard)
- Ledger Nano S Plus / Ledger Nano X
- Multi-signature wallets for larger holdings
Hot Wallet Considerations
- Solana-compatible wallets (Phantom, Solflare) for active trading
- Enable two-factor authentication (2FA)
- Limit hot wallet holdings to trading amounts only
Best Practices
- Never store significant amounts on exchanges
- Maintain secure backup of recovery phrases
- Regular security audits of wallet configurations
- Consider splitting holdings across multiple storage solutions
V. DBR Investment Risks and Challenges (Risks of investing in deBridge)
Market Risks
High Volatility
DBR exhibits significant price fluctuations characteristic of mid-cap DeFi tokens:
- 1-hour change: +0.16%
- 24-hour change: -2.71%
- 7-day change: -6.92%
- 30-day change: -5.04%
- 1-year change: -38.82%
The token has experienced substantial price swings since its launch, with a recorded range between $0.005 (October 17, 2024) and $0.05764 (December 22, 2024). Current trading at $0.01798 represents a 68.8% decline from its peak.
Liquidity Considerations
With a 24-hour trading volume of approximately $26,293 and availability on 26 exchanges, DBR's liquidity profile suggests:
- Potential for slippage on larger orders
- Vulnerability to concentrated trading activity
- Limited depth compared to major cryptocurrencies
Market Manipulation Risks
Mid-cap tokens with relatively lower liquidity may be susceptible to:
- Pump-and-dump schemes
- Coordinated trading activities
- Whale movements impacting price discovery
Regulatory Risks
Jurisdictional Uncertainty
Cross-chain DeFi protocols face evolving regulatory landscapes:
United States
- Ongoing SEC scrutiny of DeFi protocols
- Potential classification issues around token utility vs. security
- Compliance requirements for cross-chain bridge operations
European Union
- Markets in Crypto-Assets (MiCA) regulation implementation
- Licensing requirements for crypto service providers
- Anti-money laundering (AML) obligations
Asia-Pacific Region
- Varying approaches from supportive to restrictive frameworks
- Uncertain regulatory treatment of cross-chain infrastructure
- Compliance challenges across multiple jurisdictions
Compliance Evolution
- DeFi protocols may face pressure to implement KYC/AML measures
- Potential restrictions on cross-border liquidity flows
- Regulatory actions could impact protocol functionality or token value
Technical Risks
Smart Contract Vulnerabilities
Cross-chain bridge protocols present complex attack surfaces:
- Multi-chain deployment increases potential vulnerability points
- Historical industry incidents involving bridge exploits
- Dependency on validator security and integrity
Network Security Concerns
As DBR operates on Solana (SPL20 standard):
- Exposure to Solana network stability and performance issues
- Reliance on underlying blockchain security
- Potential impact from network congestion or outages
Protocol Upgrade Risks
- Implementation challenges during major updates
- Potential bugs introduced through new features
- Community governance decisions affecting protocol direction
- Migration risks when expanding to new blockchain networks
Operational Dependencies
- Reliance on validator network integrity
- Third-party integration risks
- Oracle dependencies for cross-chain price feeds
- Potential single points of failure in infrastructure
VI. Conclusion: Is deBridge a Good Investment?
Investment Value Summary
DBR presents a specialized investment thesis centered on cross-chain DeFi infrastructure. Key considerations include:
Potential Strengths
- Positioning in the growing cross-chain liquidity sector
- Technical approach avoiding traditional liquidity pool limitations
- Circulating supply of 1.8 billion tokens (18% of max supply) suggests controlled distribution
- Holder base of 89,266 indicates community engagement
Notable Considerations
- Market capitalization of approximately $32.4 million places DBR in the mid-cap category
- Fully diluted valuation of $179.8 million implies potential dilution as more tokens enter circulation
- Price performance showing -38.82% decline over one year reflects challenging market conditions
- Market dominance of 0.0057% indicates niche positioning within crypto markets
Investor Recommendations
✅ New Investors
Approach: Education and gradual entry
- Begin with small position sizing (1-2% of crypto allocation)
- Implement dollar-cost averaging over extended periods
- Prioritize secure storage using hardware wallets compatible with Solana
- Thoroughly research cross-chain bridge technology and associated risks
- Avoid investing amounts beyond acceptable loss tolerance
✅ Experienced Investors
Approach: Strategic positioning with active management
- Consider DBR as part of diversified DeFi infrastructure exposure
- Employ technical analysis for entry/exit timing
- Monitor protocol development, partnership announcements, and adoption metrics
- Implement portfolio rebalancing strategies during significant price movements
- Maintain awareness of broader DeFi sector trends and competitive landscape
✅ Institutional Investors
Approach: Due diligence-based strategic allocation
- Conduct comprehensive technical and operational due diligence
- Evaluate regulatory compliance and risk frameworks
- Consider position sizing within broader cross-chain infrastructure thesis
- Implement professional custody solutions
- Monitor protocol governance and development roadmap
- Assess liquidity requirements against trading volumes
Risk Disclosure
⚠️ Important Notice: Cryptocurrency investments carry substantial risk and may not be suitable for all investors. DBR, like all crypto assets, experiences high volatility and faces multiple risk factors including market, regulatory, and technical uncertainties. This analysis is provided for informational purposes only and does not constitute investment advice, financial advice, trading advice, or recommendations. Investors should conduct independent research, consider their financial circumstances, and consult qualified financial advisors before making investment decisions. Past performance does not indicate future results. Only invest capital you can afford to lose entirely.
VII. FAQ
Q1: What is the current circulating supply of DBR tokens and how does it affect investment value?
As of January 21, 2026, DBR has a circulating supply of 1.8 billion tokens, representing only 18% of the maximum supply of 10 billion tokens. This controlled circulation creates a significant gap between current market capitalization ($32.36 million) and fully diluted valuation ($179.8 million), meaning future token releases could substantially impact supply dynamics and price. The gradual unlock schedule suggests potential dilution pressure as the remaining 82% of tokens enter circulation over time, which investors should consider when evaluating long-term holdings and scarcity assumptions.
Q2: How has DBR performed since its launch and what is its current market position?
DBR launched on October 17, 2024, at $0.03 and reached its peak of $0.05764 on December 22, 2024, before declining to its current price of $0.01798—a 68.8% drop from peak and -38.82% decline over one year. The token maintains a relatively modest market capitalization of approximately $32.4 million with 0.0057% market dominance, positioning it as a mid-cap asset within the cryptocurrency ecosystem. With 24-hour trading volume of $26,293 and listings on 26 exchanges, DBR exhibits limited liquidity compared to major cryptocurrencies, which may impact execution for larger trades.
Q3: What makes deBridge different from traditional cross-chain bridges?
deBridge distinguishes itself by eliminating the bottlenecks and risks associated with traditional liquidity pools, offering deep liquidity, tight spreads, and guaranteed rates for cross-chain interactions. The protocol positions itself as "DeFi's internet of liquidity," enabling real-time movement of assets and information across the DeFi landscape without requiring capital to be locked in discrete pools. This architectural approach potentially reduces vulnerability to the concentrated liquidity attacks that have affected traditional bridge protocols, though it introduces its own technical complexity and operational dependencies that require ongoing security validation.
Q4: What are the primary risks associated with investing in DBR?
DBR faces multiple risk categories: (1) Market risks including high volatility (7-day decline of -6.92%), limited liquidity with $26,293 daily volume, and potential for manipulation in a mid-cap token; (2) Regulatory uncertainty affecting cross-chain DeFi protocols across jurisdictions, particularly U.S. SEC scrutiny and evolving European MiCA regulations; (3) Technical vulnerabilities inherent in cross-chain bridge protocols, including smart contract risks, dependency on Solana network stability, and operational security of validator networks. The token's -38.82% annual decline reflects these combined risk factors and challenging market conditions.
Q5: What investment strategies are appropriate for different investor types considering DBR?
Conservative investors should limit DBR to 1-3% of their crypto portfolio using dollar-cost averaging and hardware wallet storage, treating it as a satellite position within broader diversified holdings. Experienced traders may allocate 5-10% of crypto holdings while employing technical analysis, swing trading around the $0.01783-$0.01849 range, and event-driven positioning around protocol updates. Sophisticated investors might dedicate up to 15% of crypto portfolios with active management, implementing professional custody solutions and comprehensive due diligence on protocol governance, competitive landscape, and cross-chain infrastructure adoption trends.
Q6: What are the long-term price predictions for DBR through 2031?
Based on current analysis models, DBR's predicted price trajectory shows: 2026 range of $0.0127-$0.0204, 2027 reaching $0.0106-$0.0255, 2028 expanding to $0.0163-$0.0257, 2029 at $0.0183-$0.0336, 2030 between $0.0254-$0.0412, and 2031 estimated at $0.0217-$0.0392. The base scenario assumes steady protocol development and moderate market growth, the optimistic scenario factors increased cross-chain activity and favorable DeFi conditions, while the risk scenario ($0.0127-$0.0183) accounts for adverse market conditions or reduced adoption. These forecasts carry significant uncertainty and depend on multiple variables including technology adoption, regulatory developments, and macroeconomic conditions.
Q7: How does DBR's holder distribution and exchange availability impact liquidity?
DBR's 89,266 token holders indicate a developing community base, though this represents relatively modest distribution compared to established cryptocurrencies. Availability on 26 exchanges provides multi-platform accessibility, but the 24-hour trading volume of approximately $26,293 suggests limited depth for larger transactions. This liquidity profile means investors may experience slippage on orders exceeding a few thousand dollars, concentrated whale movements could significantly impact price discovery, and rapid position exits during market stress may prove challenging. Investors should size positions accordingly and consider liquidity constraints when developing entry and exit strategies.
Q8: What role does DBR's Solana-based infrastructure play in its investment thesis?
DBR utilizes the SPL20 token standard on Solana, exposing the token to both opportunities and risks associated with the Solana ecosystem. Potential advantages include Solana's high throughput, low transaction costs, and growing DeFi ecosystem that could support cross-chain liquidity demand. However, this creates dependencies on Solana network stability, historical outage concerns, and the broader health of Solana-based DeFi applications. Investors should monitor Solana's technical developments, network performance metrics, and ecosystem growth as these factors directly influence DBR's operational environment and potential adoption as a cross-chain infrastructure solution.
* The information is not intended to be and does not constitute financial advice or any other recommendation of any sort offered or endorsed by Gate.