Explore the potential of Eesee (ESE) as an investment with a thorough market report detailing its price performance, technical architecture, and risks. The article provides key insights into ESE's historical milestones, current market valuation, and future price outlook, assisting investors in evaluating long-term prospects. Targeted at cryptocurrency enthusiasts, traders, and investors, the piece outlines potential returns and strategic considerations. Comprehensive yet concise, it offers a logical sequence from past performance review to risk assessment, fostering informed decision-making in the volatile crypto market. Visit Gate for real-time pricing forecasts.
Introduction: Eesee (ESE) Investment Position and Market Prospects
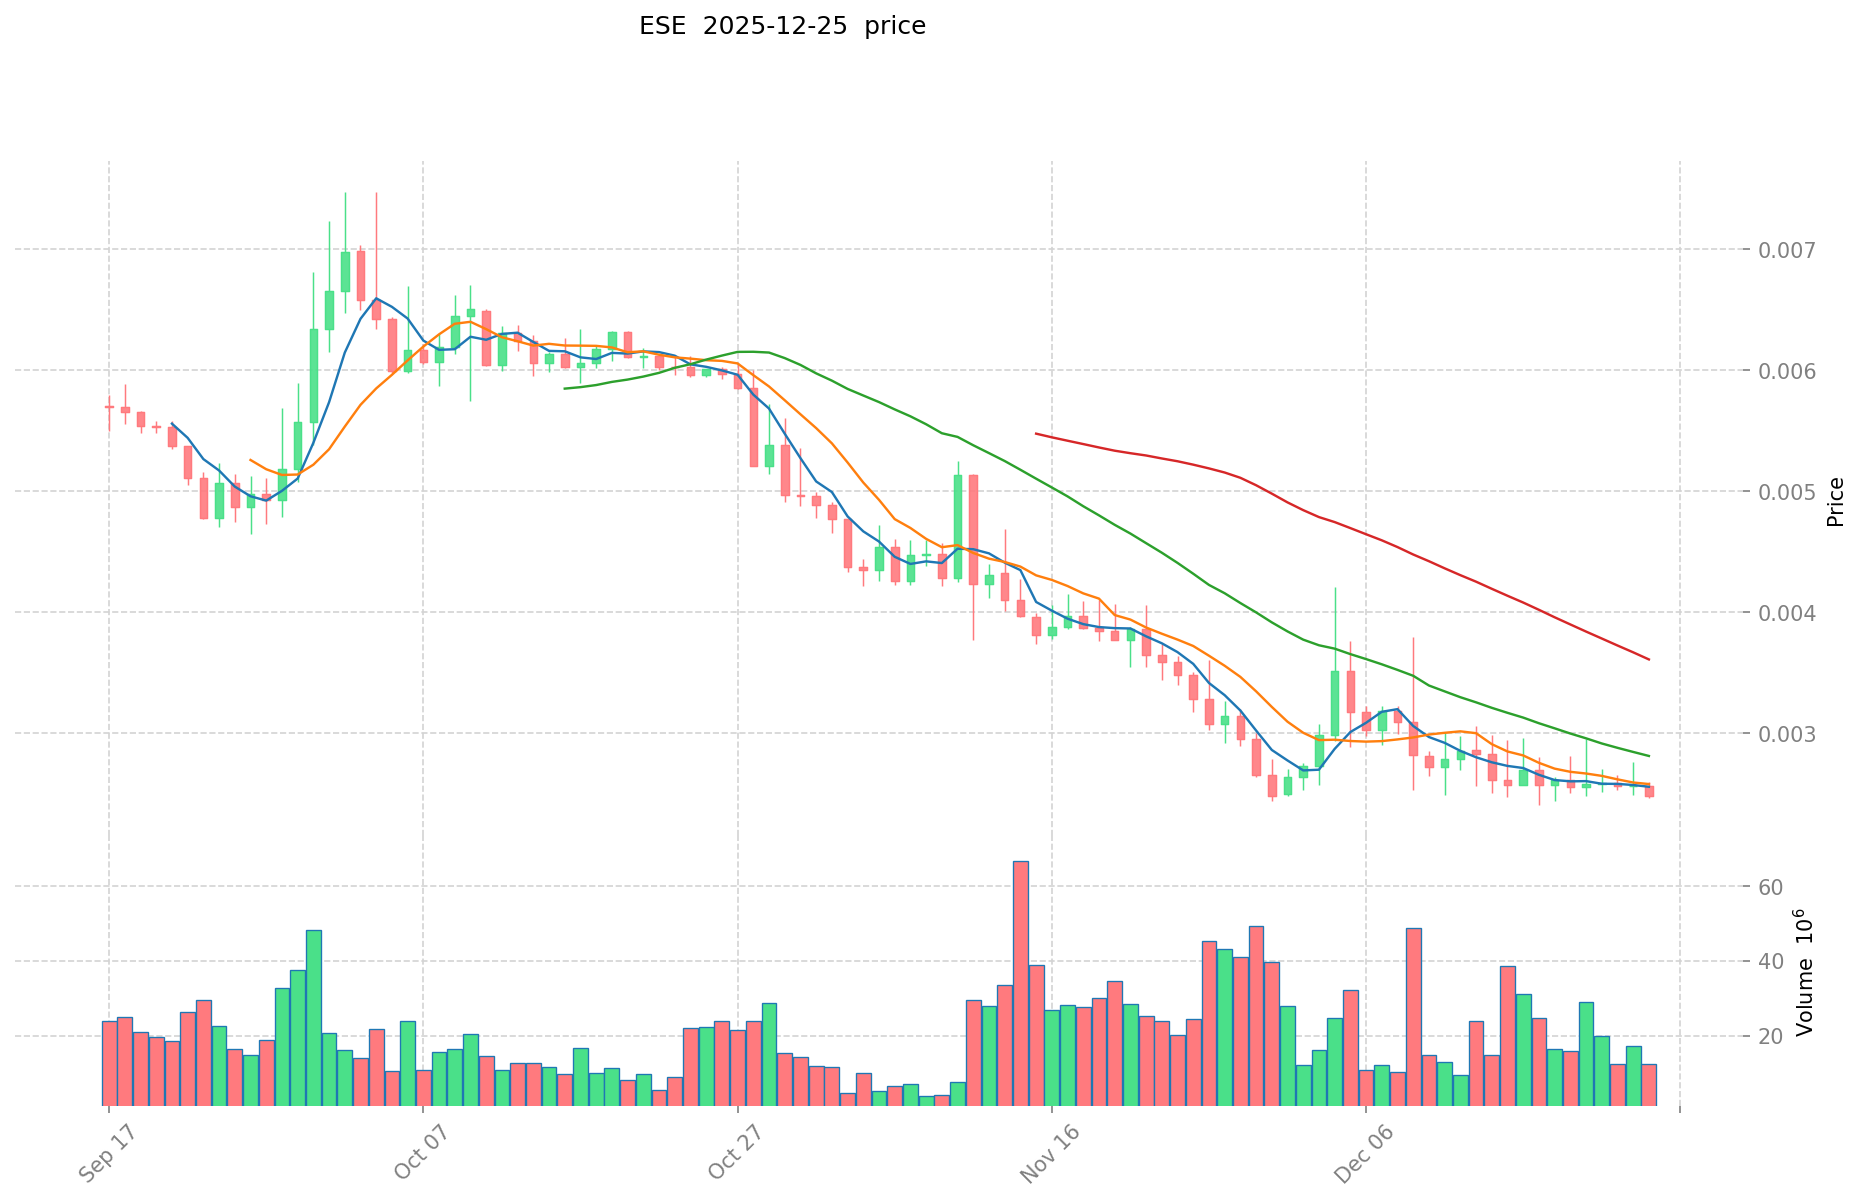
ESE is an important asset in the cryptocurrency field. Since its launch in April 2024, it has achieved notable progress in the liquidity solutions sector. As of December 2025, ESE's fully diluted valuation stands at USD 2,485,000, with a circulating supply of approximately 621.78 million tokens and a current price of around USD 0.002485. Positioned as a "one-stop liquidity solution for sellers with a fun and safe raffle system," ESE has gradually become a focal point when investors discuss whether Eesee (ESE) represents a viable investment opportunity. This article provides a comprehensive analysis of ESE's investment value, historical price performance, future price projections, and investment risks to inform investor decision-making.
Eesee (ESE) Comprehensive Market Analysis Report
I. ESE Price History Review and Current Investment Value Status
ESE Historical Price Trends and Investment Returns
Key Price Milestones:
-
April 2024: All-time high reached at $0.29157, representing the peak investor sentiment period during the project's early trading phase.
-
December 2025: All-time low recorded at $0.002406, indicating significant price contraction from historical peaks, representing a decline of approximately 99.18% from the all-time high.
-
Long-term Performance (1-year): Price declined -91.22%, falling from approximately $0.028303 to the current level of $0.002485.
Current ESE Investment Market Status (December 26, 2025)
Real-time Market Data:
- Current Price: $0.002485
- 24-Hour Price Range: $0.002433 - $0.002553
- 24-Hour Trading Volume: $27,434.90
- Market Capitalization: $1,545,130.18
- Fully Diluted Valuation: $2,485,000.00
- Circulating Supply: 621,782,770.53 ESE (62.18% of total supply)
- Total Supply: 1,000,000,000 ESE
- Market Dominance: 0.000077%
Recent Price Performance Metrics:
| Time Period |
Price Change |
Change Amount |
| 1 Hour |
+0.16% |
+0.000003969648562301 |
| 24 Hours |
-2.08% |
-0.000052785947712419 |
| 7 Days |
-0.12% |
-0.000002985582699239 |
| 30 Days |
-23.71% |
-0.000772307641892778 |
| 1 Year |
-91.22% |
-0.025817961275626425 |
Market Emotion Indicator: Neutral (Score: 0)
For real-time ESE market pricing, visit Gate ESE Price
II. Project Overview and Technical Architecture
Project Introduction
Eesee (ESE) is a comprehensive liquidity solution platform specifically designed for sellers, featuring a distinctive raffle system that combines entertainment with security at minimal cost. The protocol is tailored for digital assets, tokens, and Real World Assets (RWAs).
Core Value Proposition:
- Accelerates sales velocity for digital asset holders
- Provides additional liquidity and trading volume to market participants
- Empowers creators and artists through accessible Web3 market entry
- Reduces cost barriers for entry into Web3 markets through innovative protocol design
Technical Specifications
- Blockchain Network: Ethereum (ERC20)
- Contract Address: 0x908dDb096BFb3AcB19e2280aAD858186ea4935C4
- Token Standard: ERC20
- Algorithm: ERC20 (Ethereum-based)
III. Market Distribution and Holder Analysis
Token Distribution Metrics
- Active Holders: 3,295 addresses
- Circulating Supply Ratio: 62.18% of total supply in circulation
- Token Concentration Risk: Moderate, with significant portion of supply not yet circulated
Market Structure
- Exchange Listings: 7 exchanges
- Trading Accessibility: Multi-exchange availability supports price discovery and liquidity provision
Launch and Initial Market Reception
- Publication Date: April 11, 2024
- Launch Price: $0.018
- Price Appreciation from Launch to ATH: 1,619.83% (from $0.018 to $0.29157)
- Time to Peak: Approximately 1 month from launch
Decline Phase Analysis
- Peak to Current Low: 99.18% decline from all-time high
- Duration: Approximately 8.5 months
- Current Valuation vs. Launch: 86.19% below launch price
V. Project Resources and Community Channels
Official Links:
VI. Risk Assessment and Market Considerations
Identified Risk Factors
Volatility Risk: ESE exhibits extreme price volatility, with a 99.18% decline from all-time highs, indicating significant market instability and potential liquidity concerns.
Market Concentration Risk: With only 3,295 active holders and a market dominance of 0.000077%, ESE represents a micro-cap asset with limited market infrastructure and potentially thin order books.
Liquidity Risk: 24-hour trading volume of approximately $27,434.90 relative to market cap suggests potential liquidity constraints that could impact position entry and exit efficiency.
Supply Risk: 37.82% of total token supply remains uncirculated, creating potential dilution concerns upon future token releases.
VII. Disclaimer
This report is prepared for informational purposes only and does not constitute investment advice, financial recommendations, or solicitation to buy or sell assets. Cryptocurrency markets are highly volatile and speculative. Investors should conduct comprehensive due diligence and consult qualified financial advisors before making investment decisions. Past price performance does not guarantee future results. Digital asset investments carry substantial risks, including potential total loss of capital.
Report Generated: December 26, 2025
Data Currency: December 26, 2025 02:16:49 UTC
Eesee (ESE) Investment Analysis Report
I. Executive Summary
Eesee (ESE) is a one-stop liquidity solution platform tailored for sellers, featuring a raffle system designed for digital assets, tokens, and Real-World Assets (RWAs). As of December 26, 2025, ESE trades at $0.002485 with a market capitalization of approximately $1.55 million and a fully diluted valuation of $2.49 million. The token ranks #2304 in the broader cryptocurrency market.
Key Metrics (as of December 26, 2025):
- Current Price: $0.002485
- 24-Hour Change: -2.08%
- Total Circulating Supply: 621,782,770.53 ESE
- Total Supply: 1,000,000,000 ESE
- Market Cap: $1,545,130.18
- 24-Hour Trading Volume: $27,434.90
- Active Holders: 3,295
II. Core Factors Affecting Whether Eesee (ESE) is a Good Investment
Supply Mechanism & Scarcity
The ESE token operates with a fixed total supply of 1 billion tokens, with approximately 62.18% currently in circulation. The remaining 37.82% of tokens are not yet circulated, representing a significant supply overhang that could impact long-term price dynamics. This supply structure means that future token releases may exert downward pressure on valuations, particularly if market adoption does not correspondingly increase demand proportionally to supply expansion.
The current circulating-to-fully-diluted ratio of 62.18% indicates that ESE has crossed approximately two-thirds of its token release schedule, suggesting the project is in a mature phase of token distribution.
Eesee positions itself as a liquidity acceleration solution that lowers entry barriers for Web3 market participants. The platform's stated objectives include:
- Accelerating sales velocity for digital asset sellers
- Providing additional liquidity and trading volume to markets
- Reducing cost barriers to Web3 market entry through proprietary protocol mechanisms
- Empowering artists and digital asset creators
Current adoption metrics show 3,295 token holders and trading activity across 7 exchange platforms. These figures suggest an early-stage but limited user base relative to mature DeFi protocols.
Historical Price Movements:
- All-Time High: $0.29157 (April 11, 2024)
- All-Time Low: $0.002406 (December 17, 2025)
- 1-Year Performance: -91.22%
- 30-Day Performance: -23.71%
- 7-Day Performance: -0.12%
- 24-Hour Performance: -2.08%
- 1-Hour Performance: +0.16%
ESE has experienced severe price depreciation from its all-time high, declining approximately 99.15% from peak valuations. The token has recently approached its all-time low, indicating sustained selling pressure and negative market sentiment.
Market Position & Liquidity
With a current market dominance of 0.000077%, ESE occupies an extremely small position within the broader cryptocurrency ecosystem. Daily trading volume of approximately $27,435 relative to market capitalization of $1.55 million suggests limited liquidity depth. The token is available on 7 exchanges, providing moderate accessibility but not indicating strong institutional or mainstream adoption.
III. Technical & Ecosystem Development
Blockchain Infrastructure
ESE operates as an ERC-20 token on the Ethereum blockchain, utilizing Ethereum's established infrastructure and security model. The token contract address is 0x908dDb096BFb3AcB19e2280aAD858186ea4935C4.
Project Documentation & Development
Eesee maintains a whitepaper accessible via Google Docs, indicating ongoing documentation of protocol mechanics. The project maintains active communication channels including:
IV. Market Sentiment & Price Outlook Perspectives
Various market analysis platforms present divergent price predictions for ESE:
Bearish Perspectives:
- Multiple technical indicators suggest bearish momentum for 2025
- WalletInvestor predicts a decline to $0.002087 by 2026, characterizing ESE as a poor investment option
- Token unlock schedules create bearish pressure on valuations
Mixed-to-Optimistic Perspectives:
- Some predictions anticipate ESE trading within a range of $0.035961 to $0.038208 by end of 2025
- Alternative simulations project potential growth to $0.002662 under favorable conditions by 2025
- Long-term forecasts (by 2028-2030) suggest potential recovery, though with substantial uncertainty
Important Note: Price predictions from third-party sources demonstrate significant variance and should not be considered reliable indicators. Cryptocurrency price forecasting remains highly speculative.
V. Risk Considerations
-
Severe Price Depreciation: 91.22% annual decline represents substantial value erosion for existing holders.
-
Limited Market Adoption: Only 3,295 holders and $27k daily volume indicate early-stage or stalled user adoption.
-
Supply Overhang: Approximately 378 million unconverted tokens could exert downward pressure if released to market.
-
Liquidity Constraints: Trading volume relative to market cap suggests potential execution risk for larger position transactions.
-
Market Positioning: Extremely small market dominance (0.000077%) indicates vulnerability to broader market dynamics.
VI. Conclusion
Eesee presents characteristics typical of early-stage or struggling cryptocurrency projects: limited adoption metrics, severe price depreciation, and significant supply-side headwinds. While the platform's liquidity solution concept addresses a real market need, current execution metrics do not substantiate a compelling investment thesis. Market participants should conduct comprehensive due diligence regarding project development velocity, ecosystem growth, and competitive positioning within the broader DeFi landscape before making investment decisions.
Report Generated: December 26, 2025
III. ESE Future Investment Forecast and Price Outlook (Is Eesee(ESE) worth investing in 2025-2030)
Short-term Investment Forecast (2025, short-term ESE investment outlook)
- Conservative forecast: $0.00238 - $0.00248
- Neutral forecast: $0.00248 - $0.00305
- Optimistic forecast: $0.00305 - $0.00350
Mid-term Investment Outlook (2026-2028, mid-term Eesee(ESE) investment forecast)
- Market phase expectations: ESE enters an early recovery and adoption phase with gradual protocol expansion and increasing liquidity provision for digital assets and RWAs.
- Investment return forecast:
- 2026: $0.00174 - $0.00390 (11% upside potential)
- 2027: $0.00276 - $0.00433 (33% upside potential)
- 2028: $0.00364 - $0.00475 (54% upside potential)
Long-term Investment Outlook (Is Eesee(ESE) a good long-term investment?)
- Base scenario: $0.00361 - $0.00474 (corresponding to steady market growth and mainstream adoption of the liquidity protocol)
- Optimistic scenario: $0.00450 - $0.00520 (corresponding to accelerated Web3 adoption and expanded RWA integration)
- Risk scenario: $0.00261 - $0.00350 (corresponding to market stagnation or competitive pressures in the liquidity solution space)
View ESE long-term investment and price forecast: Price Prediction
2025-12-26 - 2030 Long-term Outlook
- Base scenario: $0.00388 - $0.00472 USD (corresponding to steady advancement in market adoption and protocol development)
- Optimistic scenario: $0.00473 - $0.00520 USD (corresponding to large-scale adoption and favorable market conditions)
- Transformative scenario: $0.00520 USD and above (if the ecosystem achieves breakthrough progress and mainstream adoption)
- 2030-12-31 Forecast Peak: $0.00473 USD (based on optimistic development assumptions)
Disclaimer
This analysis is for informational purposes only and does not constitute investment advice. Cryptocurrency markets are highly volatile and subject to significant risks. Past performance does not guarantee future results. Investors should conduct their own research and consult with qualified financial advisors before making investment decisions.
| 年份 |
预测最高价 |
预测平均价格 |
预测最低价 |
涨跌幅 |
| 2025 |
0.00304794 |
0.002478 |
0.00237888 |
0 |
| 2026 |
0.0038957877 |
0.00276297 |
0.0017406711 |
11 |
| 2027 |
0.004328192505 |
0.00332937885 |
0.0027633844455 |
33 |
| 2028 |
0.0047476942401 |
0.0038287856775 |
0.003637346393625 |
54 |
| 2029 |
0.004545534356328 |
0.0042882399588 |
0.002615826374868 |
72 |
| 2030 |
0.004726069258593 |
0.004416887157564 |
0.003886860698656 |
77 |
Eesee (ESE) Cryptocurrency Research Report
I. Project Overview
Eesee is a one-stop liquidity solution designed for sellers, featuring a fun and safe raffle system at an affordable cost. The platform is tailored specifically for digital assets, tokens, and Real-World Assets (RWAs).
Core Value Proposition
- Accelerates sales velocity for asset sellers
- Provides additional liquidity and trading volume to the market
- Empowers artists through accessible web3 market entry
- Lowers cost barriers to enter the web3 market using a unique protocol
Technical Specifications
- Token Standard: ERC20
- Blockchain: Ethereum (ETH)
- Contract Address: 0x908dDb096BFb3AcB19e2280aAD858186ea4935C4
- Total Supply: 1,000,000,000 ESE
- Circulating Supply: 621,782,770.53 ESE (62.18% of total supply)
Current Market Position
- Current Price: $0.002485 (as of December 26, 2025)
- Market Capitalization: $1,545,130.18
- Fully Diluted Valuation (FDV): $2,485,000.00
- Market Dominance: 0.000077%
- Market Ranking: 2,304
- Active Holders: 3,295
- Trading Volume (24H): $27,434.90
| Time Period |
Change |
Amount |
| 1 Hour |
+0.16% |
+$0.000004 |
| 24 Hours |
-2.08% |
-$0.000053 |
| 7 Days |
-0.12% |
-$0.000003 |
| 30 Days |
-23.71% |
-$0.000772 |
| 1 Year |
-91.22% |
-$0.025818 |
Historical Price Extremes
- All-Time High: $0.29157 (April 11, 2024)
- All-Time Low: $0.002406 (December 17, 2025)
- 24-Hour Range: $0.002433 - $0.002553
Market Metrics
- Launch Price: $0.018
- Current Price vs. Launch: -86.19% decline
- Current Price vs. ATH: -99.15% decline
- Market Cap vs. FDV Ratio: 62.18%
III. IV. Investment Strategy & Risk Management
Investment Methodology (ESE Investment Strategy)
Long-term Holding (HODL ESE)
Suitable for conservative investors seeking exposure to web3 liquidity solutions and RWA tokenization trends. Given the significant price decline from ATH and early-stage project status, long-term holders should be prepared for extended recovery periods.
Active Trading
Dependent on technical analysis and swing trading strategies. The current price proximity to all-time lows may present entry opportunities for risk-tolerant traders, though volatility remains high.
Risk Management (Risk Management for ESE Investment)
Asset Allocation Guidelines
- Conservative Investors: 0.5-1% portfolio allocation maximum
- Active Traders: 2-3% for swing trading positions
- Professional Investors: Strategic allocation based on web3 infrastructure thesis (typically 1-2% of crypto portfolio)
Risk Hedging Solutions
- Multi-asset portfolio diversification across different blockchain sectors
- Utilization of stablecoins for downside protection
- Correlation analysis with broader crypto market indices
- Position sizing relative to individual risk tolerance
Secure Storage
- Hot Wallets: Limited holdings for active trading (MetaMask, Ledger Live)
- Cold Wallets: Primary holdings in hardware wallets (Ledger Nano X, Trezor)
- Smart Contract Risks: Consider security audits before interacting with Eesee protocol
V. Investment Risks & Challenges
Market Risk
- High Volatility: 91.22% decline over 12 months demonstrates extreme price fluctuation
- Low Liquidity: Trading volume of $27,434.90 indicates limited market depth
- Price Manipulation Risk: Small market cap (ranked 2,304) susceptible to price manipulation
Regulatory Risk
- Uncertain Policy Environment: RWA tokenization faces evolving regulatory frameworks across jurisdictions
- Smart Contract Regulation: Raffle mechanisms may face regulatory scrutiny in certain markets
- Compliance Uncertainty: Variable treatment of tokens across different countries
Technology Risk
- Protocol Security: Reliance on novel raffle mechanism requires continuous security audits
- Smart Contract Vulnerability: ERC20-based implementation subject to potential exploits
- Network Dependency: Ethereum network risks and scaling challenges
- Early-Stage Technology: Limited operational history increases technical uncertainty
Business & Adoption Risk
- Market Adoption: Unproven demand for raffle-based liquidity solutions
- Competition: Existing liquidity solutions and emerging competitors
- Team & Execution: Early-stage project execution capability uncertainties
VI. Conclusion: Is ESE a Good Investment?
Investment Value Summary
Eesee presents a differentiated approach to web3 liquidity through its raffle-based mechanism tailored for digital assets and RWAs. However, the token has experienced severe depreciation (-91.22% over 12 months) from its launch price, indicating significant market skepticism regarding either the project's execution or market demand. The current price near all-time lows may represent either a buying opportunity or continued decline depending on protocol adoption trajectory.
Investor Recommendations
✅ Beginners:
- Consider limited exploratory positions only after thorough protocol research
- Dollar-cost averaging strategy if committing capital
- Mandatory hardware wallet storage for any holdings
✅ Experienced Investors:
- Swing trading around support/resistance levels (current low near $0.002406)
- Combine with broader web3 infrastructure allocation
- Monitor on-chain activity and holder distribution metrics
✅ Institutional Investors:
- Evaluate strategic RWA tokenization thesis merit
- Conduct independent security audits of raffle protocol
- Consider limited allocation if validating market demand signals
Resources
⚠️ Disclaimer: Cryptocurrency investments carry substantial risk including total capital loss. This report is provided for informational purposes only and does not constitute investment advice. Conduct independent research and consult qualified financial advisors before making investment decisions.
Eesee (ESE) Comprehensive Investment Analysis - Frequently Asked Questions
I. FAQ
Q1: What is Eesee (ESE) and what problem does it solve in the cryptocurrency market?
A: Eesee (ESE) is a one-stop liquidity solution platform designed specifically for sellers, featuring a distinctive raffle system that combines entertainment with security at minimal cost. The protocol addresses critical challenges in web3 adoption by accelerating sales velocity for digital asset holders, providing additional liquidity and trading volume to market participants, empowering creators and artists through accessible web3 market entry, and reducing cost barriers to web3 market access through innovative protocol design. ESE operates as an ERC-20 token on the Ethereum blockchain and is tailored for digital assets, tokens, and Real-World Assets (RWAs).
Q2: What are the current market metrics and price performance of ESE as of December 2025?
A: As of December 26, 2025, ESE trades at $0.002485 with a market capitalization of $1,545,130.18 and a fully diluted valuation of $2,485,000. The token has a circulating supply of 621.78 million ESE (62.18% of total supply) with 3,295 active holders and daily trading volume of approximately $27,434.90 across 7 exchange platforms. Recent price performance shows: 1-hour change of +0.16%, 24-hour change of -2.08%, 30-day change of -23.71%, and 12-month change of -91.22%. The token ranks #2,304 in overall market capitalization with a market dominance of 0.000077%.
Q3: How has ESE's price performed since its launch, and what are the key price milestones?
A: ESE launched in April 2024 at $0.018 and experienced rapid initial appreciation to an all-time high of $0.29157 in April 2024, representing a 1,619.83% increase within approximately one month. However, the token has subsequently declined to an all-time low of $0.002406 recorded on December 17, 2025, representing a 99.18% decline from the peak. Current price is 86.19% below the launch price. The 12-month performance shows a -91.22% decline, indicating sustained selling pressure and negative market sentiment throughout 2025.
Q4: What are the primary investment risks associated with ESE?
A: ESE presents several material investment risks: (1) Extreme Volatility Risk - The token has experienced 91.22% annual decline and 99.18% decline from all-time highs, indicating severe market instability; (2) Market Concentration Risk - Only 3,295 active holders and 0.000077% market dominance indicate limited market infrastructure and thin order books; (3) Liquidity Risk - Daily trading volume of $27,434.90 relative to market cap suggests potential execution challenges for larger position transactions; (4) Supply Risk - 37.82% of total token supply (approximately 378 million tokens) remains uncirculated, creating potential dilution upon future releases; (5) Technology Risk - Early-stage protocol with limited operational history; (6) Adoption Risk - Unproven demand for raffle-based liquidity solutions relative to existing competitors.
Q5: What are the price forecasts and investment outlook for ESE through 2030?
A: Price forecasts vary by timeframe and scenario: Short-term (2025): Conservative forecast of $0.00238-$0.00248, neutral forecast of $0.00248-$0.00305, optimistic forecast of $0.00305-$0.00350. Mid-term (2026-2028): 2026 forecasts range from $0.00174-$0.00390 (11% upside potential); 2027 forecasts range from $0.00276-$0.00433 (33% upside potential); 2028 forecasts range from $0.00364-$0.00475 (54% upside potential). Long-term (2030): Base scenario of $0.00361-$0.00474, optimistic scenario of $0.00450-$0.00520, and risk scenario of $0.00261-$0.00350. The 2030-12-31 forecast peak is projected at $0.00473 USD under optimistic development assumptions. These projections depend heavily on protocol adoption acceleration and favorable market conditions.
Q6: Is ESE suitable for conservative versus active investors, and what are the recommended allocation strategies?
A: ESE allocation recommendations vary by investor profile: Conservative Investors should limit positions to 0.5-1% of total portfolio allocation maximum and consider long-term holding strategies only after thorough protocol research; Active Traders can allocate 2-3% for swing trading positions, leveraging technical analysis around support/resistance levels; Institutional Investors should evaluate strategic allocation of 1-2% if validating market demand signals for RWA tokenization thesis. All investors should employ multi-asset portfolio diversification across blockchain sectors, utilize stablecoins for downside protection, and implement secure storage practices using hardware wallets for primary holdings and hot wallets only for active trading amounts.
Q7: What is the token supply structure of ESE and how might future token releases impact price dynamics?
A: ESE operates with a fixed total supply of 1,000,000,000 tokens, with 621,782,770.53 tokens currently in circulation (62.18% of total supply). The remaining 378,217,229.47 tokens (37.82%) are not yet circulated, representing a significant supply overhang. This supply structure indicates that ESE has crossed approximately two-thirds of its token release schedule, suggesting the project is in a mature phase of token distribution. Future token releases to market may exert downward pressure on valuations, particularly if market adoption does not increase demand proportionally to supply expansion. Investors should monitor token unlock schedules and vesting timelines, as supply-side pressure could negatively impact future price appreciation potential.
Q8: What resources and community channels are available for ESE research and monitoring?
A: Official Eesee resources include the main website at https://eesee.io/, comprehensive blockchain explorer data available at https://etherscan.io/token/0x908dDb096BFb3AcB19e2280aAD858186ea4935C4, active social media engagement on Twitter/X at https://twitter.com/eesee_io, and technical documentation accessible via https://docs.google.com/document/d/1dnmt7VAKNsv8BqGTRmmaXPaIyDvso_YZ47nZ-J_lxVM/edit. The token trades on 7 exchange platforms, providing multi-venue access for trading and liquidity monitoring. Investors should regularly monitor on-chain metrics including holder distribution, transaction volume, and smart contract interactions to assess adoption trends and validate investment thesis.
Disclaimer: This analysis is for informational purposes only and does not constitute investment advice, financial recommendations, or solicitation to buy or sell assets. Cryptocurrency markets are highly volatile and speculative. Investors should conduct comprehensive due diligence and consult qualified financial advisors before making investment decisions. Past price performance does not guarantee future results. Digital asset investments carry substantial risks, including potential total loss of capital.
Report Generated: December 26, 2025
* The information is not intended to be and does not constitute financial advice or any other recommendation of any sort offered or endorsed by Gate.