# Article Introduction: Is ForTube (FOR) a Good Investment?
This comprehensive analysis examines ForTube (FOR), a distributed encrypted digital finance protocol, evaluating its investment potential across market fundamentals, technical indicators, and risk factors. The report addresses critical questions for crypto investors: whether FOR represents a viable opportunity given its 99.7% decline from historical highs, current $0.0005057 price point, and minimal $285,072 market cap. Through detailed assessment of token economics, price trajectories, ecosystem positioning, and multi-year forecasts through 2030, this guide equips both newcomers and experienced traders with actionable insights on portfolio allocation strategies. Structured around market data verification via Gate, technical risk analysis, and scenario-based price predictions, the article serves investors seeking transparent evaluation of DeFi infrastructure protocol viability and clear guidance on whether FOR merits portfolio inclusion.
Introduction: ForTube (FOR) Investment Position and Market Prospects
FOR is an important asset in the cryptocurrency domain. Since its launch in April 2019, it has achieved notable progress in distributed digital finance services. As of December 31, 2025, FOR's fully diluted valuation stands at USD 505,700, with a circulating supply of approximately 563.72 million tokens and a current price hovering around USD 0.0005057. Positioned as a "distributed encrypted digital financial service protocol," FOR has gradually become a focal point when investors discuss whether ForTube (FOR) represents a viable investment opportunity. This article provides a comprehensive analysis of FOR's investment value, historical price trends, future price predictions, and investment risks to serve as a reference for investors.
ForTube (FOR) Crypto Asset Research Report
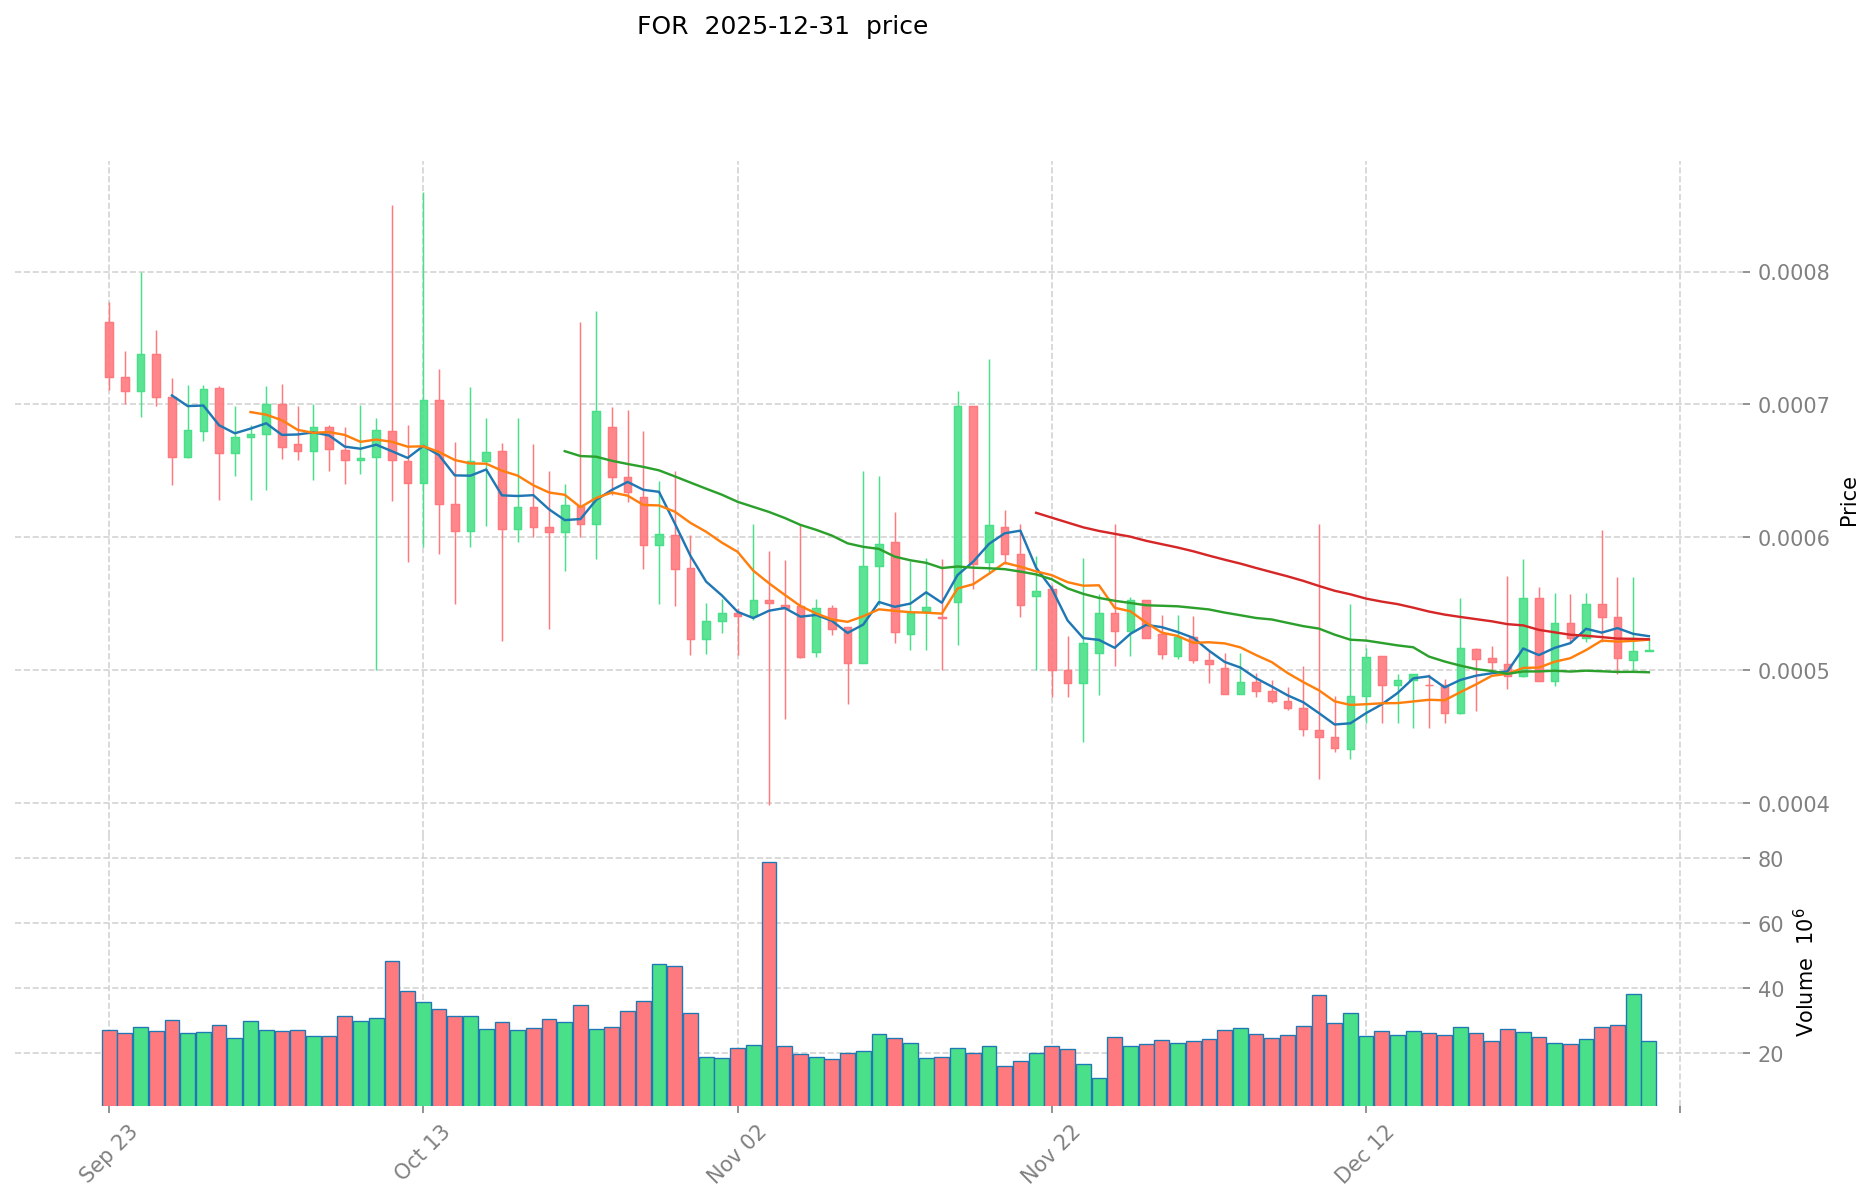
I. FOR Price History Review and Current Investment Value
FOR Historical Price Trends and Investment Returns
Key Historical Milestones:
- April 2021: Peak price of $0.167203, representing the all-time high (ATH) for the asset
- December 31, 2025: Current price of $0.0005057, down approximately 99.7% from historical peak
- November 4, 2025: All-time low (ATL) of $0.00041552 reached
Current FOR Investment Market Status (December 31, 2025)
Real-Time Market Data:
- Current Price: $0.0005057 USD
- 24-Hour Trading Volume: $12,414.10 USD
- Market Capitalization: $285,072.20 USD
- Fully Diluted Valuation (FDV): $505,700.00 USD
- Circulating Supply: 563,718,021.23 FOR (56.37% of total supply)
- Total Supply: 1,000,000,000 FOR
- Total Holders: 22,685
Recent Price Performance:
- 1-Hour Change: -1.043%
- 24-Hour Change: -1.99%
- 7-Day Change: -6.13%
- 30-Day Change: -1.35%
- 1-Year Change: -72.11%
View real-time FOR market price on Gate
II. Project Overview
Protocol Specification and Technical Architecture
FOR (The Force Protocol) is a distributed encrypted digital financial service protocol designed to empower decentralized finance application development. The protocol operates based on mainstream public chain systems and underlying cross-chain infrastructure.
Core Functionality:
- Provides SDK and API integration solutions for DeFi application developers
- Enables cross-platform asset circulation and transfer
- Facilitates transaction depth sharing across multiple protocols
- Supports cross-chain encrypted asset mortgage mechanisms
- Issues stablecoins backed by cross-chain collateral
- Enables token bond issuance and on-chain payment processing
- Provides transaction settlement and clearing solutions
Network and Distribution Specifications
Smart Contract Details:
- Chain: Ethereum (ETH)
- Contract Address: 0x1fcdce58959f536621d76f5b7ffb955baa5a672f
- Block Explorer: Etherscan
Token Economics:
- Maximum Supply: 1,000,000,000 FOR (fixed cap)
- Circulating Supply: 563,718,021.23 FOR
- Circulation Ratio: 56.37%
- Initial Publication Price (ICO): $0.02
III. Current Market Position and Ecosystem Status
Market Ranking and Valuation Metrics
- Market Rank: #3,776 by market capitalization
- Market Dominance: 0.000015% of total cryptocurrency market
- Market Cap to FDV Ratio: 56.37%
- Number of Exchange Listings: 2
- Average Holder Count: 22,685
Trading and Liquidity Analysis
Current Trading Dynamics:
- 24-Hour High: $0.0005233
- 24-Hour Low: $0.0005022
- Trading Range: Minimal daily volatility in current cycle
The relatively low trading volume and narrow price range indicate limited market liquidity and reduced speculative interest in the asset during the current period.
IV. Risk Assessment and Market Considerations
Disclaimer: This report is intended for informational purposes only and does not constitute investment advice. The cryptocurrency market is highly volatile and speculative. Past performance does not guarantee future results. Investors should conduct thorough due diligence and consult with qualified financial advisors before making investment decisions.
Key Risk Factors
Valuation Risk:
- Extreme drawdown from historical highs (99.7% decline from ATH)
- Minimal market capitalization relative to total supply
- Limited trading liquidity with low 24-hour volume
Market Concentration Risk:
- Small number of active holders relative to total supply
- Concentrated liquidity across limited exchange venues
- Reduced price discovery mechanisms in illiquid markets
Protocol and Ecosystem Risk:
- Success dependent on DeFi application adoption
- Cross-chain protocol exposure to multiple blockchain risks
- Regulatory uncertainties affecting stablecoin and financial protocols
V. Reference Materials and Sources
This report is based on available market data and protocol documentation as of the specified date. Market conditions, protocol updates, and regulatory frameworks are subject to rapid change. Readers are encouraged to verify all information through official channels and conduct independent analysis.
ForTube (FOR) Investment Analysis Report
Report Date: December 31, 2025
I. Executive Summary
ForTube (FOR), also known as The Force Protocol, is a distributed encrypted digital financial service protocol designed to empower decentralized financial application development. As of December 31, 2025, FOR is trading at $0.0005057, with a market capitalization of $285,072.20 and a fully diluted valuation of $505,700.00. The token ranks 3,776 in market capitalization and exhibits bearish short-term price action, with a 24-hour decline of -1.99% and a significant year-to-date decline of -72.11%.
II. Core Factors Influencing Whether ForTube (FOR) is a Good Investment
Supply Mechanism and Scarcity
- Total Supply: 1,000,000,000 FOR tokens
- Circulating Supply: 563,718,021.23 FOR tokens (56.37% of total supply)
- Circulating Ratio: 56.37%
The token maintains a fixed maximum supply structure with approximately 56% currently in circulation. This supply mechanism indicates that additional token releases remain possible, which could exert downward pressure on price if significant unlocking events occur.
Historical Price Performance:
- All-Time High: $0.167203 (April 12, 2021)
- All-Time Low: $0.00041552 (November 4, 2025)
- Current Price: $0.0005057
- 24-Hour Range: $0.0005022 - $0.0005233
Price Movements:
- 1-Hour Change: -1.043%
- 24-Hour Change: -1.99%
- 7-Day Change: -6.13%
- 30-Day Change: -1.35%
- 1-Year Change: -72.11%
The token demonstrates significant negative momentum across multiple timeframes, with a 72% decline over the past year indicating substantial deterioration in investor sentiment.
Market Structure and Liquidity
- 24-Hour Trading Volume: $12,414.10
- Market Capitalization: $285,072.20
- Fully Diluted Valuation: $505,700.00
- Market Cap to FDV Ratio: 56.37%
- Number of Holders: 22,685
- Market Dominance: 0.000015%
The relatively low trading volume in relation to market cap suggests limited liquidity, which may impact the ease of entry and exit for investors. The modest holder count of 22,685 indicates a dispersed investor base.
Token Economics and Initial Valuation
- Initial Launch Price: $0.02 (April 21, 2019)
- Current Price Premium/Discount: 97.47% decline from launch price
The dramatic depreciation from the initial offering price underscores the significant value erosion experienced by early investors.
III. Investment Outlook and Market Sentiment
Current Market Sentiment
Multiple technical analyses and price prediction sources indicate a bearish outlook for ForTube in 2025:
- Dominant Forecast Trend: Bearish sentiment based on multiple technical quantitative indicators
- General Assessment: Multiple sources suggest ForTube may represent a high-risk, poor investment opportunity
- Technical Analysis: Current technical indicators support a bearish market outlook
Price Prediction Range
Available forecasts for 2025 present a wide range of potential outcomes:
- Conservative Estimates: $0.000431 - $0.000547
- Optimistic Estimates: $0.0006556 (representing +29.90% upside)
- More Bullish Forecasts: Up to $0.1271 (representing significant upside potential)
- Bearish Forecasts: Decline to $0.0004861 by January 27, 2026
Protocol Functionality
ForTube provides solutions for:
- Cross-platform asset circulation and flow
- In-depth transaction sharing mechanisms
- Stablecoin issuance backed by cross-chain encrypted asset collateral
- Token bond issuance
- On-chain payment infrastructure
- Transaction settlement and clearing mechanisms
Network Implementation
- Blockchain Network: Ethereum (ETH)
- Contract Address: 0x1fcdce58959f536621d76f5b7ffb955baa5a672f
- Active Exchanges: Listed on 2 trading platforms
- Official Website: https://for.tube/home
- Social Presence: Active on Twitter (@ForTubeFi)
V. Risk Considerations
- Severe Price Depreciation: 72% decline over 12 months indicates significant value destruction
- Limited Liquidity: Low 24-hour trading volume relative to market cap may restrict trading flexibility
- Bearish Technical Outlook: Multiple analytical frameworks suggest downward price pressure
- Small Market Cap: $505,700 fully diluted valuation indicates limited market significance and liquidity
- Unfavorable Holder Dynamics: 22,685 holders represent a relatively small investor base for a token with 1 billion total supply
VI. Data Sources and Methodology
This analysis is based on on-chain data as of December 31, 2025, including:
- Real-time price and market capitalization data
- Historical price performance metrics
- Token distribution and supply data
- Technical indicator assessments from multiple forecasting sources
- Blockchain network information
Disclaimer: This report presents factual market data and observable technical indicators. It does not constitute investment advice, financial recommendation, or an endorsement of ForTube as an investment opportunity. Investors should conduct independent research and consult qualified financial advisors before making investment decisions.
III. ForTube (FOR) Future Investment Predictions and Price Outlook
Short-term Investment Prediction (2025-2026, Short-term FOR Investment Outlook)
- Conservative Forecast: $0.00031 - $0.00040
- Neutral Forecast: $0.00040 - $0.00055
- Optimistic Forecast: $0.00055 - $0.00077
Mid-term Investment Outlook (2027-2028, Mid-term ForTube (FOR) Investment Forecast)
-
Market Phase Expectations: FOR is positioned within the decentralized finance ecosystem as a cross-chain protocol solution. The mid-term period reflects gradual recovery from previous downward pressure, with consolidation expected as adoption metrics develop.
-
Investment Return Predictions:
- 2027: $0.00060 - $0.00097
- 2028: $0.00072 - $0.00105
-
Key Catalysts: Expansion of cross-chain asset circulation use cases, adoption of stablecoin issuance solutions, ecosystem partnerships with mainstream DeFi platforms, and regulatory clarity around tokenized financial services.
Long-term Investment Outlook (Is FOR a Good Long-term Investment?)
-
Base Case Scenario: $0.00082 - $0.00165 USD (Assumes steady adoption of the Force Protocol across multiple blockchain networks and gradual institutional integration of decentralized financial infrastructure)
-
Optimistic Scenario: $0.00165 - $0.00330 USD (Assumes accelerated adoption of cross-chain solutions, successful integration with major public blockchains, and widespread implementation of token-based financial instruments)
-
Risk Scenario: $0.00031 - $0.00082 USD (Reflects prolonged regulatory headwinds, reduced DeFi activity, or technological obsolescence relative to competing protocols)
Click to view FOR long-term investment and price forecasts: Price Prediction
2025-12-31 to 2030-12-31 Long-term Outlook
-
Base Case: $0.00082 - $0.00122 USD (Corresponding to steady-state protocol adoption and incremental improvements in cross-chain infrastructure)
-
Optimistic Case: $0.00122 - $0.00330 USD (Corresponding to substantial institutional adoption and favorable macroeconomic conditions for DeFi expansion)
-
Transformative Case: $0.00330 USD and above (Contingent on breakthrough developments in protocol efficiency, mainnet adoption acceleration, or paradigm shifts in tokenized finance acceptance)
-
2030-12-31 Predicted High: $0.00165 USD (Based on favorable development trajectory assumptions)
Disclaimer: This analysis is provided for informational purposes only and does not constitute investment advice. Price predictions involve substantial uncertainty and may differ materially from actual outcomes. Past performance does not guarantee future results. Investors should conduct independent research and consult qualified financial advisors before making investment decisions.
| 年份 |
预测最高价 |
预测平均价格 |
预测最低价 |
涨跌幅 |
| 2025 |
0.000601783 |
0.0005057 |
0.000308477 |
0 |
| 2026 |
0.000769700685 |
0.0005537415 |
0.00039869388 |
9 |
| 2027 |
0.00096611279505 |
0.0006617210925 |
0.000602166194175 |
30 |
| 2028 |
0.001049952857469 |
0.000813916943775 |
0.000724386079959 |
60 |
| 2029 |
0.001295389511865 |
0.000931934900622 |
0.000643035081429 |
84 |
| 2030 |
0.00164822006524 |
0.001113662206243 |
0.00082411003262 |
120 |
ForTube (FOR) Research Report
I. Project Overview
ForTube (FOR), also known as The Force Protocol (原力协议), is a distributed encrypted digital financial service protocol. The project was published on April 21, 2019, with an initial price of $0.02.
Project Description
FOR is a distributed encrypted digital financial service protocol built on mainstream public chain systems and underlying cross-chain protocols. Through abstraction and encapsulation of distributed finance business processes, it provides decentralized financial application development capabilities in the form of SDKs and APIs. The protocol offers one-stop solutions for cross-platform asset circulation, transaction depth sharing, cross-chain encrypted asset mortgage, stablecoin issuance, token bond issuance, on-chain payments, and transaction settlement.
Token Economics
| Metric |
Value |
| Current Price |
$0.0005057 |
| Total Supply |
1,000,000,000 FOR |
| Circulating Supply |
563,718,021.23 FOR |
| Circulation Ratio |
56.37% |
| Total Market Cap |
$505,700 |
| Fully Diluted Valuation |
$505,700 |
| Market Ranking |
3,776 |
| Token Holders |
22,685 |
Blockchain Deployment
FOR token is deployed on the Ethereum (ETH) blockchain with contract address: 0x1fcdce58959f536621d76f5b7ffb955baa5a672f
Price Metrics
| Time Period |
Price Change |
Change Amount |
| 1 Hour |
-1.043% |
-$0.000005330 |
| 24 Hours |
-1.99% |
-$0.000010268 |
| 7 Days |
-6.13% |
-$0.000033024 |
| 30 Days |
-1.35% |
-$0.000006920 |
| 1 Year |
-72.11% |
-$0.001307495 |
Historical Price Range
| Metric |
Value |
Date |
| All-Time High (ATH) |
$0.167203 |
April 12, 2021 |
| All-Time Low (ATL) |
$0.00041552 |
November 4, 2025 |
| 24-Hour High |
$0.0005233 |
|
| 24-Hour Low |
$0.0005022 |
|
Trading Activity
- 24-Hour Trading Volume: 12,414.10 FOR
- Market Share: 0.000015%
- Market Emotion Indicator: Positive (1)
III. Investment Strategy and Risk Management
Investment Methodology
Long-Term Holdings (HODL FOR): Suitable for conservative investors seeking exposure to decentralized finance infrastructure protocols. This approach involves acquiring FOR tokens and maintaining positions regardless of short-term price fluctuations, relying on the potential adoption of the Force Protocol ecosystem.
Active Trading: Appropriate for experienced traders utilizing technical analysis and swing trading strategies. Traders may exploit volatility patterns observed in the project's historical price movements.
Risk Management
Portfolio Allocation:
- Conservative investors: 1-2% allocation to FOR within broader DeFi exposure
- Active traders: 3-5% with strict stop-loss orders
- Specialized investors: Up to 10% with comprehensive hedging strategies
Risk Mitigation Approaches:
- Multi-asset diversification across different DeFi protocols and crypto categories
- Use of stablecoins to hedge against volatility
- Dollar-cost averaging (DCA) to reduce timing risk
Secure Storage:
- Hot wallets: For active trading and frequent transactions
- Cold wallets: For long-term holdings
- Hardware wallet recommendations: For securing larger positions
IV. Investment Risks and Challenges
Market Risk
FOR exhibits significant volatility, with a 72.11% annual decline and recent 6.13% weekly losses. The token's low liquidity (24-hour volume of 12,414 FOR) creates potential for price manipulation and slippage on larger trades.
Regulatory Risk
As a DeFi infrastructure protocol deployed on Ethereum, FOR faces ongoing regulatory uncertainty across different jurisdictions. Changes in cryptocurrency regulations, particularly regarding stablecoins and cross-chain protocols, could materially impact adoption and token value.
Technology Risk
The protocol's reliance on cross-chain mechanisms and smart contract functionality introduces security risks. Contract vulnerabilities, bridge exploits, or network upgrades could threaten protocol functionality and token value.
Liquidity Risk
With only 22,685 token holders and relatively low trading volume, FOR faces concentration and liquidity risks. Significant buy or sell pressure could result in substantial price movement.
V. Conclusion: Is ForTube a Good Investment?
Investment Value Assessment
FOR represents a DeFi infrastructure project with specific use cases in cross-chain finance and stablecoin issuance. However, the protocol exhibits:
- Severe long-term price depreciation (-72.11% annually)
- Minimal market capitalization ($505,700)
- Very low trading volume and liquidity
- Significant distance from historical highs (99.7% below ATH)
Investor Recommendations
✅ Newcomers: If pursuing DeFi infrastructure exposure, implement dollar-cost averaging with small allocation sizes and utilize secure wallet storage.
✅ Experienced Traders: Consider swing trading opportunities around support/resistance levels, with strict technical analysis and position sizing discipline.
✅ Institutional Investors: Strategic allocation typically not recommended given market cap and liquidity constraints; if pursuing protocol exposure, consider direct partnerships with development team rather than token acquisition.
⚠️ Critical Disclaimer: Cryptocurrency investments carry substantial risks including total capital loss. FOR exhibits extreme volatility and minimal liquidity. This report is provided for informational purposes only and does not constitute investment advice. Conduct independent research and consult financial advisors before making investment decisions.
Data Updated: December 31, 2025
ForTube (FOR) Frequently Asked Questions (FAQ)
I. FAQ
Q1: What is ForTube (FOR) and what problem does it solve in the DeFi ecosystem?
A: ForTube (FOR), also known as The Force Protocol, is a distributed encrypted digital financial service protocol designed to empower decentralized finance application development. It operates as a cross-chain infrastructure solution that provides SDK and API integration capabilities for DeFi developers. The protocol addresses fragmentation in decentralized finance by enabling cross-platform asset circulation, transaction depth sharing, cross-chain encrypted asset mortgage, stablecoin issuance, token bond issuance, on-chain payments, and transaction settlement—creating a unified framework for distributed financial services across multiple blockchain networks.
Q2: What is the current market price and valuation of FOR as of December 31, 2025?
A: As of December 31, 2025, FOR is trading at $0.0005057 USD. The token has a market capitalization of $285,072.20, a fully diluted valuation of $505,700, and ranks 3,776 by market cap. The circulating supply is 563,718,021.23 FOR tokens (56.37% of the 1 billion total supply), with 22,685 token holders. The 24-hour trading volume stands at $12,414.10 USD, indicating limited liquidity.
Q3: Has FOR experienced significant price depreciation, and what are the historical price milestones?
A: Yes, FOR has experienced extreme price depreciation. The all-time high (ATH) was $0.167203 reached in April 2021, while the current price of $0.0005057 represents a 99.7% decline from that peak. The token's all-time low (ATL) of $0.00041552 was reached on November 4, 2025. Over the past 12 months, FOR has declined 72.11%, and it has fallen 97.47% from its initial launch price of $0.02 in April 2019. Recent performance shows a 7-day decline of -6.13% and a 24-hour change of -1.99%.
Q4: What are the short-term, mid-term, and long-term price predictions for FOR?
A: Predictions vary based on different market scenarios. Short-term (2025-2026) forecasts range from $0.00031-$0.00077 depending on market conditions. Mid-term (2027-2028) predictions suggest $0.00060-$0.00105 as the protocol gains adoption traction. Long-term outlooks (through 2030) present three scenarios: the base case of $0.00082-$0.00122 USD assuming steady adoption, an optimistic case of $0.00122-$0.00330 USD with substantial institutional adoption, and a transformative case exceeding $0.00330 USD contingent on breakthrough developments. Conservative forecasts suggest potential decline to $0.0004861, while more bullish scenarios predict potential upside to $0.1271, though significant uncertainty exists around all predictions.
Q5: What are the primary investment risks associated with FOR?
A: ForTube presents multiple significant risks. Valuation risk stems from the extreme 99.7% drawdown from historical highs and minimal market capitalization. Market concentration risk emerges from limited active holders (22,685), concentrated liquidity across only 2 exchange venues, and reduced price discovery mechanisms. Protocol and ecosystem risks include dependence on DeFi application adoption, cross-chain protocol exposure to multiple blockchain risks, and regulatory uncertainties affecting stablecoins and financial protocols. Additionally, the extremely low trading volume ($12,414 in 24 hours) creates liquidity risk, while the 72.11% annual decline indicates significant negative momentum and deteriorating investor sentiment.
Q6: Is ForTube (FOR) recommended as a good investment opportunity?
A: Based on current market conditions and technical analysis, FOR presents substantial challenges as an investment opportunity. Multiple technical indicators support a bearish outlook for 2025-2026. The token exhibits severe long-term price depreciation, minimal market capitalization relative to total supply, and very low trading volume that restricts trading flexibility. Conservative investors should consider only minimal allocations (1-2% of DeFi exposure) through dollar-cost averaging strategies. Experienced traders may explore swing trading around technical support/resistance levels with strict discipline. Institutional investors typically should not pursue token acquisition given market cap and liquidity constraints. The investment carries significant risk of total capital loss, and this analysis does not constitute investment advice.
Q7: What supply dynamics exist for FOR, and could future token unlocking affect price?
A: FOR maintains a fixed maximum supply of 1,000,000,000 tokens with 563,718,021.23 currently in circulation, representing 56.37% of total supply. This structure indicates that approximately 436.28 million tokens remain uncirculated. The high circulation ratio combined with the presence of unallocated tokens creates potential downward price pressure if significant unlock events occur or if circulating supply increases substantially. The modest holder count of 22,685 relative to total supply suggests concentration risk. This supply mechanism means that future token releases could exert additional pressure on an already weak price environment characterized by bearish technical indicators and minimal trading interest.
Q8: Where can investors access FOR tokens and monitor the project's development?
A: FOR tokens are available for trading on 2 exchange platforms, though liquidity is limited. The token is deployed on the Ethereum blockchain at contract address 0x1fcdce58959f536621d76f5b7ffb955baa5a672f, which can be verified on Etherscan. Investors can access real-time price data and market information through cryptocurrency data platforms such as Gate. The official project website is available at https://for.tube/home, and the project maintains an active social media presence on Twitter (@ForTubeFi). For secure storage, investors should utilize hardware wallets for long-term holdings and reputable exchanges only for active trading positions. Investors should conduct independent verification of all information through official channels before making any investment decisions.
* The information is not intended to be and does not constitute financial advice or any other recommendation of any sort offered or endorsed by Gate.