This comprehensive analysis evaluates Mango Network (MGO) as an investment opportunity through January 2026. With a market capitalization of $39.08 million and current price of $0.02458, MGO functions as a Layer 1 multi-virtual machine omnichain infrastructure supporting MoveVM, EVM, and SVM. The article examines MGO's price history ranging from $0.005 to $0.08158, evaluates core investment factors including tokenomics and institutional adoption, and provides price predictions spanning 2026-2031 across conservative, neutral, and optimistic scenarios. Strategic investment recommendations address different investor profiles, with allocation guidance from 1-3% for conservative investors to 5-10% for aggressive investors. Critical risk assessments include market volatility, regulatory uncertainties, and technical vulnerabilities inherent in the early-stage platform launched June 2025. Investors should conduct independent research and consult financial advisors before participating in this volatile asset class.
Introduction: Mango Network (MGO)'s Investment Position and Market Outlook
MGO is a significant asset in the cryptocurrency field. As of January 2026, Mango Network holds a market capitalization of approximately $39.08 million, with a circulating supply of about 1.59 billion tokens, and the current price maintains around $0.02458. With its positioning as a Layer 1 multi-virtual machine omnichain infrastructure, MGO has gradually become a focal point for investors discussing "Is Mango Network (MGO) a good investment?" The project addresses fragmented user experience and liquidity challenges in Web3 applications and DeFi protocols by integrating the core advantages of Move, OPStack, and ZK Rollup technologies, while supporting MoveVM, EVM, and SVM to provide developers and users with secure, modular, and high-performance Web3 infrastructure. This article will comprehensively analyze MGO's investment value, historical trends, future price projections, and investment risks to provide reference for investors.
I. Mango Network (MGO) Price History Review and Current Investment Value
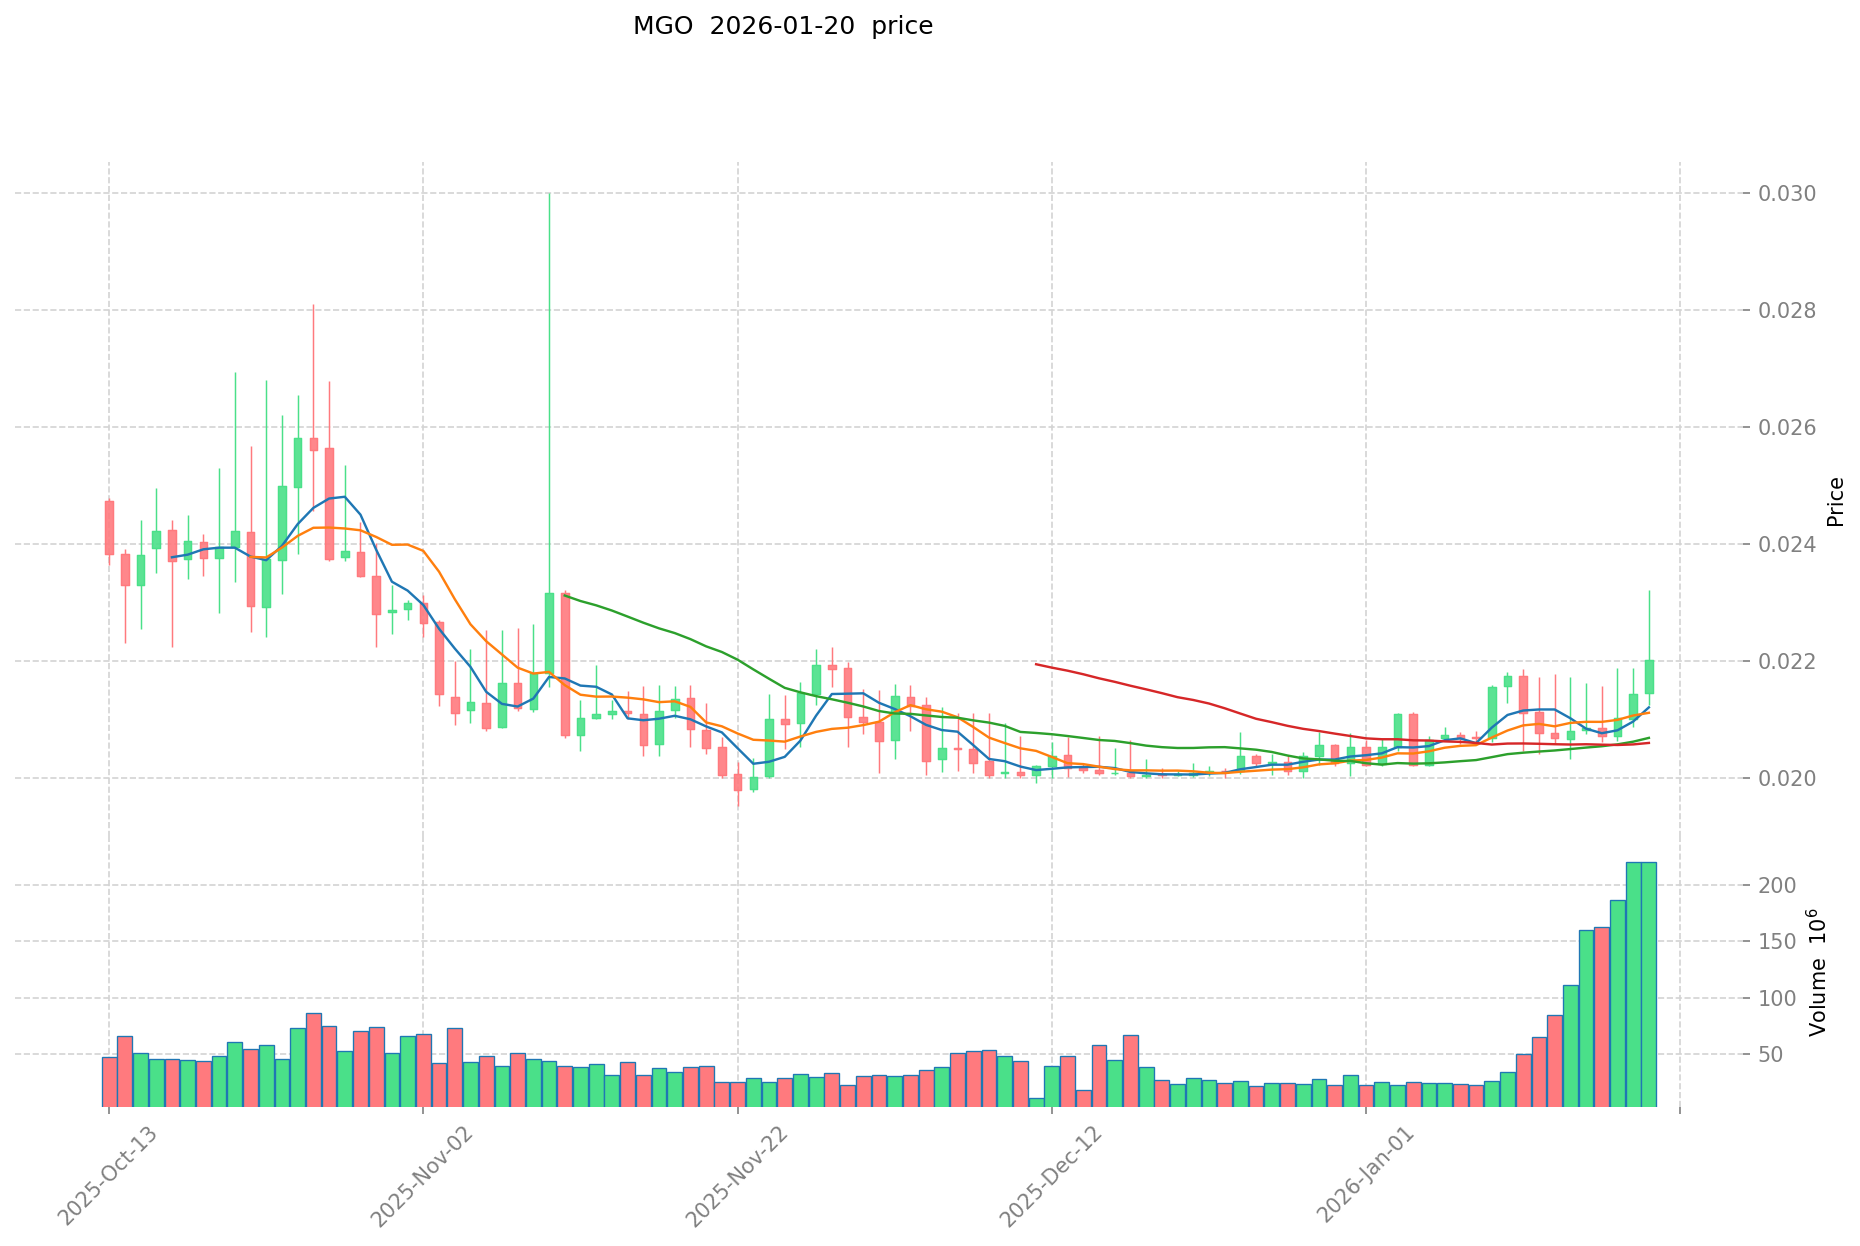
- 2025: Initial launch and market entry → Price fluctuated between $0.005 and $0.08158
- June 2025: Network reached its lowest recorded price point → MGO traded at $0.005
- July 2025: Market activity increased → Price climbed to $0.08158
Current MGO Investment Market Status (January 2026)
- MGO current price: $0.02458
- 24-hour trading volume: $4,963,826.69
- Market capitalization: $39,082,200
- Circulating supply: 1,590,000,000 MGO (15.9% of total supply)
- Fully diluted market cap: $245,800,000
- Market dominance: 0.0075%
Click to view real-time MGO market price
II. Core Factors Affecting Whether MGO is a Good Investment (Is Mango Network(MGO) a Good Investment)
Supply Mechanism and Scarcity (MGO investment scarcity)
- Supply Dynamics → Impact on Price and Investment Value
- MGO has a maximum supply of 10,000,000,000 tokens with a current circulating supply of 1,590,000,000 tokens, representing a circulation ratio of 15.9%. This controlled release mechanism may create scarcity dynamics that could influence price trends over time.
- Investment Significance: The relatively low circulating supply compared to maximum supply suggests potential for supply-side price support as the token ecosystem develops.
Institutional Investment and Mainstream Adoption (Institutional investment in MGO)
- Exchange Presence: MGO is currently listed on 6 exchanges, indicating early-stage market accessibility.
- Infrastructure Positioning: As a Layer 1 multi-virtual machine infrastructure supporting MoveVM, EVM, and SVM, Mango Network aims to address fragmented user experience and liquidity issues in Web3 applications and DeFi protocols, which could attract developer and institutional interest in blockchain interoperability solutions.
Macroeconomic Environment's Impact on MGO Investment
- Monetary Policy and Interest Rate Changes → Alter Investment Attractiveness
- Market conditions and broader cryptocurrency sentiment may influence MGO's investment appeal as part of the emerging Layer 1 blockchain infrastructure segment.
- Geopolitical Uncertainty → May enhance demand for decentralized infrastructure solutions.
Technology and Ecosystem Development (Technology & Ecosystem for MGO investment)
- Multi-VM Architecture: Integration of Move, OPStack, and ZK Rollup technologies creates a framework supporting cross-chain communication and multi-virtual machine interoperability, which may enhance network performance and developer adoption potential.
- Modular Infrastructure: Support for MoveVM, EVM, and SVM provides developers with flexible deployment options across different virtual machine environments, potentially expanding the ecosystem's application scope.
- DeFi, NFT, and payment applications built on Mango Network's infrastructure could contribute to long-term value proposition as the ecosystem matures.
III. MGO Future Investment Predictions and Price Outlook (Is Mango Network (MGO) worth investing in 2026-2031)
Short-term Investment Prediction (2026, short-term MGO investment outlook)
- Conservative Prediction: $0.0199 - $0.0246
- Neutral Prediction: $0.0246 - $0.0295
- Optimistic Prediction: $0.0295 and above
Mid-term Investment Outlook (2027-2029, mid-term Mango Network (MGO) investment forecast)
- Market Stage Expectation: During this period, MGO may continue its growth trajectory, potentially benefiting from broader adoption of its multi-VM omnichain infrastructure and enhanced cross-chain interoperability features.
- Investment Return Prediction:
- 2027: $0.0152 - $0.0336
- 2028: $0.0185 - $0.0367
- 2029: $0.0325 - $0.0449
- Key Catalysts: Expansion of developer ecosystem, integration with additional blockchain networks, and growing demand for multi-virtual machine solutions in Web3 applications and DeFi protocols.
Long-term Investment Outlook (Is MGO a good long-term investment?)
- Base Scenario: $0.0302 - $0.0439 (assuming steady ecosystem development and maintained market presence)
- Optimistic Scenario: $0.0415 - $0.0449 (assuming significant adoption growth and favorable market conditions)
- Risk Scenario: Below $0.0199 (under adverse market conditions or competitive pressures)
For MGO long-term investment and price predictions, visit: Price Prediction
2026-01-20 to 2031 Long-term Outlook
- Base Scenario: $0.0302 - $0.0439 (corresponding to steady progress and gradual mainstream application enhancement)
- Optimistic Scenario: $0.0415 - $0.0449 (corresponding to large-scale adoption and favorable market environment)
- Transformative Scenario: Above $0.0449 (such as breakthrough ecosystem progress and mainstream popularization)
- 2031-12-31 Predicted High: $0.0449 (based on optimistic development assumptions)
Disclaimer: These predictions are based on historical data and market analysis. Cryptocurrency investments carry significant risks, and past performance does not guarantee future results. Investors should conduct their own research and consider their risk tolerance before making investment decisions.
| Year |
Predicted High Price |
Predicted Average Price |
Predicted Low Price |
Price Change |
| 2026 |
0.029532 |
0.02461 |
0.0199341 |
0 |
| 2027 |
0.03356804 |
0.027071 |
0.01515976 |
10 |
| 2028 |
0.0366866192 |
0.03031952 |
0.0184949072 |
23 |
| 2029 |
0.044894113264 |
0.0335030696 |
0.032497977512 |
36 |
| 2030 |
0.04390242240384 |
0.039198591432 |
0.03018291540264 |
59 |
| 2031 |
0.044874547471353 |
0.04155050691792 |
0.035317930880232 |
69 |
IV. MGO Investment Strategy and Risk Management (How to invest in Mango Network)
Investment Strategy (MGO investment strategy)
Long-term Holding (HODL MGO): Suitable for Conservative Investors
Long-term holding strategies focus on MGO's fundamental value as a Layer 1 multi-VM omnichain infrastructure. This approach suits investors who believe in the project's technological innovation, particularly its integration of MoveVM, EVM, and SVM support. Given MGO's relatively early stage (launched in June 2025) and its positioning in addressing fragmented user experience and liquidity issues in Web3 applications, long-term holders may benefit from potential network growth and ecosystem development. However, investors should note the current circulating supply represents only 15.9% of the maximum supply, which may impact long-term price dynamics as more tokens enter circulation.
Active Trading: Technical Analysis and Swing Trading
Active traders may consider MGO's price volatility patterns. Recent data shows a 24-hour price change of 14.41%, with 7-day and 30-day changes of 18.39% and 22.77% respectively, indicating notable short-term price movements. The 24-hour trading range between $0.02128 and $0.0251 provides potential opportunities for swing trading. Traders should monitor the historical price range, with the all-time high at $0.08158 (July 19, 2025) and all-time low at $0.005 (June 24, 2025), to establish technical support and resistance levels. The current trading volume of approximately $4.96 million suggests moderate liquidity for active trading strategies.
Risk Management (Risk management for MGO investment)
Asset Allocation Ratio: Conservative / Aggressive / Professional Investors
-
Conservative Investors: Consider allocating 1-3% of crypto portfolio to MGO, given its early-stage nature and relatively small market capitalization of approximately $39.08 million. This limited exposure allows participation in potential upside while maintaining portfolio stability.
-
Aggressive Investors: May allocate 5-10% of crypto holdings to MGO, accepting higher volatility in exchange for potential returns from a Layer 1 infrastructure project with multi-VM capabilities.
-
Professional Investors: Could implement dynamic allocation strategies, adjusting positions between 3-15% based on technical indicators, network development milestones, and overall market conditions.
Investors should consider portfolio diversification strategies:
- Combine MGO with established Layer 1 projects to balance risk-reward profiles
- Maintain exposure to both infrastructure tokens and application-layer assets
- Consider correlation analysis with broader crypto market movements
- Monitor the project's cross-chain communication capabilities and their impact on value accrual
Secure Storage: Hot and Cold Wallets and Hardware Wallet Recommendations
Given MGO operates as a Layer 1 blockchain with mainnet infrastructure, investors should implement appropriate storage solutions:
- Cold Storage: For long-term holdings, utilize hardware wallets that support custom blockchain networks
- Hot Wallets: For active trading, use secure wallets with two-factor authentication
- Custody Considerations: Verify wallet compatibility with MGO's multi-VM architecture
- Security Practices: Implement backup procedures for private keys and regularly review security protocols
V. MGO Investment Risks and Challenges (Risks of investing in Mango Network)
Market Risk: High Volatility and Price Manipulation
MGO exhibits considerable price volatility, characteristic of newer Layer 1 projects with limited market history. The token has experienced a wide price range since its launch, with movements between its all-time low of $0.005 and all-time high of $0.08158 within a relatively short timeframe. The current market capitalization of approximately $39.08 million and daily trading volume of around $4.96 million indicate moderate liquidity, which may result in increased price sensitivity to large transactions. Investors should recognize that limited circulating supply (15.9% of maximum supply) and concentrated token distribution could contribute to price volatility. The project's ranking at position 614 and market dominance of 0.0075% suggests susceptibility to broader market movements and sector-specific sentiment shifts.
Regulatory Risk: Policy Uncertainty Across Different Countries
As a Layer 1 blockchain infrastructure supporting multiple virtual machines (MoveVM, EVM, SVM), MGO faces regulatory considerations across various jurisdictions. The project's focus on cross-chain communication and multi-VM interoperability may encounter evolving regulatory frameworks governing blockchain interoperability and decentralized infrastructure. Investors should monitor:
- Regulatory developments affecting Layer 1 blockchain platforms
- Compliance requirements for multi-chain infrastructure projects
- Jurisdictional variations in blockchain technology classification
- Potential regulatory impact on cross-chain communication protocols
The absence of specific regulatory clarity for emerging multi-VM architectures introduces uncertainty that may affect project development and token valuation.
Technical Risk: Network Security Vulnerabilities and Upgrade Failures
MGO's technical architecture, integrating Move, OPStack, and ZK Rollup technologies, presents complex engineering challenges:
- Multi-VM Complexity: Supporting MoveVM, EVM, and SVM simultaneously increases potential attack surfaces and requires robust security implementations
- Cross-chain Communication: The project's omnichain infrastructure introduces dependencies on cross-chain bridge security and interoperability protocols
- Network Maturity: As a relatively new mainnet (launched June 2025), the network may encounter unforeseen technical issues during scaling and adoption phases
- Upgrade Coordination: Managing upgrades across multiple virtual machine environments requires careful coordination to avoid compatibility issues
Investors should monitor the project's technical development progress, security audit reports, and network performance metrics to assess ongoing technical risks.
VI. Conclusion: Is Mango Network a Good Investment?
Investment Value Summary
MGO represents a Layer 1 blockchain project addressing fragmented user experience and liquidity challenges in Web3 applications through multi-VM support and omnichain infrastructure. The project's integration of MoveVM, EVM, and SVM provides technical differentiation in the competitive Layer 1 landscape. However, several factors merit consideration:
- The project's early-stage status (launched June 2025) means limited operational history for assessment
- Current market capitalization of approximately $39.08 million and ranking at position 614 indicate developing market presence
- Low circulating supply ratio (15.9%) suggests potential future token releases that may impact price dynamics
- Recent price movements show volatility, with monthly gains of 22.77% but substantial distance from all-time high levels
The investment case for MGO depends on the project's ability to execute its technical roadmap, attract developer activity across its multi-VM platform, and establish meaningful ecosystem partnerships.
Investor Recommendations
✅ Beginners: Consider dollar-cost averaging with small allocations (1-3% of crypto portfolio) and prioritize secure wallet storage. New investors should thoroughly research the project's technical architecture and monitor ecosystem development before establishing positions. Avoid concentration risk and maintain diversified exposure across established and emerging blockchain projects.
✅ Experienced Investors: Implement position sizing based on technical analysis and project milestones. Consider swing trading opportunities around key development announcements while maintaining core long-term holdings. Monitor the fully diluted valuation of $245.8 million relative to circulating market cap to assess potential dilution impact. Evaluate MGO within a broader portfolio context, considering correlation with other Layer 1 projects and overall market conditions.
✅ Institutional Investors: Conduct comprehensive due diligence on technical architecture, team background, and competitive positioning within the multi-VM blockchain sector. Assess the project's strategic partnerships and developer adoption metrics as indicators of long-term viability. Consider staged entry strategies that account for low current circulating supply and potential future token unlocks. Implement appropriate risk management frameworks and custody solutions aligned with institutional standards.
⚠️ Disclaimer: Cryptocurrency investments involve substantial risk, including potential loss of capital. This analysis is for informational purposes only and does not constitute investment advice. Investors should conduct independent research and consult with financial advisors before making investment decisions. Past performance does not guarantee future results, and the high volatility of digital assets requires careful risk assessment aligned with individual financial circumstances and risk tolerance.
VII. FAQ
Q1: What is the current market position of Mango Network (MGO) and how does it compare to other Layer 1 blockchains?
As of January 2026, MGO holds a market capitalization of approximately $39.08 million, ranking at position 614 with a market dominance of 0.0075%. The token maintains a current price of around $0.02458 with a 24-hour trading volume of $4,963,826.69. With a circulating supply of 1.59 billion tokens (15.9% of maximum supply), MGO represents an early-stage Layer 1 project compared to established blockchain platforms. The project's distinguishing feature lies in its multi-virtual machine architecture supporting MoveVM, EVM, and SVM simultaneously, positioning it within the emerging omnichain infrastructure segment rather than competing directly with traditional single-VM Layer 1 platforms.
Q2: How volatile has MGO's price been since launch, and what factors contribute to its price movements?
MGO has demonstrated significant price volatility since its June 2025 launch, with prices ranging from an all-time low of $0.005 to an all-time high of $0.08158 in July 2025. Recent performance shows a 24-hour price change of 14.41%, with 7-day and 30-day gains of 18.39% and 22.77% respectively. This volatility stems from multiple factors including its relatively small market capitalization, limited trading history, low circulating supply ratio (15.9%), and listing on only 6 exchanges. The project's positioning in the competitive Layer 1 infrastructure space, combined with broader cryptocurrency market sentiment, also influences price dynamics.
Q3: What are the key technical features that differentiate Mango Network from other blockchain platforms?
Mango Network's primary technical differentiation lies in its multi-virtual machine omnichain infrastructure that integrates Move, OPStack, and ZK Rollup technologies. The platform simultaneously supports MoveVM, EVM, and SVM, enabling developers to deploy applications across different virtual machine environments within a unified framework. This architecture addresses fragmented user experience and liquidity challenges in Web3 applications and DeFi protocols by facilitating cross-chain communication and interoperability. The modular infrastructure design provides developers with flexible deployment options while aiming to deliver secure, high-performance blockchain solutions.
Q4: What price predictions exist for MGO through 2031, and what assumptions underlie these forecasts?
Price predictions for MGO vary across different timeframes and scenarios. For 2026, conservative estimates range from $0.0199 to $0.0246, neutral predictions from $0.0246 to $0.0295, and optimistic scenarios suggest $0.0295 and above. By 2031, base scenario projections estimate $0.0302 to $0.0439, optimistic scenarios suggest $0.0415 to $0.0449, while transformative scenarios project above $0.0449. These forecasts assume factors including steady ecosystem development, developer adoption growth, enhanced cross-chain interoperability, and favorable market conditions. However, these predictions carry significant uncertainty given MGO's early-stage status, limited operational history, and the inherent unpredictability of cryptocurrency markets.
Q5: What allocation strategies should different investor types consider for MGO?
Conservative investors should consider allocating 1-3% of their crypto portfolio to MGO, given its early-stage nature and relatively small market capitalization. Aggressive investors willing to accept higher volatility may allocate 5-10% of crypto holdings to capture potential returns from the multi-VM infrastructure project. Professional investors could implement dynamic allocation strategies ranging from 3-15% based on technical indicators, network development milestones, and overall market conditions. All investor types should maintain diversified exposure across established and emerging blockchain projects, implement appropriate risk management frameworks, and utilize secure storage solutions compatible with MGO's multi-VM architecture.
Q6: What are the primary risks associated with investing in Mango Network?
MGO investment carries several significant risks. Market risk stems from high price volatility, limited liquidity with a market cap of approximately $39.08 million, and concentrated token distribution with only 15.9% currently circulating. Regulatory risk involves evolving frameworks governing Layer 1 blockchain platforms and multi-chain interoperability protocols across different jurisdictions. Technical risk includes potential security vulnerabilities in the complex multi-VM architecture, cross-chain bridge security dependencies, network maturity challenges as a relatively new mainnet launched in June 2025, and upgrade coordination complexity across multiple virtual machine environments. Investors should conduct thorough due diligence and monitor technical development progress before establishing positions.
Q7: How does MGO's tokenomics structure potentially impact long-term investment value?
MGO's tokenomics feature a maximum supply of 10 billion tokens with a current circulating supply of 1.59 billion tokens, representing a 15.9% circulation ratio. This controlled release mechanism creates potential scarcity dynamics that may influence price trends as the ecosystem develops. However, the low circulating supply ratio suggests substantial future token releases that could impact price dynamics through increased supply. The fully diluted market cap stands at $245.8 million compared to the current circulating market cap of $39.08 million, indicating potential dilution impact as more tokens enter circulation. Investors should monitor token release schedules and assess how future supply increases may affect valuation relative to ecosystem growth and adoption metrics.
Q8: What indicators should investors monitor to assess MGO's ecosystem development and adoption progress?
Investors should track several key indicators to evaluate MGO's progress. Technical development metrics include network performance data, security audit reports, and successful implementation of multi-VM functionality across MoveVM, EVM, and SVM. Ecosystem growth indicators encompass developer activity levels, number and quality of deployed applications across different virtual machines, strategic partnership announcements, and integration with additional blockchain networks. Market metrics to monitor include trading volume trends, exchange listing expansion beyond the current 6 platforms, changes in circulating supply ratio, and correlation with broader Layer 1 sector performance. Regular assessment of these indicators provides insight into the project's execution against its technical roadmap and competitive positioning within the multi-VM blockchain infrastructure segment.
* The information is not intended to be and does not constitute financial advice or any other recommendation of any sort offered or endorsed by Gate.