The article provides a comprehensive analysis of Nibiru Chain (NIBI) as a potential investment opportunity, examining its market performance, price history, and associated risks. Targeting investors, it addresses the uncertainties and volatility within the crypto market. Starting with an introduction to Nibiru Chain's current market position, it then explores historical price trends, economic fundamentals, and investment risks. The article concludes with future investment forecasts and recommendations, guiding readers on strategic approaches to investing in NIBI. Visit Gate for real-time market updates.
Introduction: Nibiru Chain (NIBI) Investment Position and Market Prospects
NIBI is an important asset in the cryptocurrency field. As of December 2025, Nibiru Chain has achieved a market capitalization of $19,755,000 USD, with a circulating supply of approximately 186,694,846 NIBI tokens, and a current price maintained around $0.01317. Positioning itself as a breakthrough L1 blockchain and smart contract ecosystem providing superior throughput and unparalleled security, Nibiru Chain has gradually become a focal point in discussions on whether Nibiru Chain (NIBI) represents a sound investment opportunity. This article will provide a comprehensive analysis of Nibiru Chain's investment value, historical price trends, future price predictions, and investment risks to serve as a reference for investors.
Nibiru Chain (NIBI) Crypto Asset Research Report
I. NIBI Price History Review and Current Investment Value Assessment
Key Price Milestones:
- All-Time High (ATH): $1.032 USD, reached on March 12, 2024
- All-Time Low (ATL): $0.008219 USD, recorded on August 14, 2025
- Current Price (as of December 25, 2025): $0.01317 USD
Year-to-Date Performance:
- 1-Year Change: -76.2% (decline of $0.042166 USD)
- 30-Day Change: -4.58% (decline of $0.000632 USD)
- 7-Day Change: +9.18% (increase of $0.001107 USD)
- 24-Hour Change: +26.1% (increase of $0.002726 USD)
- 1-Hour Change: +3.05% (increase of $0.000390 USD)
The token has experienced significant depreciation from its peak valuation, declining approximately 99.2% from the ATH of $1.032 to the current price level.
Current NIBI Market Status (December 25, 2025)
Price and Market Data:
- Current Price: $0.01317 USD
- Market Capitalization: $2,458,771.12 USD
- Fully Diluted Valuation (FDV): $19,755,000.00 USD
- Market Cap to FDV Ratio: 12.45%
- 24-Hour Trading Volume: $303,443.20 USD
- Market Dominance: 0.00062%
- Market Ranking: #2009
Supply Metrics:
- Circulating Supply: 186,694,846 NIBI
- Total Supply: 1,500,000,000 NIBI
- Maximum Supply: 1,500,000,000 NIBI
- Circulating Supply Ratio: 12.45%
24-Hour Price Range:
- 24-Hour High: $0.016484 USD
- 24-Hour Low: $0.009936 USD
Market Sentiment: Positive (Score: 1)
For real-time NIBI market pricing and updates, visit Gate NIBI Market
II. Project Overview
Project Name: Nibiru Chain
Token Symbol: NIBI
Project Description:
Nibiru Chain is a breakthrough Layer 1 blockchain and smart contract ecosystem designed to provide superior throughput and unparalleled security. The project aims to become the most developer-friendly and user-friendly smart contract platform in Web3.
Official Resources:
III. Token Economics Analysis
Launch Information:
- Publishing Date: March 12, 2024
- Initial Publishing Price: $0.10 USD
Market Capitalization Structure:
- Current Market Cap: $2,458,771.12 USD
- Fully Diluted Valuation: $19,755,000.00 USD
- The significant gap between market cap and FDV reflects that only 12.45% of total tokens are currently in circulation
IV. Risk and Volatility Assessment
Price Volatility Indicators:
- Maximum Historical Drawdown: 99.2% (from ATH of $1.032 to ATL of $0.008219)
- Annual Performance: -76.2%
The token demonstrates substantial volatility with significant price swings, both positive and negative, within short time frames. Recent short-term performance shows recovery, with gains of 26.1% over 24 hours and 9.18% over 7 days, though this follows the severe long-term depreciation.
Disclaimer
This report is based solely on publicly available data as of December 25, 2025. The information provided is for informational purposes only and should not be construed as investment advice or a recommendation to buy, sell, or hold any cryptocurrency. Cryptocurrency markets are highly volatile and speculative. Investors should conduct their own due diligence and consult with qualified financial advisors before making any investment decisions. Past performance does not guarantee future results.
Nibiru Chain (NIBI) Investment Analysis Report
I. Executive Summary
Nibiru Chain (NIBI) is a breakthrough L1 blockchain and smart contract ecosystem designed to provide superior throughput and unparalleled security. As of December 25, 2025, NIBI is trading at $0.01317 with a market capitalization of approximately $2.46 million and a fully diluted valuation of $19.76 million. The token ranks #2009 by market cap, with a 24-hour trading volume of $303,443.
II. Core Factors Influencing NIBI Investment Quality
Supply Mechanism and Token Economics
The NIBI token structure shows the following characteristics:
- Total Supply: 1,500,000,000 NIBI
- Circulating Supply: 186,694,846 NIBI (12.45% of total supply)
- Circulation Ratio: 12.45%
The significant gap between circulating and total supply indicates substantial future dilution potential. This supply-side pressure represents a critical consideration for medium to long-term investment valuations, as token release schedules will directly impact price dynamics and investor returns.
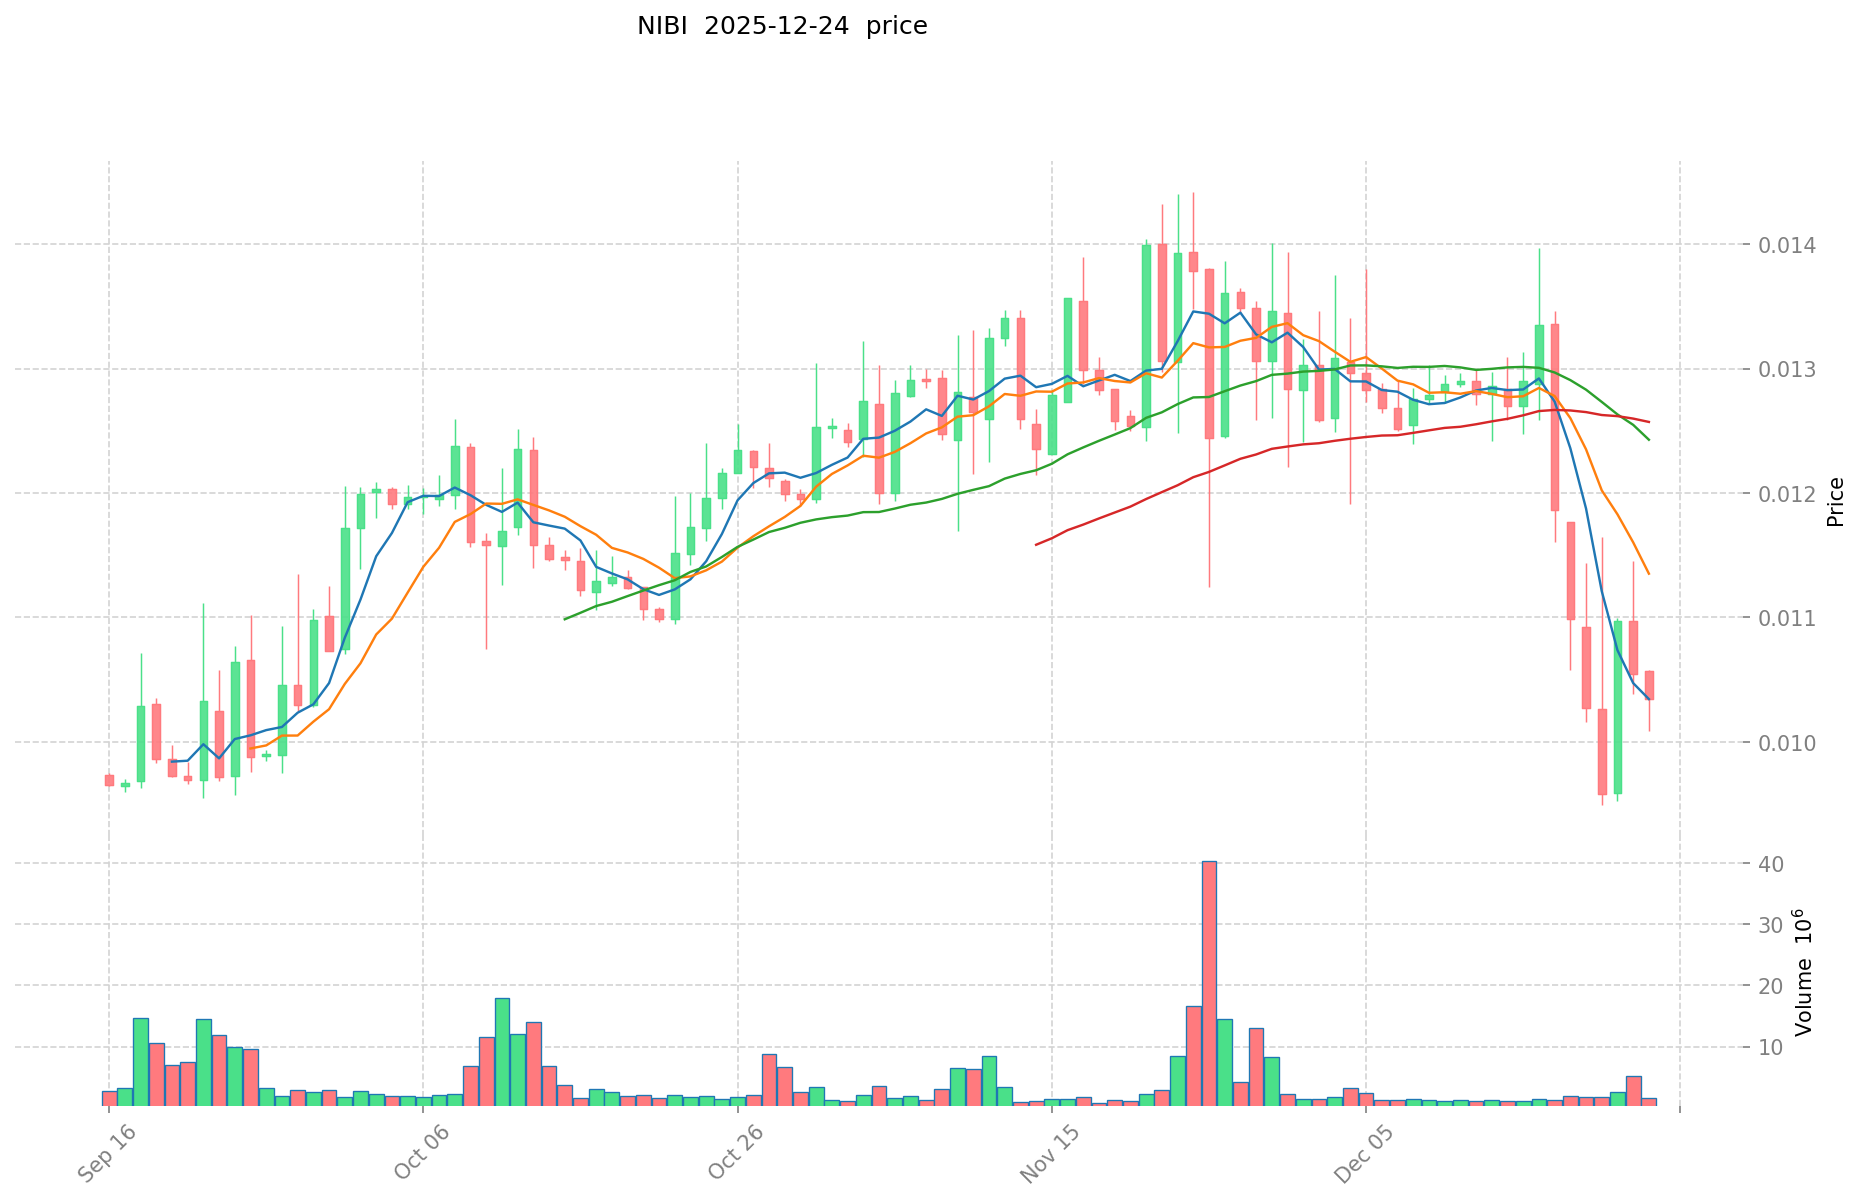
Nibiru Chain's price history reveals substantial volatility:
- All-Time High: $1.032 (March 12, 2024)
- All-Time Low: $0.008219 (August 14, 2025)
- Current Price: $0.01317
- 1-Year Performance: -76.2%
- 30-Day Performance: -4.58%
- 24-Hour Performance: +26.1%
The 76.2% annual decline indicates significant downward pressure since project inception, though recent 24-hour gains suggest temporary bullish sentiment. The token is currently trading 87.5% below its all-time high, reflecting substantial losses for early investors.
Technology and Ecosystem Development
Nibiru Chain positions itself as:
- A developer-friendly smart contract platform
- A blockchain system offering superior throughput capabilities
- A security-focused L1 architecture
The project maintains an active development infrastructure with:
However, the provided reference materials contain no specific information regarding recent protocol upgrades, ecosystem partnerships, DeFi integrations, or adoption metrics that would substantiate technical progress or competitive differentiation.
Market Sentiment and Investment Outlook
Market analysis presents divergent investment perspectives:
Bearish Indicators:
- Multiple analyst sources warn against short-term profitability
- Concerns about associated risks have intensified recently
- High volatility and extended bear market conditions
Mixed Forecasts for 2025:
- Conservative forecast range: $0.0080968 - $0.01396
- Neutral forecast range: $0.01396 - $0.0164728
- Long Forecast projection: $0.011826753 by end of 2025
- CoinCodex: Technical indicators suggest bullish 2025 outlook
- Potential gains: 35.02% if reaching forecast price targets
Price Volatility Context:
- 1-Hour change: +3.05%
- 7-Day change: +9.18%
- 24-Hour trading range: $0.009936 - $0.016484
Macroeconomic and Market Context
The cryptocurrency market environment as of December 2025 encompasses:
- Ongoing volatility in digital asset markets
- Varied institutional interest in blockchain platforms
- Competition among L1 blockchain solutions for developer adoption and ecosystem growth
III. Investment Risk Assessment
Key Risk Factors:
- Dilution Risk: Only 12.45% of total supply is currently circulating, presenting significant future selling pressure
- Performance Risk: 76.2% annual decline demonstrates substantial downside exposure
- Liquidity Risk: Daily trading volume of $303,443 indicates relatively thin liquidity for larger positions
- Market Position Risk: Ranked #2009 by market cap suggests limited mainstream adoption
- Analyst Consensus: Multiple sources advise caution regarding short-term profitability
IV. Conclusion
Nibiru Chain (NIBI) presents a high-volatility, speculative investment profile. While the project's technical vision of providing a developer-friendly, high-throughput L1 blockchain platform has merit, the current market data reveals:
- Substantial price depreciation since launch
- Significant future supply dilution pressure
- Mixed analyst sentiment with predominant caution
- Limited demonstrated ecosystem adoption metrics
- Thin trading liquidity relative to many established cryptocurrencies
Investment decisions in NIBI should consider individual risk tolerance, portfolio diversification requirements, and long-term conviction in the platform's competitive positioning relative to established and emerging L1 blockchain alternatives. The wide variance in price forecasts reflects fundamental uncertainty regarding the project's adoption trajectory and market viability.
Report Date: December 25, 2025
Data Source: Gate Data, Multiple Analyst Forecasts
Disclaimer: This analysis is informational only and does not constitute investment advice.
III. NIBI Future Investment Forecast and Price Outlook (Is Nibiru Chain(NIBI) worth investing in 2025-2030)
Short-term Investment Forecast (2025, short-term NIBI investment outlook)
- Conservative Forecast: $0.01036 - $0.01419
- Neutral Forecast: $0.01419 - $0.01548
- Optimistic Forecast: $0.01548 - $0.01887
Mid-term Investment Outlook (2026-2028, mid-term Nibiru Chain(NIBI) investment forecast)
- Market Stage Expectation: Nibiru Chain enters a development phase with gradual ecosystem expansion and increasing user adoption through 2026-2028, supported by continuous technological improvements and potential market recovery cycles.
- Investment Return Forecast:
- 2026: $0.01157 - $0.02133 (approximately 25% potential growth)
- 2027: $0.01287 - $0.02063 (approximately 43% potential growth)
- 2028: $0.01622 - $0.02077 (approximately 50% potential growth)
- Key Catalysts: Developer ecosystem expansion, platform adoption metrics, blockchain infrastructure upgrades, institutional partnerships, and overall crypto market sentiment recovery.
Long-term Investment Outlook (Is Nibiru Chain a good long-term investment?)
- Base Case: $0.01169 - $0.03001 (assuming steady technological adoption and mainstream blockchain integration)
- Optimistic Case: $0.02291 - $0.04000+ (assuming significant ecosystem expansion and increased DeFi adoption through 2030)
- Risk Scenario: $0.00968 - $0.01200 (under conditions of market downturn, regulatory challenges, or competitive displacement)
View NIBI long-term investment and price forecasts: Price Prediction
2025-12-25 to 2030 Long-term Outlook
- Base Case: $0.01169 - $0.02291 USD (corresponding to steady development with moderate mainstream application growth)
- Optimistic Case: $0.02291 - $0.03001 USD (corresponding to large-scale adoption and favorable market conditions)
- Transformative Case: $0.03001 USD and above (if ecosystem achieves breakthrough progress and mainstream adoption accelerates)
- 2030-12-31 Predicted High: $0.03001 USD (based on optimistic development assumptions)
Disclaimer: This analysis is based on available data and market projections. Cryptocurrency markets are highly volatile and unpredictable. Actual results may differ materially from forecasts. Past performance does not guarantee future results. Investors should conduct thorough research and consider their risk tolerance before making any investment decisions.
| 年份 |
预测最高价 |
预测平均价格 |
预测最低价 |
涨跌幅 |
| 2025 |
0.01887403 |
0.014191 |
0.01035943 |
7 |
| 2026 |
0.02132694435 |
0.016532515 |
0.0115727605 |
25 |
| 2027 |
0.02063340534575 |
0.018929729675 |
0.012872216179 |
43 |
| 2028 |
0.020770645885893 |
0.019781567510375 |
0.016220885358507 |
50 |
| 2029 |
0.025547894439649 |
0.020276106698134 |
0.013787752554731 |
53 |
| 2030 |
0.030014720745248 |
0.022912000568891 |
0.011685120290134 |
73 |
Nibiru Chain (NIBI) Investment Analysis Report
I. Executive Summary
Nibiru Chain is a Layer 1 blockchain and smart contract ecosystem designed to deliver superior throughput and security. As of December 25, 2025, NIBI is trading at $0.01317 with a market capitalization of approximately $2.46 million and a fully diluted valuation of $19.76 million. The token ranks 2009 by market cap, with a circulating supply of 186.69 million out of a total supply of 1.5 billion tokens.
Current Market Metrics
| Metric |
Value |
| Current Price |
$0.01317 |
| 24H Change |
+26.1% |
| 1H Change |
+3.05% |
| 7D Change |
+9.18% |
| 30D Change |
-4.58% |
| 1Y Change |
-76.2% |
| 24H High/Low |
$0.016484 / $0.009936 |
| All-Time High |
$1.032 (March 12, 2024) |
| All-Time Low |
$0.008219 (August 14, 2025) |
| 24H Volume |
$303,443.20 |
| Market Share |
0.00062% |
Price Trend Analysis
NIBI demonstrates significant volatility across multiple timeframes. The token experienced strong short-term momentum with a 26.1% gain over 24 hours and 9.18% over 7 days. However, the 30-day and 1-year perspectives reveal concerning downward pressure, with losses of -4.58% monthly and -76.2% annually. The extreme gap between the all-time high ($1.032) and current price ($0.01317) reflects a 98.7% decline from peak valuation.
Liquidity Considerations
The 24-hour trading volume of $303,443 indicates limited liquidity relative to market capitalization, which may result in higher slippage on larger transactions and increased price volatility.
III. Project Overview & Fundamentals
Project Description
Nibiru Chain is positioned as a breakthrough Layer 1 blockchain infrastructure aimed at becoming the most developer-friendly and user-friendly smart contract platform in Web3. The project emphasizes superior throughput capabilities and enhanced security features compared to existing blockchain solutions.
Supply Dynamics
- Circulating Supply: 186.69 million NIBI (12.45% of total)
- Total Supply: 1.5 billion NIBI
- Maximum Supply: 1.5 billion NIBI
- Current Circulating Ratio: 12.45%
The significant gap between circulating and total supply indicates potential future dilution pressure as remaining tokens enter circulation. Only 12.45% of total tokens are currently in circulation, suggesting substantial inflationary potential ahead.
Network Status
The project operates on mainnet, indicating it has progressed beyond testnet phase to live network deployment.
IV. Investment Strategy & Risk Management
Investment Approaches
Long-Term Holding (HODL NIBI)
- Suitable for conservative investors with extended time horizons
- Dependent on project execution and ecosystem development
- Requires conviction in Layer 1 blockchain competitiveness
Active Trading
- Appropriate for experienced traders with technical analysis capabilities
- Recent 26.1% 24-hour gains indicate volatility suitable for range trading
- High risk due to limited liquidity and market depth
Risk Management Framework
Asset Allocation Guidelines
- Conservative investors: 0-2% of total crypto portfolio
- Aggressive investors: 2-5% of total crypto portfolio
- Professional investors: Risk-proportionate allocation based on institutional thesis
Risk Mitigation Strategies
- Diversified portfolio construction across multiple Layer 1 blockchains
- Position sizing aligned with risk tolerance and portfolio volatility targets
- Dollar-cost averaging to reduce timing risk
Secure Storage Recommendations
- Cold wallet storage for long-term holdings
- Hardware wallet implementation for amounts exceeding $1,000
- Consideration of institutional custody solutions for significant positions
V. Investment Risks & Challenges
Market Risk
- High Volatility: NIBI demonstrates extreme price fluctuations with -76.2% annual decline and -98.7% from all-time high
- Low Liquidity: Reduced trading volume relative to market cap may amplify price movements
- Market Concentration: Limited exchange listing (reported on 1 exchange) restricts accessibility
Regulatory Risk
- Cryptocurrency regulatory frameworks remain uncertain across jurisdictions
- Potential restrictions on blockchain projects in major markets could impact token valuation
- Policy changes regarding Layer 1 blockchain protocols may affect project viability
Technology Risk
- Layer 1 blockchain networks face security vulnerabilities including smart contract exploits and consensus mechanism attacks
- Protocol upgrades carry implementation risks that could disrupt network functionality
- Competition from established Layer 1 platforms (Ethereum, Solana, Cosmos) presents technological and adoption challenges
Ecosystem Risk
- Limited information available regarding developer adoption and ecosystem growth
- Dependence on successful deployment of decentralized applications
- Concentration risk with relatively new project status compared to established Layer 1 alternatives
VI. Conclusion: Is NIBI a Good Investment?
Investment Value Summary
Nibiru Chain presents a speculative Layer 1 blockchain opportunity with uncertain long-term fundamentals. While the project demonstrates innovation objectives in addressing throughput and usability, the 98.7% decline from all-time highs reflects market skepticism regarding its competitive positioning. The 12.45% circulating supply ratio indicates substantial future dilution pressure. Short-term technical momentum exists, but medium to long-term performance has been sharply negative.
Investor Recommendations
✅ Beginner Investors
- Implement systematic dollar-cost averaging over extended periods
- Maintain strict position sizing (< 2% of crypto allocation)
- Utilize hardware wallets for secure token custody
✅ Experienced Investors
- Consider tactical trading opportunities during volatility cycles
- Implement technical analysis-based entry and exit points
- Maintain diversified Layer 1 blockchain exposure
✅ Institutional Investors
- Evaluate project fundamentals and competitive positioning thoroughly
- Conduct comprehensive due diligence on governance and technical roadmap
- Consider strategic allocation only if conviction on ecosystem adoption materializes
Important Disclaimer
⚠️ Critical Notice: Cryptocurrency investments carry substantial risk including potential total capital loss. NIBI's extreme volatility and significant decline from peak valuations indicate high-risk characteristics. This report is provided for informational purposes only and does not constitute investment advice. Conduct independent research and consult qualified financial advisors before making investment decisions.
Report Generated: December 25, 2025
Data Source: Gate Market Data
Disclaimer: This analysis reflects market conditions as of the report date and should not be considered as financial advice or investment recommendations.
Nibiru Chain (NIBI) Frequently Asked Questions
Q1: What is Nibiru Chain (NIBI) and what problem does it solve?
A: Nibiru Chain is a Layer 1 blockchain and smart contract ecosystem designed to provide superior throughput and unparalleled security. The project aims to become the most developer-friendly and user-friendly smart contract platform in Web3, addressing scalability and usability challenges in blockchain technology. As of December 25, 2025, NIBI is trading at $0.01317 with a market capitalization of approximately $2.46 million.
Q2: What are the key supply metrics for NIBI tokens?
A: NIBI has a total supply of 1.5 billion tokens, with only 186.69 million currently circulating (12.45% of total supply). The maximum supply is fixed at 1.5 billion tokens. This significant gap between circulating and total supply indicates substantial future dilution potential as remaining tokens enter circulation over time.
Q3: How has NIBI performed in terms of price history?
A: NIBI reached an all-time high of $1.032 USD on March 12, 2024, and an all-time low of $0.008219 USD on August 14, 2025. As of December 25, 2025, the token trades at $0.01317, representing a 98.7% decline from its peak and a 76.2% annual decrease. However, recent short-term performance shows positive momentum with +26.1% 24-hour gains and +9.18% 7-day gains.
Q4: What is the current market position and liquidity of NIBI?
A: NIBI ranks number 2009 by market capitalization with a market cap of $2.46 million and fully diluted valuation of $19.76 million. The 24-hour trading volume stands at $303,443.20, indicating relatively limited liquidity. This thin liquidity may result in higher slippage for larger transactions and increased price volatility.
III. Investment Prospects and Risks
Q5: What are the main risks associated with investing in NIBI?
A: Key risks include: (1) Supply dilution risk from 87.55% of tokens not yet circulating; (2) Performance risk demonstrated by severe historical price depreciation; (3) Liquidity risk due to thin daily trading volume; (4) Market position risk given its rank 2009 by market cap; (5) Technology and competitive risks in the crowded Layer 1 blockchain space; and (6) Regulatory uncertainty affecting cryptocurrency projects.
Q6: What are the price forecasts for NIBI through 2030?
A: Forecasts vary by timeframe: For 2025, predicted range is $0.01036 - $0.01887. For 2026-2028, projections suggest potential growth of 25-50%, with 2028 estimates of $0.01622 - $0.02077. Long-term 2030 forecasts range from $0.01169 in base case scenarios to $0.03001 in optimistic scenarios, with transformative cases potentially exceeding $0.03001. However, these projections carry substantial uncertainty.
IV. Investment Suitability and Strategy
Q7: Is NIBI suitable for all types of investors?
A: NIBI is primarily suited for experienced and risk-tolerant investors. Conservative investors should limit exposure to 0-2% of total cryptocurrency portfolio allocation. Aggressive investors may consider 2-5% allocation. Due to extreme volatility, high price risk, and limited liquidity, this token is not recommended for risk-averse investors or those with short-term capital needs. Beginning investors should implement dollar-cost averaging strategies with strict position sizing discipline.
Q8: What investment strategies are recommended for NIBI?
A: Two primary approaches exist: (1) Long-term holding (HODL) for investors with extended time horizons who believe in Layer 1 blockchain competitiveness and ecosystem development; and (2) Active trading for experienced technical analysts who can capitalize on volatility cycles. Regardless of strategy, investors should diversify across multiple Layer 1 blockchains, use secure cold wallet storage, and maintain strict risk management discipline. Position sizing should never exceed personal risk tolerance thresholds.
Disclaimer: This FAQ is provided for informational purposes only and does not constitute investment advice. Cryptocurrency markets are highly volatile and carry substantial risk including potential total capital loss. Investors should conduct independent research and consult qualified financial advisors before making any investment decisions. Past performance does not guarantee future results.
* The information is not intended to be and does not constitute financial advice or any other recommendation of any sort offered or endorsed by Gate.