The article provides a detailed analysis of The Graph (GRT) as an investment asset within the Web3 ecosystem. It covers the current market overview, historical price performance, protocol functionality, and tokenomics. This guide addresses key considerations impacting GRT's investment potential, such as market sentiment, utility, adoption metrics, and future price projections. Suitable for investors seeking insights into GRT's role in blockchain data indexing and its potential for long-term growth, the report emphasizes the need for strategic positioning and risk management in volatile cryptocurrency markets.
Introduction: The Graph (GRT) Investment Position and Market Prospects
GRT is an important asset in the cryptocurrency field. As a decentralized protocol for indexing and querying blockchain data on Ethereum, The Graph has established itself as a fundamental infrastructure layer for blockchain data accessibility. As of December 2025, GRT maintains a market capitalization of approximately $409.65 million, with a circulating supply of around 10.63 billion tokens, currently trading at $0.03793. The token serves dual critical functions within its protocol ecosystem: indexer staking for network participation and economic security, as well as curator signaling for subgraph validation and prediction rewards.
I. Market Overview and Current Status
The Graph's native token GRT plays a pivotal role in the protocol's incentive mechanism. Users can pay ETH or DAI for queries, with final settlement occurring in GRT to maintain a unified accounting unit across the network. The protocol's inflation-based monetary policy provides dynamic tools for encouraging specific network behaviors. Currently ranked 144th by market capitalization, GRT is traded on 62 exchanges globally, with an active holder base of 173,437 addresses, demonstrating sustained community engagement despite market headwinds.
II. Historical Price Performance
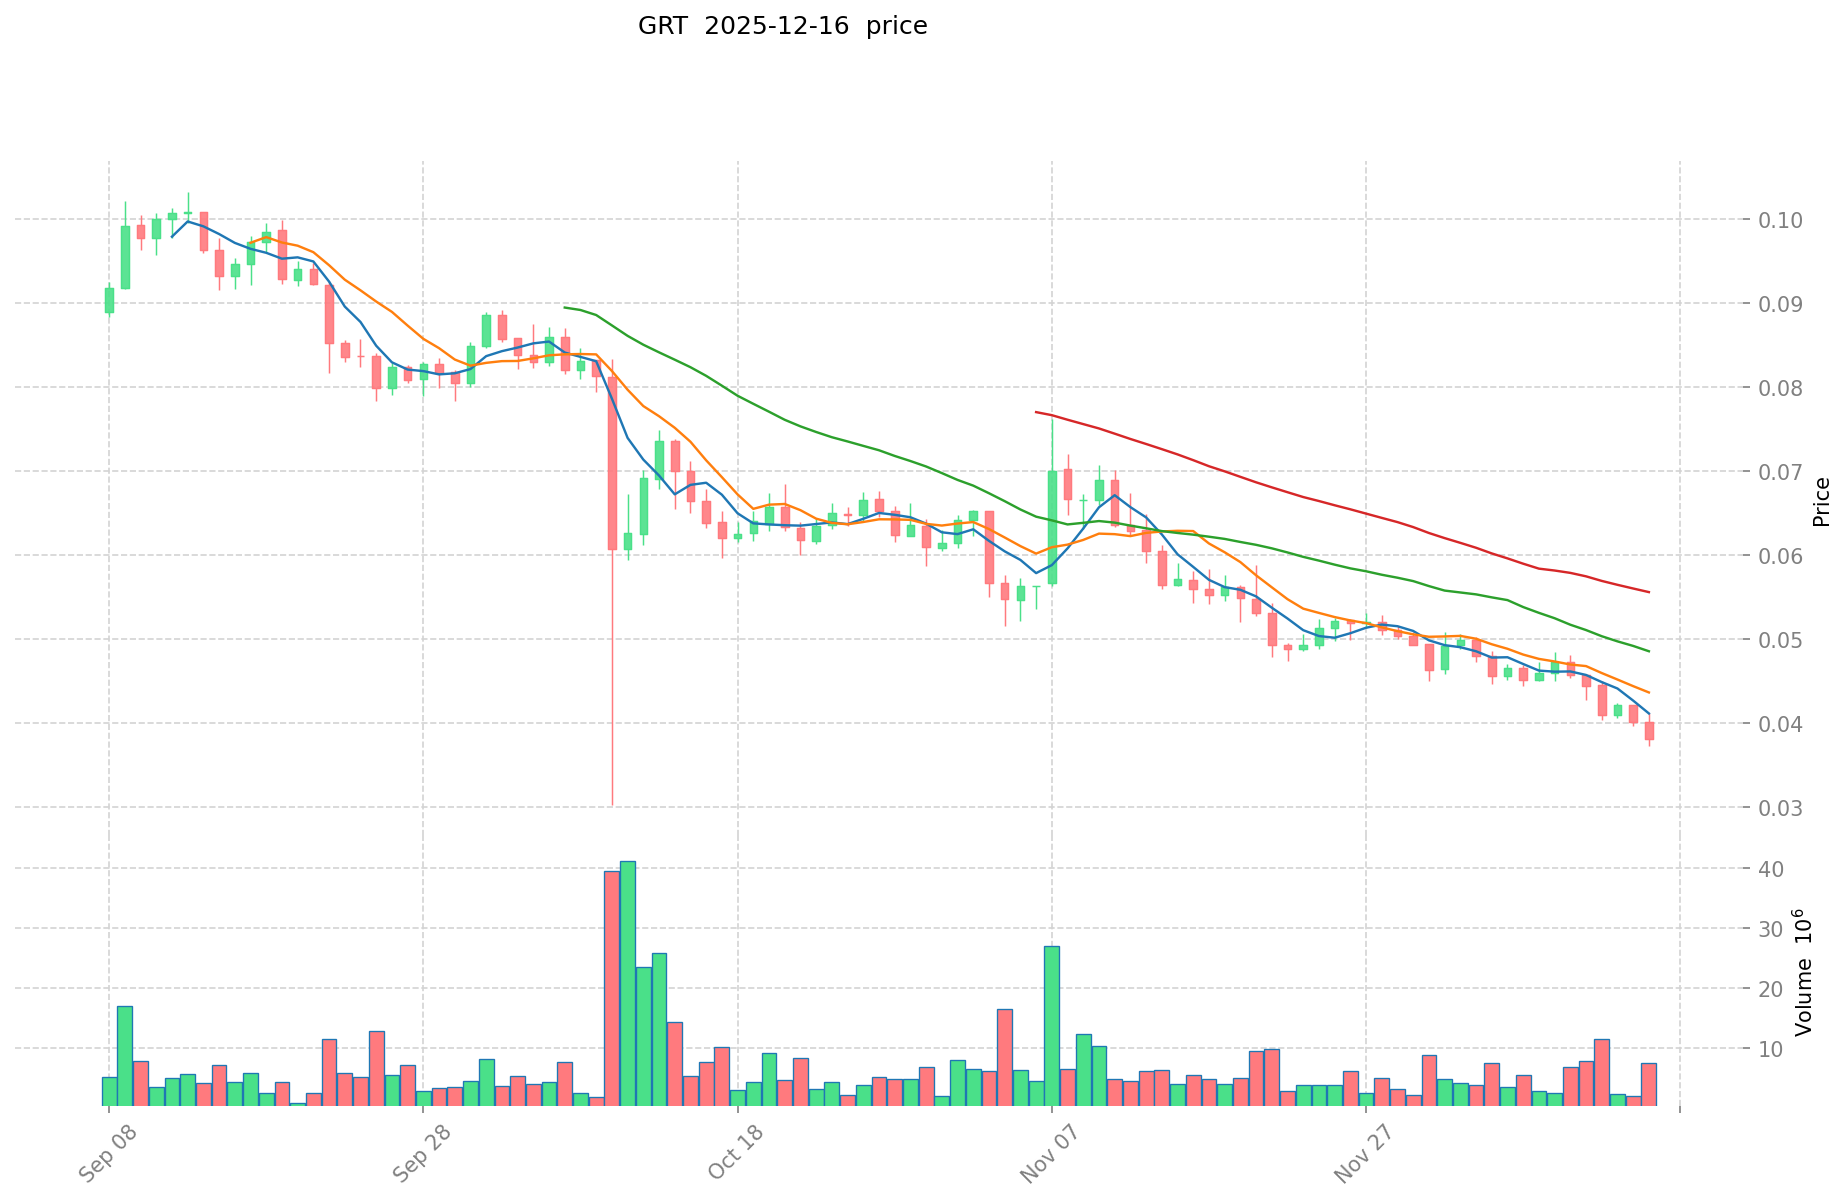
GRT has experienced significant price volatility since its launch in December 2020 at $0.03. The token reached its all-time high of $2.84 on February 12, 2021, reflecting strong initial market enthusiasm. As of December 16, 2025, GRT trades near its all-time low of $0.03741849, representing an 86.8% decline over the past year. This substantial drawdown warrants careful examination of both underlying fundamentals and market dynamics influencing investor sentiment.
III. Protocol Functionality and Token Economics
The Graph operates through a permissionless system where participants can build and publish open APIs (subgraphs) to facilitate data access. The token's economic model incorporates staking mechanisms for indexers seeking query market discovery, while curators stake tokens to signal subgraph value and receive rewards for accurate predictions. This two-sided marketplace design creates inherent utility demand, though market adoption and network effects remain critical variables.
IV. Investment Considerations
This comprehensive analysis examines GRT's investment fundamentals, historical performance trends, future price projections, and associated risk factors to provide a factual framework for investment decision-making. The intersection of protocol development, market sentiment, and macroeconomic conditions collectively influence GRT's market dynamics and merit detailed scrutiny.
The Graph (GRT) Crypto Asset Research Report
I. Price History Review and Current Investment Status of GRT
All-Time High (ATH):
- ATH: $2.84, achieved on February 12, 2021
- Current price relative to ATH: Down 86.63% from peak
All-Time Low (ATL):
- ATL: $0.03741849, reached on December 16, 2025
- Current price relative to ATL: Up 1.38% from bottom
Price Decline Over Time:
- 1-Year Performance: -86.8% (from approximately $0.2872 to $0.03793)
- 30-Day Performance: -33.90%
- 7-Day Performance: -16.43%
- 24-Hour Performance: -6.98%
Current GRT Market Status (December 16, 2025)
Current Price Metrics:
- Current Price: $0.03793
- 24-Hour High: $0.04111
- 24-Hour Low: $0.03722
- Market Capitalization: $409,653,968.61
- Fully Diluted Valuation (FDV): $409,653,968.61
- Circulating Supply: 10,628,477,124.80 GRT
- Total Supply: 10,800,262,816.05 GRT
- Market Cap to FDV Ratio: 98.41%
Trading Activity:
- 24-Hour Trading Volume: $299,143.21
- Market Dominance: 0.013%
- Number of Exchanges: 62
- Total Holders: 173,437
Recent Price Trends:
- 1-Hour Change: -0.38%
- 24-Hour Change: -6.98%
- 7-Day Change: -16.43%
- 30-Day Change: -33.90%
- 1-Year Change: -86.8%
For real-time GRT market prices, visit: https://www.gate.com/price/the-graph-grt
II. Protocol Overview and Tokenomics
Protocol Architecture
The Graph is a decentralized protocol designed for indexing and querying blockchain data on Ethereum. It enables data accessibility through a permissionless framework where participants can build and publish open APIs called subgraphs.
Core Functionality:
- Allows anyone to construct and publish open APIs (subgraphs) to make blockchain data easily accessible
- Simplifies complex data queries from blockchain networks
- Transforms and organizes subgraph data for distribution across decentralized applications (dApps)
GRT Token Utility and Economic Model
Primary Token Functions:
I. Indexer Staking
- Indexers stake GRT tokens to become discoverable in the query marketplace
- Staking provides economic security during work execution
- Enables participation in the protocol's incentive system
II. Curator Signal
- Curators stake GRT tokens in the curation market
- Signal indicates which subgraphs hold value for the network
- Curators receive rewards for accurate predictions
Payment and Settlement Mechanism:
- Users can pay in ETH or DAI for queries
- Final settlement occurs in GRT to maintain a unified accounting unit across the protocol
Monetary Policy:
- Native token holdings incentivize specific behaviors through inflation mechanisms
- Dynamic adjustment of inflation policies serves as a powerful tool for protocol governance
Network Economics
Staking Metrics (Based on Available Data):
- Total staked GRT from indexers and delegators: 2.7 billion GRT
- Value of staked tokens at current price: approximately $102.4 million
- Indexing rewards from mainnet emission: 350 million GRT (valued at approximately $13.3 million)
- Annual yield (denominated in GRT): approximately 10%
III. Contract Addresses and Blockchain Integration
Multi-Chain Deployment
IV. Project Resources and Community
Official Website: https://thegraph.com/
Social Media & Community:
Key Repositories:
Report Date: December 16, 2025
Disclaimer: This report is for informational purposes only and does not constitute investment advice. Cryptocurrency markets are highly volatile and subject to significant price fluctuations. Readers should conduct their own research and consult with qualified financial advisors before making investment decisions.
The Graph (GRT) Investment Analysis Report
Report Date: December 16, 2025
I. Executive Summary
The Graph (GRT) is a decentralized protocol designed for indexing and querying blockchain data on Ethereum. As of the report date, GRT is trading at $0.03793, representing a significant decline from its all-time high of $2.84 reached on February 12, 2021. The token currently ranks 144th by market capitalization with a total market cap of approximately $409.65 million. This report examines the key factors influencing GRT's investment profile based on current market data and available information.
II. Core Factors Influencing Whether The Graph (GRT) Is a Good Investment
A. Token Utility & Protocol Functions
The Graph token serves critical functions within the protocol:
- Indexer Staking: Indexers stake GRT tokens to gain discovery in the query market and provide economic security during work execution.
- Curator Signaling: Curators stake GRT tokens in the curator market to predict which subgraphs provide value to the network, earning rewards for accurate predictions.
- Settlement Mechanism: While users can pay in ETH or DAI for queries, final settlement occurs in GRT to maintain a unified accounting unit across the protocol.
- Monetary Policy Tool: The protocol uses dynamic inflation adjustment to incentivize specific behaviors within the ecosystem.
B. Supply Mechanics & Scarcity Considerations
Current Supply Metrics:
- Circulating Supply: 10,628,477,124.80 GRT
- Total Supply: 10,800,262,816.05 GRT
- Maximum Supply: 10,800,262,823.32 GRT
- Circulation Ratio: 98.41%
The token exhibits high circulation relative to total supply, with approximately 98% of the maximum supply already in circulation. This high circulation ratio may limit scarcity-driven price appreciation.
Recent Price Trends:
- 1-hour change: -0.38%
- 24-hour change: -6.98%
- 7-day change: -16.43%
- 30-day change: -33.90%
- 1-year change: -86.8%
Historical Price Context:
- All-Time High: $2.84 (February 12, 2021)
- All-Time Low: $0.03741849 (December 16, 2025)
- Launch Price: $0.03 (December 18, 2020)
- 2024 Price: $0.172 (February 11, 2024)
The token has experienced sustained downward pressure, currently trading near its all-time low established on the report date itself, indicating severe bearish market conditions.
D. Market Structure & Adoption Indicators
Market Position:
- Trading on 62 exchanges
- 173,437 token holders
- 24-hour trading volume: $299,143.21
- Market dominance: 0.013%
The relatively modest trading volume and market dominance suggest limited liquidity and market attention compared to larger cryptocurrencies.
E. Ecosystem & Development Factors
The protocol demonstrates developer-oriented infrastructure:
- Multiple GitHub repositories including graph-node, graph-ts, and graph-cli
- Active community engagement through Twitter, Reddit, and official channels
- Website and continuous protocol development
III. Market Analysis & Sentiment
The available research indicates mixed market perspectives regarding GRT as an investment:
Bullish Factors Cited:
- Strong developer adoption and growing support across blockchain networks
- Clear defined token roles within the protocol
- Active revenue system tied to measurable network activity
- Decentralized structure providing network flexibility
- Potential blockchain integrations could drive future utility
Bearish Factors Cited:
- Continuous downward price trend since launch
- Slow price momentum despite protocol development
- High long-term uncertainty
- Current technical forecasts indicate bearish sentiment for 2025
- Dependence on mainstream DeFi adoption for significant appreciation
IV. Key Metrics Summary
| Metric |
Value |
| Current Price |
$0.03793 |
| Market Cap |
$409.65 million |
| 24h Volume |
$299,143.21 |
| All-Time High |
$2.84 |
| Holders |
173,437 |
| Exchange Listings |
62 |
| Circulation Ratio |
98.41% |
V. Disclaimers
This report is provided for informational purposes only and does not constitute investment advice. The analysis is based on market data current as of December 16, 2025, and historical information. Cryptocurrency markets are volatile and speculative. Past performance does not guarantee future results. Investors should conduct their own research and consult with qualified financial advisors before making investment decisions.
III. GRT Future Investment Predictions and Price Outlook
Short-term Investment Prediction (2025, short-term GRT investment outlook)
- Conservative forecast: $0.0277 - $0.0380
- Neutral forecast: $0.0380 - $0.0450
- Optimistic forecast: $0.0450 - $0.0501
Mid-term Investment Outlook (2026-2027, mid-term The Graph(GRT) investment forecast)
-
Expected market phase: GRT is transitioning from bear market consolidation toward potential recovery as Web3 infrastructure gains adoption. The protocol continues to strengthen its position as a decentralized data indexing solution.
-
Investment return predictions:
- 2026: $0.0246 - $0.0484
- 2027: $0.0430 - $0.0481
-
Key catalysts: Increased decentralized application development on Ethereum, expansion of The Graph's indexing capabilities across multiple blockchain networks, growing recognition of reliable data querying infrastructure, enterprise adoption of blockchain solutions, and sustained institutional interest in Web3 infrastructure projects.
Long-term Investment Outlook (Is The Graph a good long-term investment?)
-
Base case scenario: $0.0294 - $0.0819 by 2030 (assuming steady protocol adoption, consistent decentralized application growth, and stable market conditions)
-
Optimistic scenario: $0.1500 - $0.3000 by 2030 (assuming accelerated Web3 mainstream adoption, breakthrough ecosystem developments, and favorable macroeconomic environment)
-
Risk scenario: $0.0150 - $0.0300 by 2030 (assuming regulatory headwinds, competitive threats from alternative indexing solutions, or significant market contraction)
Click to view GRT long-term investment and price predictions: Price Prediction
2025-12-16 to 2030 Long-term Outlook
-
Base case: $0.0294 - $0.0819 USD (corresponding to steady protocol maturation and mainstream application integration)
-
Optimistic case: $0.1200 - $0.3000 USD (corresponding to massive Web3 adoption and favorable market conditions)
-
Transformative case: $0.5000 USD and above (reflecting breakthrough ecosystem achievements and widespread mainstream adoption)
-
2030-12-31 predicted high: $0.3000 USD (based on optimistic development assumptions)
Disclaimer: Price predictions are based on historical data, market analysis, and industry forecasts and should not be construed as investment advice or financial recommendations. Cryptocurrency markets are highly volatile and unpredictable. All predictions carry substantial risk. Past performance does not guarantee future results. Investors should conduct their own research and consult with qualified financial advisors before making investment decisions.
| 年份 |
预测最高价 |
预测平均价格 |
预测最低价 |
涨跌幅 |
| 2025 |
0.0500808 |
0.03794 |
0.0276962 |
0 |
| 2026 |
0.04841144 |
0.0440104 |
0.024645824 |
16 |
| 2027 |
0.0480593568 |
0.04621092 |
0.0429761556 |
21 |
| 2028 |
0.052791355008 |
0.0471351384 |
0.02592432612 |
24 |
| 2029 |
0.06545185318224 |
0.049963246704 |
0.0449669220336 |
31 |
| 2030 |
0.08194472091923 |
0.05770754994312 |
0.029430850470991 |
52 |
The Graph (GRT) Investment Analysis Report
I. Executive Summary
The Graph is a decentralized protocol for indexing and querying blockchain data on Ethereum. As of December 16, 2025, GRT is ranked 144th in market capitalization with a price of $0.03793, representing a significant decline from its all-time high of $2.84 (February 12, 2021). The token serves critical functions within its protocol ecosystem through indexer staking and curator signaling mechanisms.
Key Metrics:
- Current Price: $0.03793
- 24H Change: -6.98%
- Market Cap: $403.14M
- Circulating Supply: 10.63B GRT (98.41% of total supply)
- All-Time High: $2.84 | All-Time Low: $0.03742
II. Protocol Overview & Use Cases
Core Functionality
The Graph operates as a decentralized indexing solution for blockchain data, enabling simplified data queries on Ethereum. The protocol allows any participant to build and publish open APIs (subgraphs) that make blockchain data easily accessible.
Token Utility
GRT serves two primary functions within the protocol:
1. Indexer Staking
- Indexers stake GRT tokens to gain visibility in the query marketplace
- Provides economic security during query execution
- Enables indexers to participate in network validation
2. Curator Signaling
- Curators stake GRT into the curation market to signal which subgraphs hold value for the network
- Participants receive rewards for accurate predictions
- Creates market-driven incentive structure for high-quality data indexing
Settlement Mechanism
Users can pay with ETH or DAI for queries; however, final settlement occurs in GRT to maintain a unified accounting unit across the protocol. Native token holdings enable dynamic inflation policy adjustment to incentivize specific behaviors.
Price Dynamics
| Timeframe |
Change |
Absolute Change |
| 1 Hour |
-0.38% |
-$0.000145 |
| 24 Hours |
-6.98% |
-$0.00285 |
| 7 Days |
-16.43% |
-$0.00746 |
| 30 Days |
-33.90% |
-$0.01945 |
| 1 Year |
-86.8% |
-$0.24942 |
Market Position
- Market Capitalization: $403.14M (fully diluted: $409.65M)
- 24H Volume: $299,143.21
- Market Dominance: 0.013%
- Listed on 62 exchanges
- Total Holders: 173,437
Price Range (24H)
- High: $0.04111
- Low: $0.03722
IV. Investment Strategy & Risk Management
Investment Methodologies
Long-Term Hold (HODL Strategy)
Suitable for investors with conviction in The Graph's protocol utility and long-term data infrastructure role. This approach requires weathering significant volatility and maintaining positions through market cycles.
Active Trading
For experienced traders utilizing technical analysis and range-bound trading strategies. The elevated volatility presents opportunities for tactical positioning but demands disciplined execution and risk controls.
Risk Management Framework
Asset Allocation Recommendations
- Conservative Investors: 1-3% of digital asset allocation
- Aggressive Investors: 5-10% of digital asset portfolio
- Institutional Investors: Strategic allocation based on infrastructure thesis
Risk Mitigation Strategies
- Multi-asset portfolio diversification to reduce protocol-specific risk
- Hedging through stablecoin positions during high volatility periods
- Correlation analysis with broader crypto market movements
Secure Storage Options
- Hot Wallets: MetaMask, Trust wallet for active trading (minimal holdings)
- Cold Storage: Hardware wallets (Ledger, Trezor) for long-term positions
- Custody Solutions: Institutional-grade custody for significant holdings
V. Investment Risks & Challenges
Market Risk
- Extreme Volatility: 86.8% 1-year decline demonstrates significant price exposure
- Liquidity Constraints: Relatively modest 24-hour volume relative to market cap suggests execution risk for large orders
- Market Depth: Trading across 62 exchanges may fragment liquidity
Regulatory Risk
- Jurisdiction Uncertainty: Evolving regulatory treatment of indexing protocols across different jurisdictions
- Securities Classification: Potential reclassification of staking mechanics under securities laws
- Compliance Requirements: Curators and indexers operating within evolving regulatory frameworks
Technical Risk
- Smart Contract Vulnerability: Protocol dependencies on Ethereum security and contract code correctness
- Network Adoption: Subgraph quality and adoption directly impact protocol value
- Upgrade Execution: Protocol changes require coordination across distributed stakeholder base
Project Risk
- Competition: Alternative data indexing solutions (Chainlink VRF, The Defiant, others) competing for use cases
- Founder/Team Dependence: Core development team performance crucial for protocol evolution
VI. Conclusion: Is The Graph a Good Investment?
Investment Value Summary
The Graph addresses a fundamental infrastructure need within decentralized applications—efficient blockchain data indexing and querying. The protocol's dual tokenomics (staking and curation) create legitimate utility mechanisms rather than speculative mechanics. However, the token's 86.8% annual decline reflects market skepticism regarding near-term growth catalysts and protocol traction.
The project demonstrates legitimate technical merit and ongoing development, but faces competition and uncertain adoption curves. Current valuations reflect depressed market sentiment.
Investor Recommendations
✅ Beginner Investors:
- Dollar-cost averaging approach to reduce timing risk
- Secure storage in hardware wallets
- Position sizing of 1-2% of crypto allocation maximum
- Focus on understanding protocol mechanics before investing
✅ Experienced Investors:
- Range-trading strategies leveraging 16-33% monthly volatility
- Portfolio diversification across 5-10 projects minimum
- Active monitoring of protocol adoption metrics and developer activity
- Tactical accumulation during severe drawdowns with predetermined targets
✅ Institutional Investors:
- Long-term infrastructure positioning aligned with blockchain data economy growth
- Engagement with protocol governance and community development
- Correlation analysis with broader infrastructure token exposure
⚠️ Important Disclaimer: Cryptocurrency investments carry substantial risk, including potential total loss of capital. This analysis is provided for informational purposes only and does not constitute investment advice, financial recommendations, or solicitation to buy or sell. Conduct independent research and consult qualified financial advisors before making investment decisions. Past performance does not guarantee future results. Market conditions and regulatory environments remain highly uncertain.
The Graph (GRT) Frequently Asked Questions
FAQ
Q1: What is The Graph (GRT) and what problem does it solve?
Answer: The Graph is a decentralized protocol designed for indexing and querying blockchain data on Ethereum. It solves the fundamental infrastructure challenge of making blockchain data easily accessible and queryable. Rather than requiring developers to build custom data infrastructure, The Graph enables participants to create and publish open APIs called subgraphs that transform complex blockchain data into user-friendly formats for decentralized applications (dApps).
Q2: What are the primary use cases for GRT tokens?
Answer: GRT tokens serve two critical functions within the protocol ecosystem. First, Indexers stake GRT tokens to gain visibility in the query marketplace and provide economic security during query execution. Second, Curators stake GRT tokens in the curation market to signal which subgraphs provide value to the network, earning rewards for accurate predictions. Additionally, GRT serves as the settlement currency for query transactions, maintaining a unified accounting unit across the protocol.
Q3: Why has GRT experienced such a significant price decline?
Answer: GRT has declined 86.8% over the past year, currently trading near its all-time low of $0.03742. This decline reflects several factors: severe bearish market sentiment across cryptocurrency markets, modest 24-hour trading volume ($299,143) indicating limited market liquidity, relatively low market dominance (0.013%), and market skepticism regarding near-term protocol adoption catalysts. Additionally, the token's high circulation ratio (98.41% of maximum supply already in circulation) may limit scarcity-driven price appreciation.
Q4: What is the price outlook for GRT in 2025-2030?
Answer: Price predictions vary by scenario. Conservative 2025 forecasts range from $0.0277 to $0.0501. For 2026-2027, base case predictions range from $0.0246 to $0.0484. Long-term 2030 outlooks include: Base case ($0.0294-$0.0819) assuming steady protocol adoption; Optimistic case ($0.1200-$0.3000) assuming massive Web3 adoption; and Transformative case ($0.5000+) reflecting breakthrough ecosystem achievements. However, these predictions carry substantial uncertainty and should not be treated as investment advice.
Q5: What are the main risks associated with investing in GRT?
Answer: Key risks include extreme price volatility (demonstrated by 86.8% annual decline), liquidity constraints from modest trading volumes, regulatory uncertainty surrounding indexing protocols and staking mechanics, technical risks from smart contract vulnerabilities, competitive threats from alternative data indexing solutions, and dependence on decentralized application ecosystem adoption. Additionally, the protocol's success depends on the core development team's execution and coordination across a distributed stakeholder base.
Q6: How should different investor types approach GRT investment?
Answer: Beginner investors should employ dollar-cost averaging strategies with position sizing of 1-2% of crypto allocation, utilizing secure hardware wallet storage. Experienced investors can implement range-trading strategies leveraging the token's monthly volatility while maintaining diversification across 5-10 projects minimum. Institutional investors should consider long-term infrastructure positioning aligned with blockchain data economy growth, with active protocol governance engagement. All investors should size positions based on risk tolerance and avoid over-concentration.
Q7: What market metrics indicate the health of The Graph protocol?
Answer: Critical metrics include the total staked GRT from indexers and delegators (2.7 billion GRT, approximately $102.4 million value), annual staking yield in GRT (approximately 10%), the number of active token holders (173,437), and exchange listing breadth (62 exchanges). These indicators suggest sustained community engagement despite market headwinds. However, modest 24-hour trading volume ($299,143) and low market dominance (0.013%) indicate limited current market attention relative to the token's market capitalization.
Q8: Is The Graph a suitable long-term investment?
Answer: The Graph addresses a legitimate infrastructure need in decentralized finance with demonstrated protocol utility and ongoing development. However, suitability depends on individual investment objectives and risk tolerance. The 86.8% annual price decline reflects significant market skepticism. Long-term investors should emphasize the protocol's technical merit and adoption trajectory rather than short-term price movements. Conservative position sizing (1-3% of digital asset allocation) is recommended, with recognition that cryptocurrency investments carry substantial risk including potential total capital loss.
* The information is not intended to be and does not constitute financial advice or any other recommendation of any sort offered or endorsed by Gate.


