This comprehensive guide examines whether The Graph (GRT) presents a viable investment opportunity in the blockchain infrastructure sector. The article analyzes GRT's market position, current trading at $0.04292 with $458.15 million market capitalization as of January 2026, alongside its historical price movements from $2.84 peak in 2021 to recent lows. The analysis explores core investment factors including tokenomics with 98.84% circulating supply, protocol utility for decentralized data indexing, and ecosystem adoption across Ethereum and Arbitrum networks. Short to long-term price scenarios range from $0.0351 to potentially $0.0837 by 2031 under various market conditions. The guide provides differentiated investment strategies for beginners, experienced traders, and institutional investors, emphasizing risk management through portfolio allocation of 1-15% based on risk tolerance. Critical considerations include high volatility evidenced by 77.77% annual decline, regulatory uncertainties, smart contract ri
Introduction: The Graph (GRT)'s Investment Position and Market Outlook
GRT is a notable asset in the cryptocurrency sector. Since its launch in December 2020, it has established a presence in the decentralized blockchain data indexing and querying domain. As of January 2026, The Graph holds a market capitalization of approximately $458.15 million, with a circulating supply of around 10.67 billion tokens, and the current price is maintained near $0.04292. Positioned as a decentralized protocol for blockchain data infrastructure, GRT has drawn attention from participants examining "Is The Graph (GRT) a good investment?" This article presents an analysis of GRT's investment characteristics, historical price movements, future price outlook, and associated risks for reference purposes.
I. The Graph (GRT) Price History Review and Investment Value Status
-
2021: The Graph launched its mainnet in December 2020, with GRT reaching a notable level of $2.84 in February 2021 during the broader crypto market rally. Early participants who acquired tokens near the initial price of $0.03 experienced substantial gains during this period.
-
2022-2023: Following the 2021 peak, GRT entered a prolonged correction phase alongside the broader crypto market downturn. The token declined from elevated levels toward sub-$0.10 ranges by late 2022, reflecting reduced risk appetite and decreased activity in DeFi protocols that rely on The Graph's indexing services.
-
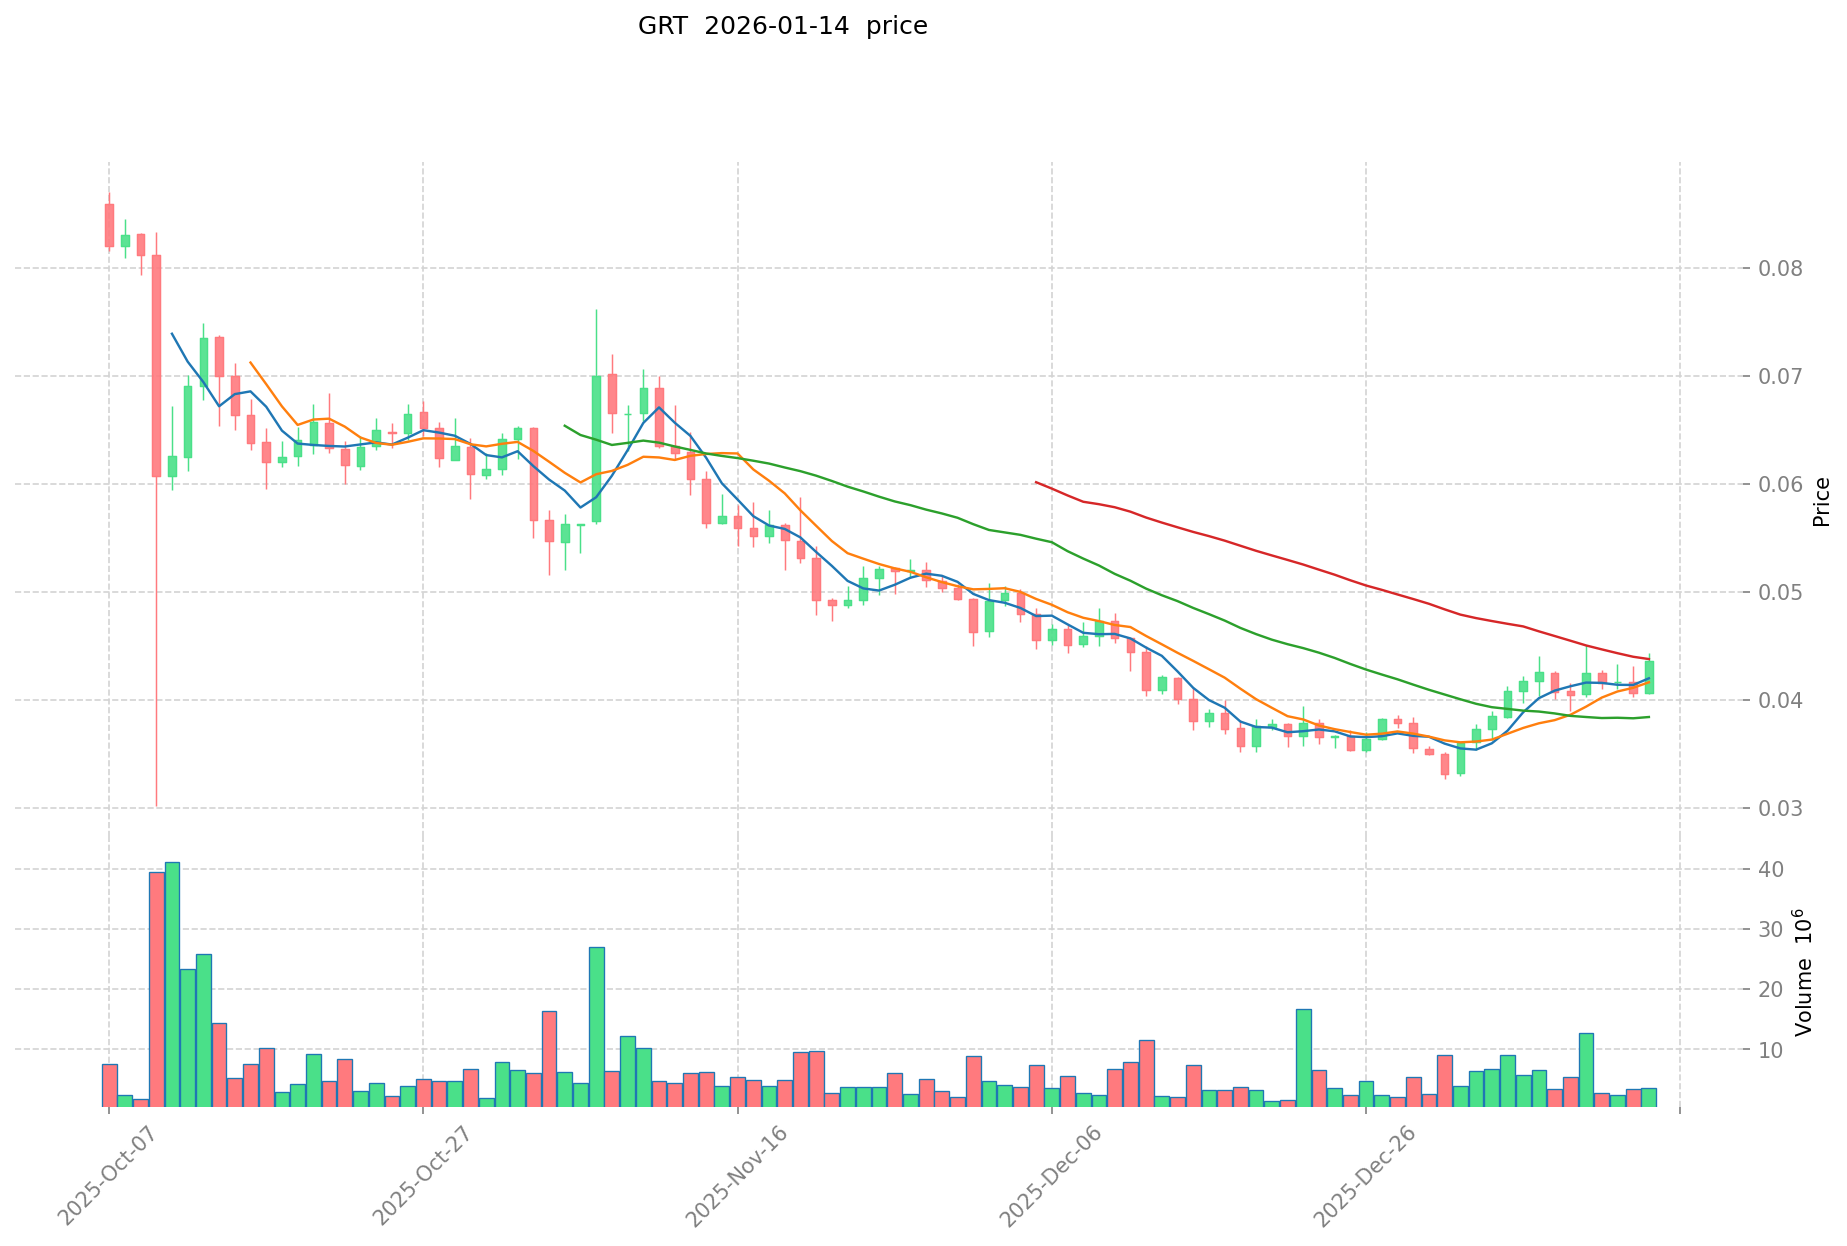
2024-2025: GRT has shown gradual recovery, with the token trading around $0.042-$0.043 as of January 2025. The 30-day performance indicates a 13.07% increase, while the 7-day change stands at 5.18%, suggesting renewed interest in blockchain data infrastructure projects.
Current GRT Investment Market Status (January 2025)
- Current GRT Price: $0.04292 (as of January 15, 2026)
- 24-Hour Price Change: -0.23%
- 24-Hour Trading Volume: Approximately $270.08 million USD
- Market Capitalization: $458.15 million USD
- Circulating Supply: 10.67 billion GRT (approximately 98.84% of total supply)
- Market Dominance: 0.013% of total crypto market
Click to view real-time GRT market price
The Graph remains positioned as a core infrastructure component for blockchain data indexing, with its token primarily utilized by indexers, curators, and delegators within the protocol ecosystem. As of January 2025, GRT is listed on 64 exchanges and maintains a holder base of approximately 173,059 addresses. The token's utility centers on staking for query services and network participation, with rewards distributed proportionally to contribution levels and staked amounts.
II. Core Factors Influencing Whether GRT is a Good Investment
Supply Mechanism and Scarcity (GRT Investment Scarcity)
- Token supply dynamics → Impact on price and investment value
- Historical pattern: The Graph's circulating supply represents approximately 98.84% of maximum supply (10.67 billion out of 10.80 billion tokens), indicating near-complete token circulation
- Investment significance: With max supply at 10.80 billion tokens and minimal remaining inflation potential, the supply-side pressure may be largely realized, though high circulation reduces traditional scarcity-driven appreciation mechanisms
Institutional Investment and Mainstream Adoption (Institutional Investment in GRT)
- Adoption trend: The Graph serves as indexing infrastructure for blockchain data queries, with application in Ethereum and other networks
- Enterprise integration: The protocol's role in enabling decentralized applications (dApps) to query blockchain data positions it as infrastructure for Web3 development
- Market positioning: As a decentralized indexing protocol, GRT's value proposition ties to the growth of Web3 applications requiring data access solutions
Macroeconomic Environment's Impact on GRT Investment
- Market correlation: GRT demonstrates correlation with broader cryptocurrency market sentiment, particularly Bitcoin and Ethereum price movements
- Sector dynamics: The token's performance reflects overall sentiment toward Web3 infrastructure and decentralized application development
- Risk considerations: As of January 15, 2026, GRT trades at $0.04292, representing significant decline from historical levels, reflecting broader market conditions affecting infrastructure tokens
Technology and Ecosystem Development (Technology & Ecosystem for GRT Investment)
- Core functionality: The Graph protocol enables simplified data querying for blockchain applications through subgraph APIs, serving as middleware infrastructure
- Network effects: Increased adoption by developers and applications creates potential demand dynamics—more subgraphs deployed may attract additional developers seeking existing data infrastructure
- Ecosystem roles: Token utility includes indexer staking for query market participation and curator signaling for subgraph quality assessment, creating economic security mechanisms
- Application scope: Protocol supports data indexing across multiple blockchain networks, with contracts deployed on Ethereum and Arbitrum networks
III. GRT Future Investment Forecast and Price Outlook (Is The Graph(GRT) Worth Investing in 2026-2031)
Short-term Investment Forecast (2026, Short-term GRT Investment Outlook)
Based on available market analysis, short-term projections for The Graph (GRT) in 2026 present the following scenarios:
- Conservative forecast: $0.0351 - $0.0418
- Neutral forecast: $0.0428 - $0.0447
- Optimistic forecast: $0.0467 - $0.0587
Analysts suggest that GRT may demonstrate moderate stability during 2026, with price movements influenced by broader market sentiment and protocol adoption metrics. Some forecasters indicate the asset could reach approximately $0.04454 around early 2026, while others project potential year-end values near $0.05872 under favorable conditions.
Mid-term Investment Outlook (2027-2028, Mid-term The Graph(GRT) Investment Forecast)
-
Market stage expectation: The protocol may enter a maturation phase as Web3 infrastructure expands, potentially establishing higher baseline valuations through increased subgraph deployment and query volume growth.
-
Investment return projections:
- 2027: $0.0434 - $0.0559 (representing approximately 4% growth over 2026 baseline)
- 2028: $0.0292 - $0.0725 (showing wider variance reflecting market uncertainty)
-
Key catalysts: Protocol adoption by decentralized applications, integration with major blockchain networks, expansion of indexing services, and overall Web3 ecosystem development. Market analysis suggests GRT's price behavior may correlate with Ethereum network performance due to the predominance of Ethereum-based applications utilizing The Graph's services.
Long-term Investment Outlook (Is GRT a Good Long-term Investment?)
- Baseline scenario: $0.0437 - $0.0829 (assuming steady protocol development and gradual market expansion through 2029-2030)
- Optimistic scenario: $0.0720 - $0.0837 (contingent upon substantial Web3 adoption, protocol dominance in blockchain indexing, and favorable regulatory environments)
- Risk scenario: Below $0.0292 (under adverse market conditions, increased competition, or significant technological disruptions)
Some longer-term forecasts suggest potential growth to $0.4147 - $2.04 by 2035 under transformational scenarios, though such projections carry considerable uncertainty and depend on numerous variables including technological breakthroughs, mainstream adoption levels, and sustained competitive positioning.
Click to view GRT long-term investment and price forecasts: Price Prediction
2026-01-15 to 2031 Long-term Outlook
- Base scenario: $0.0351 - $0.0829 (corresponding to steady progress and gradual mainstream application enhancement)
- Optimistic scenario: $0.0725 - $0.0837 (corresponding to large-scale adoption and favorable market conditions)
- Transformative scenario: Above $0.40 (contingent upon breakthrough ecosystem developments and mainstream proliferation)
- 2031-12-31 projected high: $0.0802 (based on optimistic development assumptions)
Disclaimer: The information presented constitutes general market analysis and forward-looking projections derived from various analytical sources. Cryptocurrency markets exhibit considerable volatility, and actual performance may differ substantially from forecasts. Price predictions are inherently uncertain and should not be construed as investment recommendations. Multiple factors—including but not limited to technological developments, competitive dynamics, regulatory changes, macroeconomic conditions, and market sentiment—influence asset valuations. Prospective investors should conduct comprehensive independent research and consider their individual risk tolerance before making investment decisions. Past performance does not guarantee future results, and there exists potential for partial or total capital loss.
| Year |
Predicted High Price |
Predicted Average Price |
Predicted Low Price |
Price Change |
| 2026 |
0.0466738 |
0.04282 |
0.0351124 |
0 |
| 2027 |
0.055933625 |
0.0447469 |
0.043404493 |
4 |
| 2028 |
0.072489978 |
0.0503402625 |
0.02919735225 |
17 |
| 2029 |
0.0829104123375 |
0.06141512025 |
0.04421888658 |
43 |
| 2030 |
0.08370880890075 |
0.07216276629375 |
0.0404111491245 |
68 |
| 2031 |
0.080273861225167 |
0.07793578759725 |
0.070142208837525 |
81 |
IV. The Graph (GRT) Investment Strategy and Risk Management (How to invest in The Graph)
Investment Strategy (The Graph investment strategy)
Long-term Holding (HODL GRT)
Long-term holding represents a suitable approach for conservative investors seeking exposure to decentralized indexing protocols. This strategy involves accumulating GRT tokens during market corrections and maintaining positions through market cycles. The decentralized nature of The Graph's protocol and its role in blockchain data indexing may provide fundamental value over extended time horizons. However, investors should consider the token's price history, which shows significant volatility, having declined approximately 77.77% over the past year from its previous levels.
Active Trading
Active trading strategies rely on technical analysis and momentum-based operations. Given GRT's 24-hour trading volume of approximately $270,075 and price movements ranging from $0.04261 to $0.04439 within the last day, short-term traders may identify opportunities through chart patterns and volume indicators. The token demonstrated a 5.18% increase over seven days and 13.07% over thirty days, suggesting potential swing trading opportunities. However, the high volatility evidenced by the 1-hour decline of 1.43% indicates the need for disciplined risk management and stop-loss protocols.
Risk Management (Risk management for The Graph investment)
Asset Allocation Ratios
Investors may consider different allocation approaches based on their risk tolerance:
- Conservative investors: May allocate 1-3% of their cryptocurrency portfolio to GRT, maintaining larger positions in established assets
- Moderate investors: Could consider 3-7% allocation as part of a diversified crypto strategy
- Experienced investors: Might allocate 7-15% depending on their conviction in decentralized indexing protocols and market analysis
These percentages should be adjusted based on individual financial circumstances and overall portfolio composition.
Risk Hedging Solutions
A multi-asset portfolio approach can help manage concentration risk. Investors might consider:
- Diversifying across different blockchain infrastructure tokens
- Maintaining positions in established cryptocurrencies alongside GRT
- Utilizing stablecoin allocations to manage volatility exposure
- Considering correlation patterns with broader market movements
Secure Storage
Secure storage practices are fundamental to protecting GRT holdings:
- Cold Wallets: Hardware wallets provide offline storage for long-term holdings, reducing exposure to online security threats
- Hot Wallets: Exchange or software wallets may be suitable for active trading positions, though they carry higher security risks
- Hardware Wallet Options: Investors may research established hardware wallet providers that support ERC-20 tokens (GRT operates on Ethereum) and Arbitrum network tokens
- Multi-signature Solutions: For larger holdings, multi-signature wallets can provide additional security layers
V. The Graph (GRT) Investment Risks and Challenges (Risks of investing in The Graph)
Market Risks
The Graph token faces significant market-related risks:
- High Volatility: GRT demonstrates substantial price fluctuations, with the current price at $0.04292 representing a considerable distance from its historical range. The token has experienced a 77.77% decline over the past year, illustrating the potential for significant drawdowns
- Price Movements: Short-term price changes show fluctuations of 1.43% within one hour, indicating rapid price action that can impact portfolio values
- Market Depth: With 64 exchanges listing GRT and a 24-hour trading volume of approximately $270,075, liquidity conditions may vary across different trading venues
- Market Cap Dynamics: The market capitalization of approximately $458 million and a circulating supply of 10.67 billion tokens (98.84% of maximum supply) present specific market structure characteristics
Regulatory Risks
Regulatory uncertainty affects GRT across multiple jurisdictions:
- Policy Variations: Different countries maintain varying approaches to cryptocurrency regulation, which may impact GRT's accessibility and trading conditions
- Classification Uncertainty: The regulatory classification of utility tokens like GRT remains subject to evolving frameworks in multiple jurisdictions
- Compliance Requirements: Changing compliance standards may affect exchanges listing GRT or services utilizing The Graph protocol
- Cross-border Considerations: The decentralized nature of The Graph protocol operates across international boundaries, subject to multiple regulatory regimes
Technical Risks
Technical considerations present specific challenges:
- Network Security: As a blockchain indexing protocol, The Graph's security depends on its network of indexers and the integrity of its staking mechanisms
- Smart Contract Risks: GRT operates on Ethereum (contract address: 0xc944e90c64b2c07662a292be6244bdf05cda44a7) and Arbitrum (contract address: 0x9623063377AD1B27544C965cCd7342f7EA7e88C7), exposing it to potential smart contract vulnerabilities
- Protocol Updates: Changes to The Graph protocol or the underlying blockchain networks (Ethereum, Arbitrum) may introduce technical uncertainties
- Integration Dependencies: The value proposition depends on continued adoption of subgraph technology and the broader Web3 ecosystem development
VI. Conclusion: Is The Graph a Good Investment?
Investment Value Summary
The Graph (GRT) presents a distinctive position within blockchain infrastructure, focusing on decentralized data indexing and querying services. The token's market position, with a ranking of 139 and market capitalization of approximately $458 million as of January 15, 2026, reflects its established presence in the cryptocurrency ecosystem.
The protocol's fundamental role in making blockchain data accessible through subgraphs provides a specific use case within the broader Web3 infrastructure. However, the token has experienced significant price volatility, with substantial year-over-year declines offsetting shorter-term gains. The current price of $0.04292 represents a considerable distance from its historical price levels, indicating substantial market fluctuation characteristics.
The near-complete circulation of tokens (98.84% of maximum supply) presents a specific tokenomics profile, with approximately 173,059 holders according to available data. The dual-purpose utility within the protocol—indexer staking and curator signaling—establishes a framework for network participation, though the relationship between utility and token value remains subject to market dynamics.
Investor Recommendations
For Beginners
✅ Dollar-Cost Averaging: Consider systematic, periodic purchases rather than lump-sum investments to manage entry price risk
✅ Secure Storage: Prioritize learning proper wallet security practices, utilizing hardware wallets for holdings intended for long-term storage
✅ Education First: Understand The Graph protocol's function, tokenomics, and the broader blockchain data indexing landscape before investing
✅ Position Sizing: Maintain small position sizes relative to overall portfolio until gaining experience with cryptocurrency volatility
For Experienced Investors
✅ Technical Analysis: Utilize price patterns, volume indicators, and momentum signals for potential swing trading opportunities
✅ Portfolio Integration: Consider GRT's correlation with other infrastructure tokens and the broader cryptocurrency market in portfolio construction
✅ Risk-Adjusted Positioning: Adjust allocation based on market conditions, protocol developments, and technical indicators
✅ Active Monitoring: Track on-chain metrics, protocol usage, and ecosystem developments that may impact token value
For Institutional Investors
✅ Strategic Assessment: Evaluate The Graph's position within blockchain infrastructure and its potential role in Web3 data services
✅ Due Diligence: Conduct comprehensive analysis of protocol economics, governance structure, and competitive positioning
✅ Compliance Framework: Ensure regulatory compliance across relevant jurisdictions for institutional holding and custody
✅ Long-term Perspective: Consider allocation within the context of multi-year blockchain infrastructure investment theses
⚠️ Important Notice: Cryptocurrency investments carry substantial risk, including the possibility of complete loss of invested capital. The Graph (GRT) has demonstrated significant price volatility and market fluctuations. This content is provided for informational purposes only and does not constitute investment advice, financial advice, trading advice, or any other type of advice. Investors should conduct independent research and consult with qualified financial advisors before making investment decisions. Past performance does not indicate future results.
VII. FAQ
Q1: What is The Graph (GRT) and why is it considered a blockchain infrastructure investment?
The Graph is a decentralized protocol for indexing and querying blockchain data, with GRT serving as its native utility token priced at approximately $0.04292 as of January 2026. The protocol functions as middleware infrastructure that enables decentralized applications (dApps) to efficiently access blockchain data through subgraph APIs, eliminating the need for centralized indexing services. GRT tokens are utilized by three key network participants: indexers who stake GRT to process queries and earn rewards, curators who signal quality subgraphs by staking GRT, and delegators who contribute to network security by delegating tokens to indexers. This infrastructure positioning places GRT within the Web3 ecosystem foundation, with its value proposition tied to the growth of decentralized applications requiring accessible blockchain data services across Ethereum, Arbitrum, and other supported networks.
Q2: Has The Graph (GRT) been a profitable investment historically?
The Graph's investment performance has demonstrated significant volatility since its mainnet launch in December 2020. Early participants who acquired GRT near its initial price of $0.03 experienced substantial returns when the token reached $2.84 in February 2021, representing approximately 9,367% gains during the broader 2021 crypto market rally. However, subsequent market conditions resulted in prolonged corrections, with GRT declining to sub-$0.10 ranges by late 2022. As of January 2026, the token trades at $0.04292, reflecting a 77.77% decline from previous year levels despite showing 13.07% recovery over 30 days and 5.18% gains over 7 days. This historical pattern indicates that GRT investment outcomes have varied dramatically based on entry and exit timing, with early participants realizing substantial gains while later investors have experienced significant drawdowns aligned with broader cryptocurrency market cycles.
Q3: What are the projected price forecasts for GRT from 2026 to 2031?
Price projections for The Graph suggest varied scenarios based on different market conditions and adoption levels. For 2026, conservative forecasts range from $0.0351 to $0.0418, with neutral scenarios around $0.0428 to $0.0447, and optimistic projections reaching $0.0467 to $0.0587. Mid-term outlook for 2027-2028 indicates potential ranges of $0.0434 to $0.0559 for 2027 and $0.0292 to $0.0725 for 2028, representing wider variance reflecting market uncertainty. Long-term base scenarios through 2031 project ranges of $0.0437 to $0.0829 under steady development assumptions, while optimistic scenarios suggest $0.0720 to $0.0837 contingent upon substantial Web3 adoption. Some transformational forecasts indicate potential growth to $0.4147 and beyond by 2035, though such projections carry considerable uncertainty. These forecasts depend on multiple variables including technological developments, competitive positioning, regulatory environments, and overall blockchain ecosystem expansion.
Q4: What investment allocation percentage is appropriate for GRT in a cryptocurrency portfolio?
Investment allocation for The Graph should be calibrated to individual risk tolerance and investment experience levels. Conservative investors may consider allocating 1-3% of their cryptocurrency portfolio to GRT, maintaining larger positions in established assets like Bitcoin and Ethereum to manage concentration risk. Moderate investors with balanced risk appetites could consider 3-7% allocation as part of a diversified crypto strategy that includes multiple blockchain infrastructure tokens. Experienced investors with higher risk tolerance and conviction in decentralized indexing protocols might allocate 7-15% based on their market analysis and portfolio composition. These percentages represent general guidelines and should be adjusted based on individual financial circumstances, overall portfolio size, and investment objectives. Given GRT's demonstrated volatility—including 77.77% year-over-year decline despite recent short-term gains—position sizing should account for potential significant drawdowns while maintaining exposure to potential infrastructure value appreciation.
Q5: What are the primary risks associated with investing in The Graph (GRT)?
The Graph investment carries multiple risk categories requiring consideration. Market risks include high volatility evidenced by the 77.77% annual decline and rapid short-term fluctuations of 1.43% within one-hour periods, alongside liquidity considerations with $270 million daily trading volume across 64 exchanges. Regulatory risks stem from evolving cryptocurrency frameworks across jurisdictions, uncertain utility token classification, and potential compliance requirement changes affecting both exchanges and protocol services. Technical risks encompass network security dependencies on indexer staking mechanisms, smart contract vulnerabilities on Ethereum (0xc944e90c64b2c07662a292be6244bdf05cda44a7) and Arbitrum (0x9623063377AD1B27544C965cCd7342f7EA7e88C7) networks, and integration dependencies on broader Web3 ecosystem development. Additionally, near-complete token circulation (98.84% of maximum supply) limits traditional scarcity-driven appreciation mechanisms, while the token's value proposition depends on continued subgraph technology adoption and decentralized application growth requiring blockchain data indexing services.
Q6: How does The Graph's tokenomics structure affect its investment potential?
The Graph's tokenomics present specific characteristics influencing investment dynamics. With a maximum supply of 10.80 billion tokens and current circulation of 10.67 billion (98.84%), GRT demonstrates near-complete token distribution, significantly reducing potential supply-side inflation pressure compared to projects with lower circulation percentages. This high circulation rate limits traditional scarcity-driven appreciation mechanisms while establishing a relatively stable supply environment. The token's utility structure creates economic security through staking requirements: indexers must stake GRT to participate in query markets and earn rewards, curators stake to signal subgraph quality, and delegators contribute to network security by delegating tokens. These mechanisms theoretically align token holder interests with protocol success, as network growth and query volume expansion should increase staking rewards and utility demand. However, the relationship between protocol usage metrics and token value remains subject to market dynamics, competitive pressures, and broader cryptocurrency sentiment, with approximately 173,059 holder addresses indicating moderate distribution breadth within the ecosystem.
Q7: Should investors choose long-term holding or active trading strategies for GRT?
The optimal strategy for GRT depends on individual investment objectives, risk tolerance, and market expertise. Long-term holding (HODL) suits conservative investors seeking exposure to decentralized indexing infrastructure, involving accumulation during market corrections and position maintenance through cycles based on fundamental protocol value propositions. This approach acknowledges GRT's 77.77% annual decline but focuses on potential multi-year Web3 infrastructure development and protocol maturation. Active trading strategies leverage technical analysis and momentum operations, capitalizing on GRT's observable volatility patterns—5.18% seven-day gains and 13.07% thirty-day increases—alongside $270,075 daily trading volume enabling entry and exit execution. Short-term traders might identify opportunities through chart patterns while implementing disciplined stop-loss protocols to manage the 1.43% hourly fluctuation risks. Mixed approaches combining core long-term holdings with tactical trading positions around that base can balance conviction in infrastructure value with opportunistic short-term gains, though such strategies require active monitoring and technical analysis capabilities beyond basic buy-and-hold approaches.
Q8: What security measures should investors implement for storing GRT tokens?
Proper GRT storage security requires differentiated approaches based on holding duration and trading frequency. For long-term holdings, hardware wallets (cold storage) provide optimal security by maintaining private keys offline, reducing exposure to online threats, phishing attacks, and exchange vulnerabilities. Since GRT operates as an ERC-20 token on Ethereum and on Arbitrum network, investors should verify hardware wallet compatibility with these networks before purchase. Hot wallets—including exchange wallets and software wallets—offer convenience for active trading positions but carry higher security risks including potential exchange hacks and software vulnerabilities. Multi-signature wallet solutions provide additional security layers for larger holdings, requiring multiple authorization signatures for transactions. Investors should implement foundational security practices including: enabling two-factor authentication on exchange accounts, maintaining secure backup of recovery phrases in offline locations, verifying contract addresses (Ethereum: 0xc944e90c64b2c07662a292be6244bdf05cda44a7; Arbitrum: 0x9623063377AD1B27544C965cCd7342f7EA7e88C7) before transactions, and avoiding storage of significant holdings on centralized exchanges for extended periods.
* The information is not intended to be and does not constitute financial advice or any other recommendation of any sort offered or endorsed by Gate.