This comprehensive investment analysis evaluates XT Smart Chain (XT), a Layer 2 blockchain infrastructure asset with current market cap of $30.6 million and price around $5.06. The article examines XT's technical capabilities—3,000+ TPS processing with sub-3-second confirmations and full EVM compatibility—alongside ecosystem metrics including $48 million TVL and 10+ core DApps. Price forecasts span 2026-2031 across conservative, neutral, and optimistic scenarios, ranging from $3.04 to $11.77. The analysis addresses core investment considerations: supply scarcity (0.60% circulation ratio), institutional adoption potential, macroeconomic impacts, and technology development. Investment strategies for beginners, experienced traders, and institutional investors receive tailored recommendations with risk management protocols. Critical risk factors—market volatility, regulatory uncertainty, technical vulnerabilities, and liquidity constraints—are comprehensively detailed. Investors can access real-time XT market pri
Introduction: XT Smart Chain (XT) Investment Position and Market Outlook
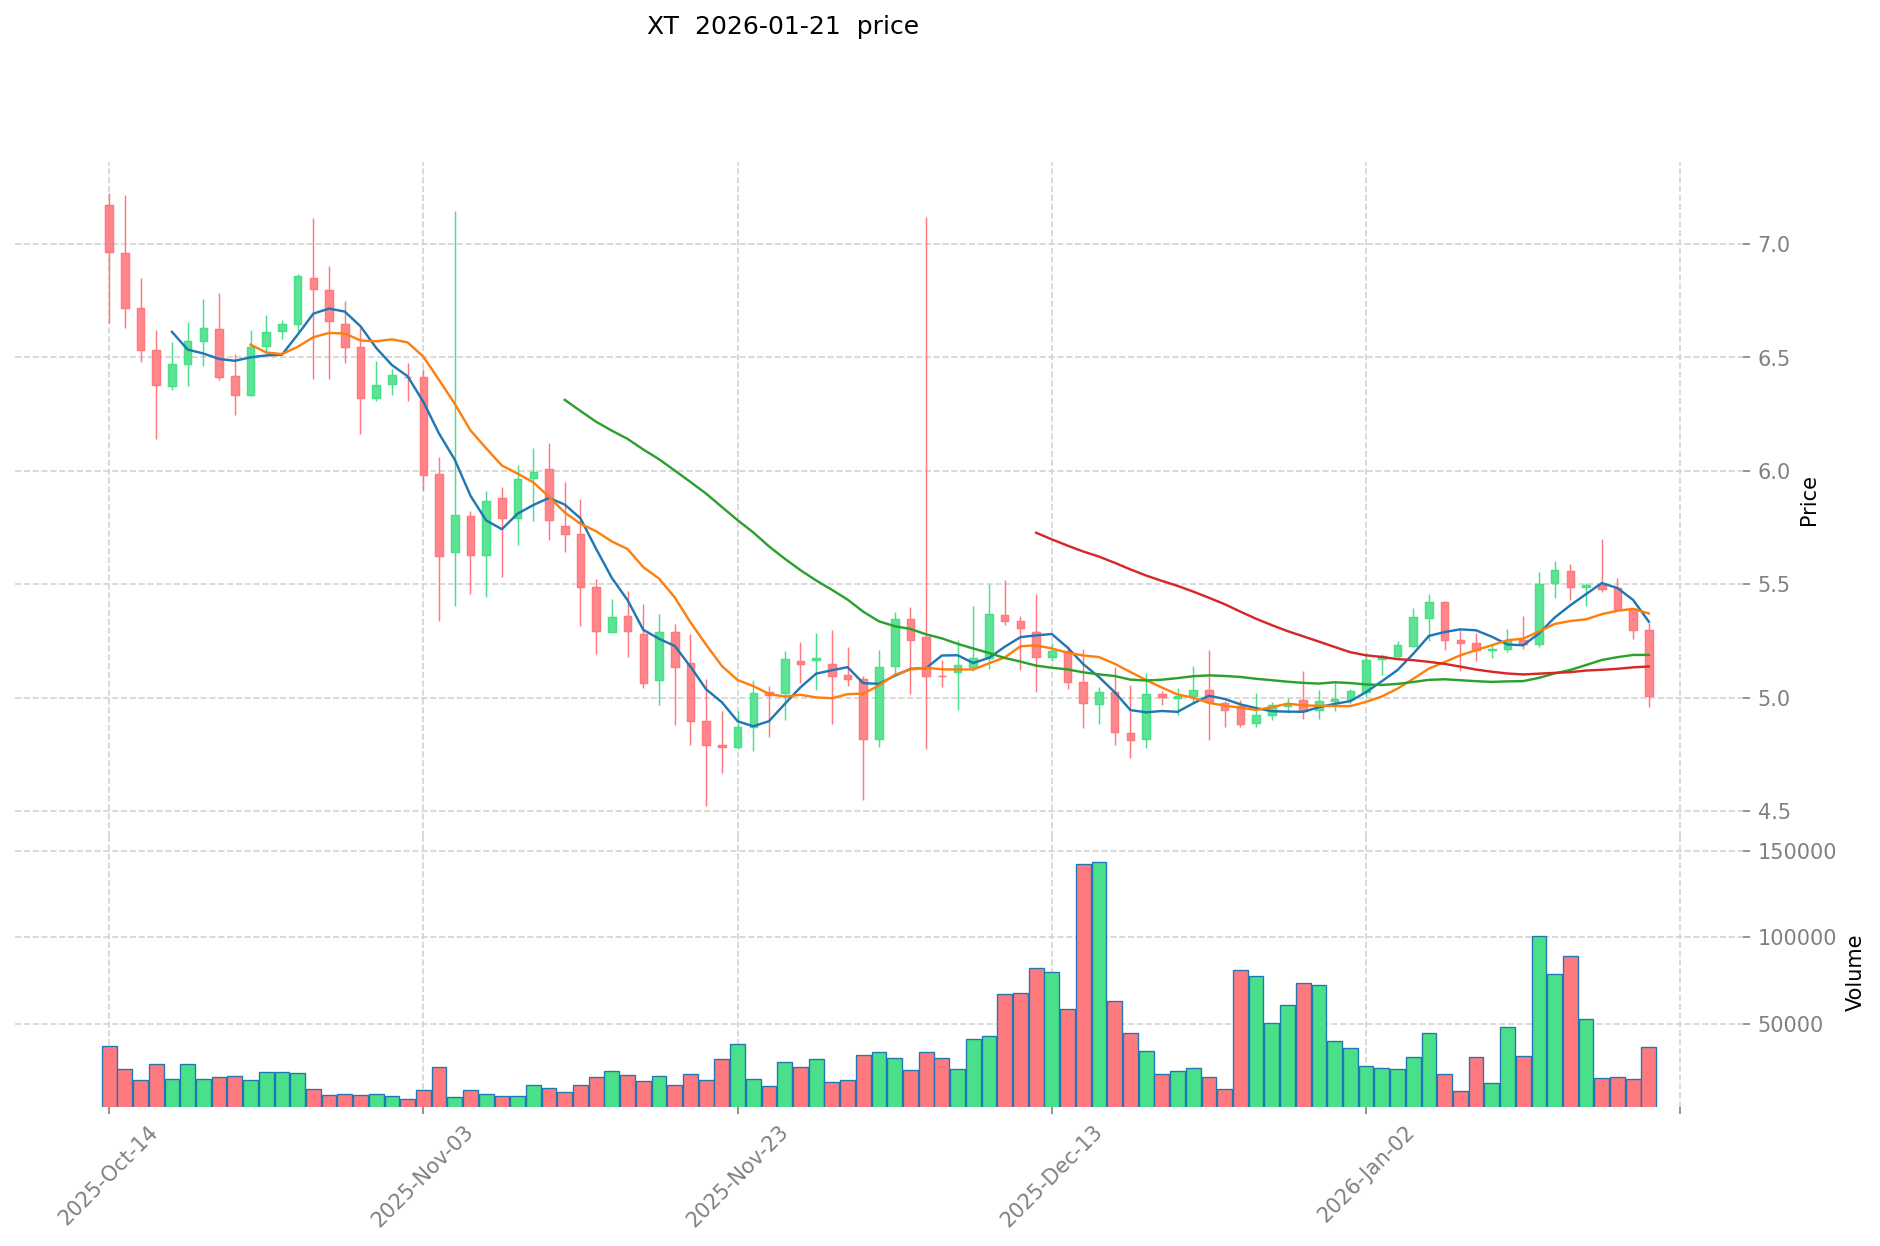
XT is a notable asset in the cryptocurrency field. As of January 21, 2026, XT maintains a market capitalization of approximately $30.60 million, with a circulating supply of around 6.05 million tokens, and the current price stands at approximately $5.06. With its positioning in the blockchain infrastructure sector, XT has gradually become a focal point when investors discuss "Is XT Smart Chain (XT) a good investment?" This article will comprehensively analyze XT's investment value, historical trends, future price predictions, and investment risks to provide reference for investors.
XT Smart Chain (XSC) is a public blockchain infrastructure project dedicated to providing high-performance, low-cost blockchain services. Through innovative Layer 2 technology, it achieves over 3000 transactions per second processing capability with confirmation times under 3 seconds, while maintaining full EVM compatibility. The platform has shown development momentum, with Total Value Locked (TVL) exceeding $48 million and featuring a comprehensive ecosystem of over 10 core DApps spanning Service, NFT, and cross-chain solutions.
Currently ranked 708 in the cryptocurrency market, XT represents approximately 0.16% market dominance. The token has experienced price fluctuations, with recent performance showing a decline of 3.16% over 24 hours and 8.03% over 7 days, while demonstrating a modest increase of 0.12% over the past 30 days. The fully diluted market cap stands at approximately $5.06 billion, with a circulating supply ratio of 60.46% against the total supply of 1 billion tokens.
I. XT Smart Chain (XT) Price History Review and Current Investment Value
- 2025: Price fluctuations throughout the year → XT experienced volatility with notable price movements
- October 2025: Price reached a notable level of $7.961 → XT showed upward momentum during this period
- April 2025: Price declined to $3.645 → Market faced downward pressure resulting in lower valuation
- Recent period: From higher levels to current trading range → Price adjusted from previous peaks to approximately $5.061
Current XT Investment Market Status (January 2026)
- XT current price: $5.061
- Market sentiment (Fear & Greed Index): Data indicates cautious market positioning
- 24-hour trading volume: $188,788.40
- Trading activity: XT is listed on 3 exchanges
- Market capitalization: $30.60 million with a circulating supply of 6.05 million tokens
- Circulation ratio: Approximately 0.60% of total supply (1 billion tokens) currently in circulation
- Recent performance: 1-hour change of -0.30%, 24-hour decline of -3.16%, 7-day decrease of -8.03%, 30-day increase of 0.12%
Click to view real-time XT market price
II. Core Factors Affecting Whether XT is a Good Investment (Is XT Smart Chain (XT) a Good Investment)
Supply Mechanism and Scarcity (XT investment scarcity)
- Supply mechanism influences price and investment value
- The maximum supply is capped at 1,000,000,000 XT tokens, with a current circulating supply of approximately 6,045,803 tokens, representing around 0.60% of the total supply
- The controlled token release schedule creates potential scarcity dynamics as circulation gradually increases
- Investment significance: the relatively low current circulation ratio compared to maximum supply may contribute to supply-side considerations in long-term investment evaluations
Institutional Investment and Mainstream Adoption (Institutional investment in XT)
- The platform has demonstrated ecosystem growth with Total Value Locked (TVL) exceeding $48 million
- XT Smart Chain features a comprehensive ecosystem of over 10 core DApps spanning Service, NFT, and cross-chain solutions, indicating increasing developer and user adoption
- The presence of multiple decentralized applications suggests ongoing ecosystem development that may influence investment considerations
Macroeconomic Environment's Impact on XT Investment
- Monetary policy and interest rate changes influence the attractiveness of alternative investments, including blockchain infrastructure projects
- Market conditions and broader cryptocurrency sector performance typically affect public chain infrastructure tokens
- Geopolitical uncertainty and economic factors may drive interest toward decentralized blockchain solutions
Technology and Ecosystem Development (Technology & Ecosystem for XT investment)
- Layer 2 technology implementation: achieves transaction processing capacity exceeding 3,000 TPS with confirmation times under 3 seconds, potentially enhancing network performance and investment appeal
- EVM compatibility: maintains full compatibility with Ethereum Virtual Machine, enabling cross-platform application deployment and ecosystem expansion
- DeFi, NFT, and cross-chain solutions within the ecosystem provide diversified use cases that may support long-term value considerations
- The platform's low-cost transaction model and high-performance infrastructure position it competitively within the public blockchain sector
III. XT Future Investment Forecast and Price Outlook (Is XT Smart Chain (XT) worth investing in 2026-2031)
Short-term Investment Forecast (2026, short-term XT investment outlook)
- Conservative forecast: $3.04 - $4.50
- Neutral forecast: $4.50 - $5.06
- Optimistic forecast: $5.06 - $5.36
Mid-term Investment Outlook (2027-2028, mid-term XT Smart Chain (XT) investment forecast)
- Market stage expectation: The project may experience moderate growth as the Layer 2 ecosystem continues to develop and expand its DApp offerings
- Investment return forecast:
- 2027: $3.34 - $7.30
- 2028: $5.44 - $7.13
- Key catalysts: Expansion of the DApp ecosystem, potential increases in TVL, and broader EVM-compatible integrations
Long-term Investment Outlook (Is XT Smart Chain a good long-term investment?)
- Base scenario: $5.35 - $9.44 (assuming steady ecosystem growth and maintained competitive positioning)
- Optimistic scenario: $9.44 - $11.77 (assuming strong adoption, expanded partnerships, and favorable market conditions)
- Risk scenario: $3.04 - $5.35 (reflecting potential market downturns or increased competition)
View XT long-term investment and price forecast: Price Prediction
2026-01-21 - 2031 Long-term Outlook
- Base scenario: $5.35 - $9.44 (corresponding to steady progress and gradual mainstream application improvement)
- Optimistic scenario: $9.44 - $11.77 (corresponding to large-scale adoption and favorable market environment)
- Transformative scenario: Above $11.77 (such as breakthrough progress in ecosystem and mainstream popularization)
- 2031-12-31 predicted high: $11.77 (based on optimistic development assumptions)
Disclaimer: Price predictions are speculative and based on historical data analysis and market trends. Cryptocurrency investments carry significant risks, and actual prices may differ substantially from forecasts. This content does not constitute investment advice.
| Year |
Predicted High Price |
Predicted Average Price |
Predicted Low Price |
Price Change |
| 2026 |
5.3636 |
5.06 |
3.036 |
0 |
| 2027 |
7.29652 |
5.2118 |
3.335552 |
2 |
| 2028 |
7.1297424 |
6.25416 |
5.4411192 |
23 |
| 2029 |
9.435651192 |
6.6919512 |
5.35356096 |
32 |
| 2030 |
11.77314974616 |
8.063801196 |
7.09614505248 |
59 |
| 2031 |
10.2160297352124 |
9.91847547108 |
9.1249974333936 |
95 |
IV. XT Investment Strategy and Risk Management (How to invest in XT Smart Chain)
Investment Methodology (XT investment strategy)
Long-term Holding (HODL XT): Suitable for Conservative Investors
For investors seeking steady exposure to blockchain infrastructure, XT Smart Chain presents a long-term holding opportunity. The platform's technical foundation—featuring over 3,000 TPS processing capacity and sub-3-second confirmation times—positions it within the competitive Layer 2 landscape. With TVL exceeding $48 million and an ecosystem comprising over 10 core DApps spanning Service, NFT, and cross-chain solutions, the project demonstrates operational traction. Long-term holders may consider accumulating positions during periods of market consolidation, monitoring ecosystem growth metrics such as TVL expansion and DApp adoption rates.
Active Trading: Technical Analysis and Swing Trading
Active traders can approach XT through technical analysis frameworks, given its price history showing fluctuations between $3.645 (recorded April 2025) and $7.961 (recorded October 2025). Current price levels around $5.061 with 24-hour volatility ranging from $4.958 to $5.216 provide swing trading opportunities. Traders should monitor volume patterns—current 24-hour volume stands at approximately $188,788—and key resistance/support levels. The 7-day decline of approximately 8% suggests potential entry points for short-term positioning, though risk management remains essential given cryptocurrency market volatility.
Risk Management (Risk management for XT investment)
Asset Allocation Ratios: Conservative / Aggressive / Professional Investors
- Conservative Investors: Allocate 1-3% of cryptocurrency portfolio to XT, treating it as a speculative Layer 2 infrastructure position within broader digital asset holdings
- Aggressive Investors: May allocate 5-10% to XT, balancing exposure with established Layer 1 and Layer 2 platforms
- Professional Investors: Consider 3-7% allocation as part of diversified blockchain infrastructure thesis, incorporating correlation analysis with broader smart contract platforms
Risk Hedging Strategies: Multi-Asset Portfolio + Hedging Instruments
Investors should construct diversified portfolios combining XT with:
- Established Layer 1 platforms to balance infrastructure exposure
- Stablecoins for liquidity management (20-30% portfolio allocation)
- Major digital assets for market correlation hedging
Advanced investors may explore derivatives markets where available, though liquidity considerations apply given XT's presence on 3 exchanges.
Secure Storage: Hot/Cold Wallets + Hardware Wallet Recommendations
- Cold Storage: Hardware wallets (Ledger, Trezor) recommended for long-term holdings exceeding $1,000
- Hot Wallets: EVM-compatible wallets (MetaMask, Trust Wallet) suitable for active trading and DApp interaction, maintaining only working capital amounts
- Security Protocol: Implement multi-signature solutions for holdings exceeding $10,000; regular backup of recovery phrases in secure, offline locations
V. XT Investment Risks and Challenges (Risks of investing in XT Smart Chain)
Market Risks: Volatility and Liquidity Concerns
XT exhibits significant price volatility, with historical range spanning from $3.645 to $7.961 within recent periods. The current market capitalization of approximately $30.6 million and trading volume around $188,788 indicate moderate liquidity levels. Market cap to fully diluted valuation ratio of 0.6% suggests potential dilution concerns as circulating supply (approximately 6.05 million tokens) represents roughly 0.60% of total supply (1 billion tokens). Price manipulation risks exist in lower-liquidity markets, necessitating careful order execution strategies.
Regulatory Risks: Policy Uncertainty Across Jurisdictions
As blockchain infrastructure, XT Smart Chain operates within evolving regulatory frameworks globally. Jurisdictional differences in cryptocurrency classification, securities laws, and cross-border transaction regulations present compliance uncertainties. Changes in regulatory stances—particularly regarding Layer 2 solutions, DeFi protocols, and cross-chain operations—could impact platform operations and token utility. Investors should monitor regulatory developments in key markets and assess geographic diversification of project operations.
Technical Risks: Network Security and Upgrade Challenges
Layer 2 blockchain infrastructure faces inherent technical risks including:
- Smart Contract Vulnerabilities: Despite EVM compatibility, protocol-level bugs or DApp security issues could impact ecosystem confidence
- Network Upgrades: Protocol modifications or scaling adjustments carry execution risks
- Bridge Security: Cross-chain solutions involve additional attack vectors requiring robust security audits
- Centralization Concerns: Validator set concentration or governance centralization could affect decentralization properties
The platform's relatively recent ecosystem development (with 10+ core DApps) suggests ongoing maturation processes where technical challenges may emerge.
VI. Conclusion: Is XT Smart Chain a Good Investment?
Investment Value Summary
XT Smart Chain presents a Layer 2 infrastructure opportunity with demonstrated technical capabilities—3,000+ TPS processing and sub-3-second confirmations—alongside growing ecosystem metrics including $48 million TVL and over 10 core DApps. The project addresses blockchain scalability challenges while maintaining EVM compatibility. However, investors should recognize substantial short-term price volatility, evidenced by recent 7-day decline of approximately 8% and historical price range fluctuations. The low circulating supply ratio (0.60% of total supply) introduces potential dilution considerations for long-term valuation assessments.
Investor Recommendations
✅ Beginners: Consider dollar-cost averaging (DCA) strategy with small position sizes (1-2% of cryptocurrency portfolio) + secure cold storage using hardware wallets for holdings intended beyond 6-month timeframe
✅ Experienced Investors: Implement swing trading strategies around technical support/resistance levels + diversified portfolio allocation (3-5%) balanced with established Layer 1/Layer 2 platforms + active monitoring of TVL trends and ecosystem development
✅ Institutional Investors: Evaluate strategic long-term allocation (2-4%) within blockchain infrastructure thesis + comprehensive due diligence on tokenomics, governance structure, and technical roadmap + risk-adjusted position sizing accounting for liquidity constraints
⚠️ Disclaimer: Cryptocurrency investments involve substantial risk including potential total loss of capital. This analysis provides informational content only and does not constitute investment advice, financial guidance, or recommendation to buy, sell, or hold any digital asset. Investors should conduct independent research, consult qualified financial advisors, and assess personal risk tolerance before making investment decisions. Past performance does not indicate future results.
VII. FAQ
Q1: What is the current circulation ratio of XT Smart Chain tokens, and how might this affect investment value?
XT Smart Chain currently has approximately 6.05 million tokens in circulation, representing only 0.60% of the total supply of 1 billion tokens. This extremely low circulation ratio presents both opportunities and considerations for investors. The controlled token release schedule creates potential scarcity dynamics in the near term, which could support price stability if demand remains constant or increases. However, investors should recognize that as additional tokens enter circulation over time, dilution effects may impact long-term valuation. The fully diluted market cap stands at approximately $5.06 billion compared to the current market cap of $30.6 million, indicating substantial potential dilution risk as circulating supply expands. Investment strategies should account for this tokenomics structure when evaluating entry points and position sizing.
Q2: How does XT Smart Chain's technical performance compare to other Layer 2 solutions?
XT Smart Chain achieves over 3,000 transactions per second (TPS) with confirmation times under 3 seconds while maintaining full EVM compatibility. This performance positions it competitively within the Layer 2 infrastructure landscape, offering meaningful improvements over Layer 1 Ethereum's base throughput while ensuring seamless integration with existing Ethereum-based applications and developer tools. The platform's low-cost transaction model combined with high-performance capabilities addresses key blockchain scalability challenges. The ecosystem's Total Value Locked (TVL) exceeding $48 million and presence of over 10 core DApps spanning Service, NFT, and cross-chain solutions demonstrate practical adoption of these technical capabilities. However, investors should evaluate these metrics relative to competing Layer 2 platforms when assessing long-term competitive positioning.
Q3: What are the primary risks associated with investing in XT Smart Chain?
XT Smart Chain investments face several significant risk categories. Market risks include substantial price volatility—evidenced by recent 7-day decline of approximately 8% and historical range from $3.645 to $7.961—alongside moderate liquidity constraints with 24-hour trading volume around $188,788 across 3 exchanges. Regulatory risks stem from evolving policy frameworks affecting blockchain infrastructure, DeFi protocols, and cross-chain operations across different jurisdictions. Technical risks encompass smart contract vulnerabilities, network upgrade execution challenges, bridge security concerns for cross-chain functionality, and potential centralization issues in validator sets or governance structures. The relatively early ecosystem stage with ongoing maturation processes introduces additional uncertainty. Investors should implement comprehensive risk management strategies including diversified portfolio construction, appropriate position sizing (typically 1-5% of cryptocurrency holdings depending on risk tolerance), and secure storage protocols using hardware wallets for long-term positions.
Q4: Is XT Smart Chain suitable for long-term holding, and what are the projected price targets?
XT Smart Chain may suit long-term holding strategies for investors seeking exposure to Layer 2 blockchain infrastructure, though substantial uncertainties exist. Price forecasts suggest potential ranges of $5.35-$9.44 under base scenario assumptions through 2031, with optimistic scenarios projecting $9.44-$11.77 assuming strong ecosystem adoption and favorable market conditions. However, risk scenarios indicate potential decline to $3.04-$5.35 range reflecting market downturns or increased competition. Long-term investment thesis depends on continued ecosystem development, TVL expansion, DApp adoption rates, and maintenance of competitive technical positioning. Conservative investors should consider dollar-cost averaging approaches with 1-3% portfolio allocation, monitoring key growth metrics quarterly. The extremely low current circulation ratio (0.60%) introduces future dilution considerations that should factor into long-term valuation assessments and exit strategy planning.
Q5: How should different investor types approach XT Smart Chain investment strategies?
Investment approach should align with experience level and risk tolerance. Beginners should implement dollar-cost averaging (DCA) with small position sizes (1-2% of cryptocurrency portfolio), focusing on secure cold storage using hardware wallets for holdings exceeding 6-month timeframes, and avoiding leverage or complex trading strategies. Experienced investors may employ swing trading strategies around technical support/resistance levels identified through price history analysis, maintain diversified allocations (3-5%) balanced with established Layer 1/Layer 2 platforms, and actively monitor TVL trends, DApp ecosystem development, and trading volume patterns. Institutional investors should evaluate strategic long-term allocation (2-4%) within broader blockchain infrastructure investment thesis, conduct comprehensive due diligence on tokenomics, governance structure, and technical roadmap, implement risk-adjusted position sizing accounting for liquidity constraints, and establish clear entry/exit criteria based on fundamental metrics rather than short-term price movements.
Q6: What ecosystem metrics should investors monitor to evaluate XT Smart Chain's development progress?
Key performance indicators for tracking XT Smart Chain ecosystem health include Total Value Locked (TVL), currently exceeding $48 million, which reflects capital deployed within platform protocols. DApp adoption metrics—currently showing over 10 core applications spanning Service, NFT, and cross-chain solutions—indicate developer activity and user engagement levels. Transaction volume and unique active addresses provide network activity insights beyond token price movements. Token circulation rate expansion from current 0.60% of total supply offers visibility into tokenomics progression. Partnership announcements, exchange listings beyond current 3 platforms, and integration with major DeFi protocols signal expanding ecosystem connections. Technical development milestones including protocol upgrades, security audit results, and cross-chain bridge implementations demonstrate continued innovation. Investors should establish regular monitoring cadence (monthly or quarterly) for these metrics to assess whether ecosystem growth supports investment thesis assumptions.
Q7: What security measures should XT Smart Chain investors implement for asset protection?
Security protocols should vary based on holding size and time horizon. For cold storage, hardware wallets (Ledger, Trezor) are recommended for long-term holdings exceeding $1,000, stored offline in secure locations with recovery phrases backed up separately using physical media (metal plates or paper) in multiple secure locations. For hot wallets, EVM-compatible options (MetaMask, Trust Wallet) suit active trading and DApp interaction, maintaining only working capital amounts (typically under 10% of total holdings). Multi-signature solutions should be implemented for holdings exceeding $10,000, requiring multiple approval signatures for transaction authorization. Additional security measures include regular software updates, verification of contract addresses before transactions, use of separate devices for significant transactions, and avoidance of public WiFi networks when accessing wallets. Investors should never share private keys or recovery phrases, remain vigilant against phishing attempts, and consider cybersecurity insurance for substantial holdings.
Q8: How does macroeconomic environment affect XT Smart Chain investment considerations?
Macroeconomic conditions significantly influence cryptocurrency investments including XT Smart Chain. Monetary policy changes, particularly interest rate adjustments by central banks, affect opportunity cost of holding non-yield-bearing crypto assets versus traditional fixed-income securities. Risk appetite cycles in broader financial markets typically correlate with cryptocurrency sector performance, with risk-on environments generally supporting altcoin valuations while risk-off periods drive capital toward established assets or stablecoins. Inflation dynamics may increase interest in decentralized blockchain solutions as alternative store of value mechanisms, though higher inflation often coincides with tighter monetary policy that pressures speculative assets. Geopolitical uncertainty can drive both positive interest in decentralized infrastructure and negative correlation through general market risk aversion. Investors should monitor Federal Reserve policy direction, global economic growth indicators, and traditional market volatility indices (VIX) as contextual factors when timing XT investment decisions and adjusting portfolio risk exposure.
* The information is not intended to be and does not constitute financial advice or any other recommendation of any sort offered or endorsed by Gate.