This comprehensive analysis compares Kaspa (KAS) and Solana (SOL), two Layer-1 blockchains with distinct architectures, examining scalability solutions and transaction economics. KAS employs Proof-of-Work consensus with the GHOSTDAG protocol, featuring a fair launch model and deflationary supply through mining halvings, while SOL utilizes delegated Proof-of-Stake with staking yields around 7.19%. The article evaluates historical price performance, current market metrics, institutional adoption trends, and ecosystem development across both platforms. Current data shows SOL's $82.3 billion market cap versus KAS's $1.3 billion, with SOL demonstrating substantially higher trading liquidity. Through detailed comparison of tokenomics, technical specifications, and risk factors, this guide helps investors identify which Layer-1 blockchain aligns with their investment objectives and risk tolerance. Comprehensive price projections through 2031 and strategic recommendations serve both novice and experienced investors o
Introduction: Investment Comparison Between KAS and SOL
In the cryptocurrency market, the comparison between Kaspa and Solana has consistently drawn investor attention. These two projects exhibit distinct differences in market capitalization rankings, application scenarios, and price performance, representing different positioning strategies within the crypto asset landscape.
Kaspa (KAS): Launched in 2022, this project has gained market recognition through its implementation of the GHOSTDAG protocol, positioning itself as a fast, open-source, and fully scalable Layer-1 solution utilizing proof-of-work consensus.
Solana (SOL): Since its establishment in 2017 by former engineers from Qualcomm, Intel, and Dropbox, this platform has been recognized as a high-performance blockchain protocol, focusing on providing scalability through its delegated proof-of-stake mechanism.
This article will comprehensively analyze the investment value comparison between Kaspa and Solana across multiple dimensions including historical price trends, supply mechanisms, institutional adoption, technical ecosystems, and future projections, attempting to address investors' most pressing question:
"Which is the better buy right now?"
I. Historical Price Comparison and Current Market Status
Historical Price Trends of KAS (Kaspa) and SOL (Solana)
- 2022: Kaspa reached its historical low of $0.00017105 in May, marking its initial market entry phase.
- 2024: Kaspa achieved its all-time high of $0.207411 in August, representing a substantial growth from its launch price.
- 2025: Solana reached its all-time high of $293.31 in January, demonstrating strong market performance during this period.
- 2020: Solana recorded its historical low of $0.500801 in May, during its early development stage.
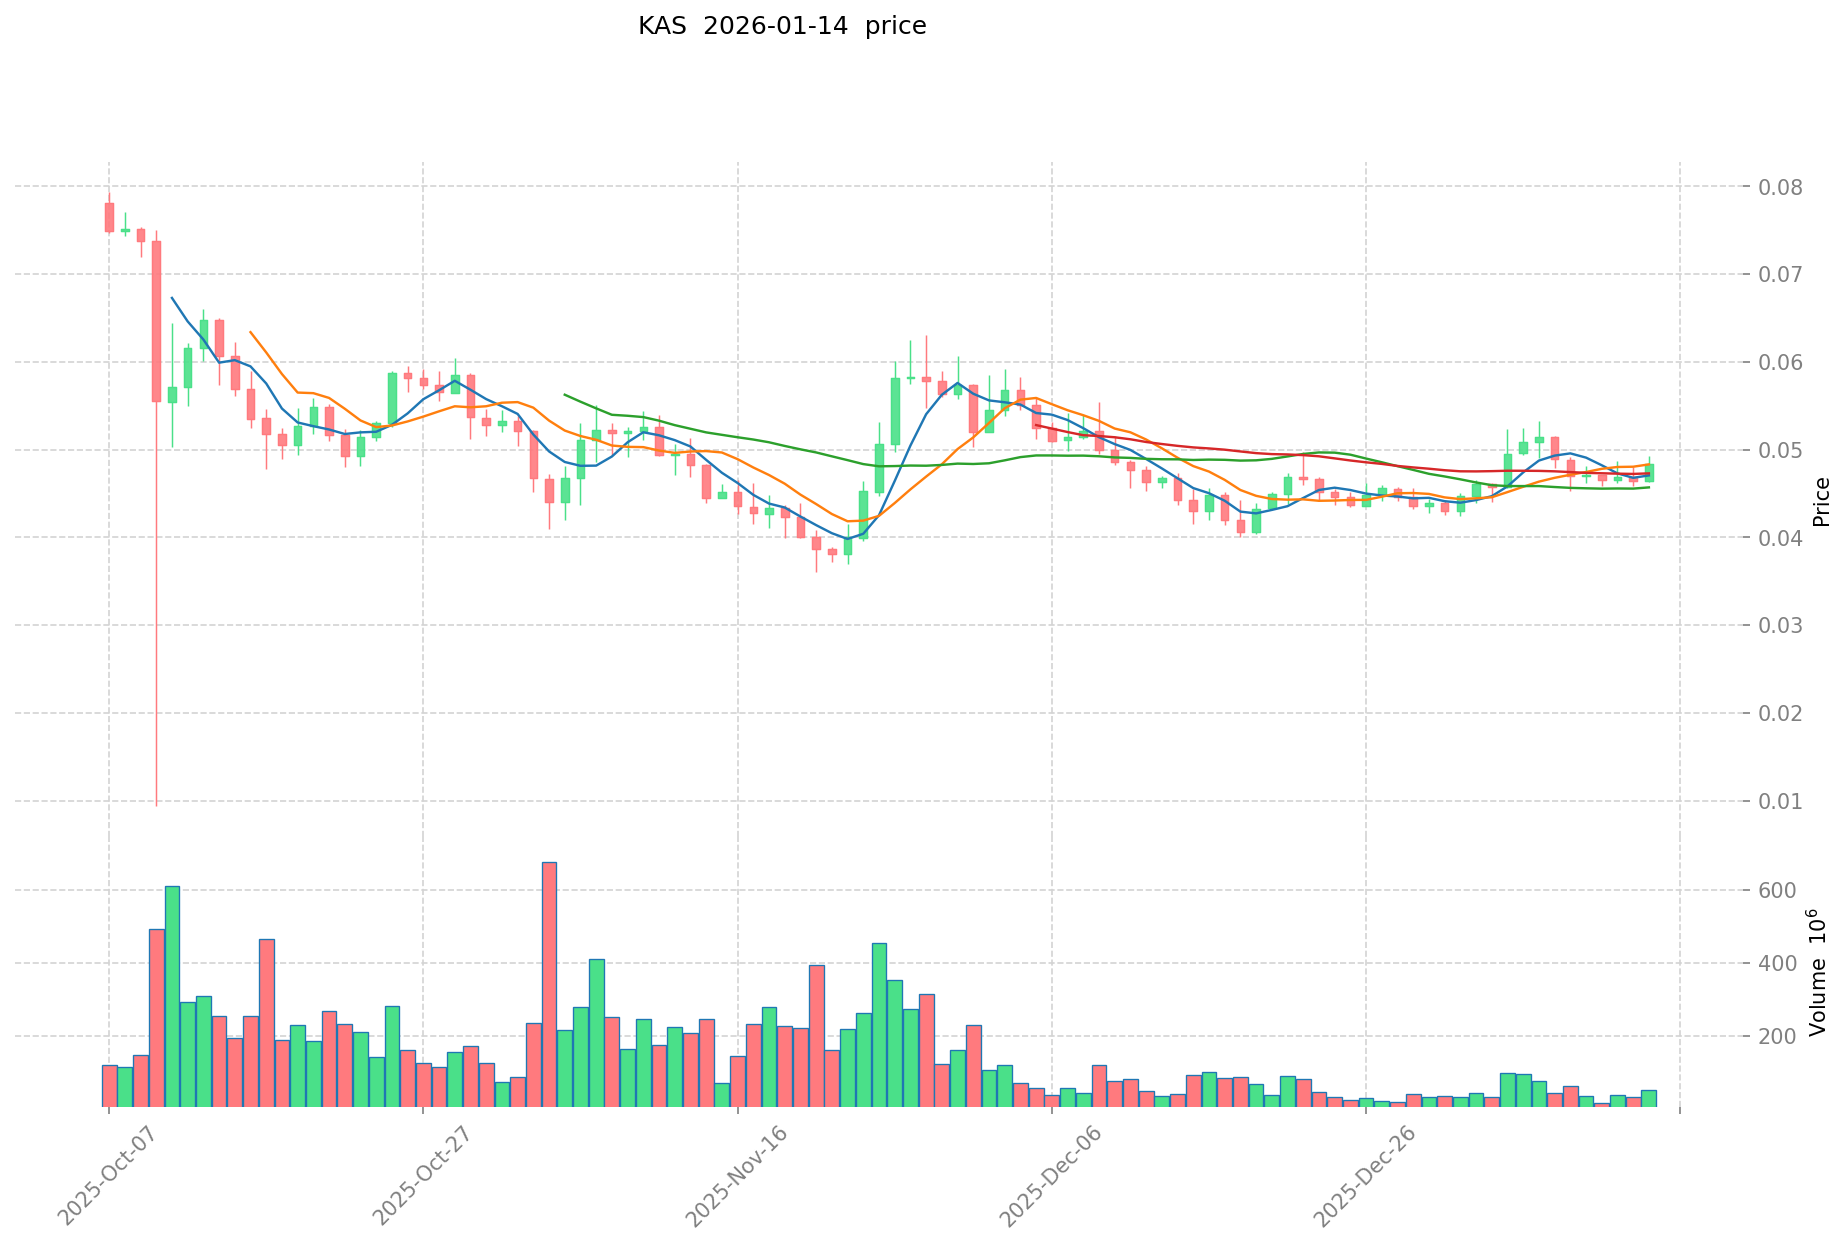
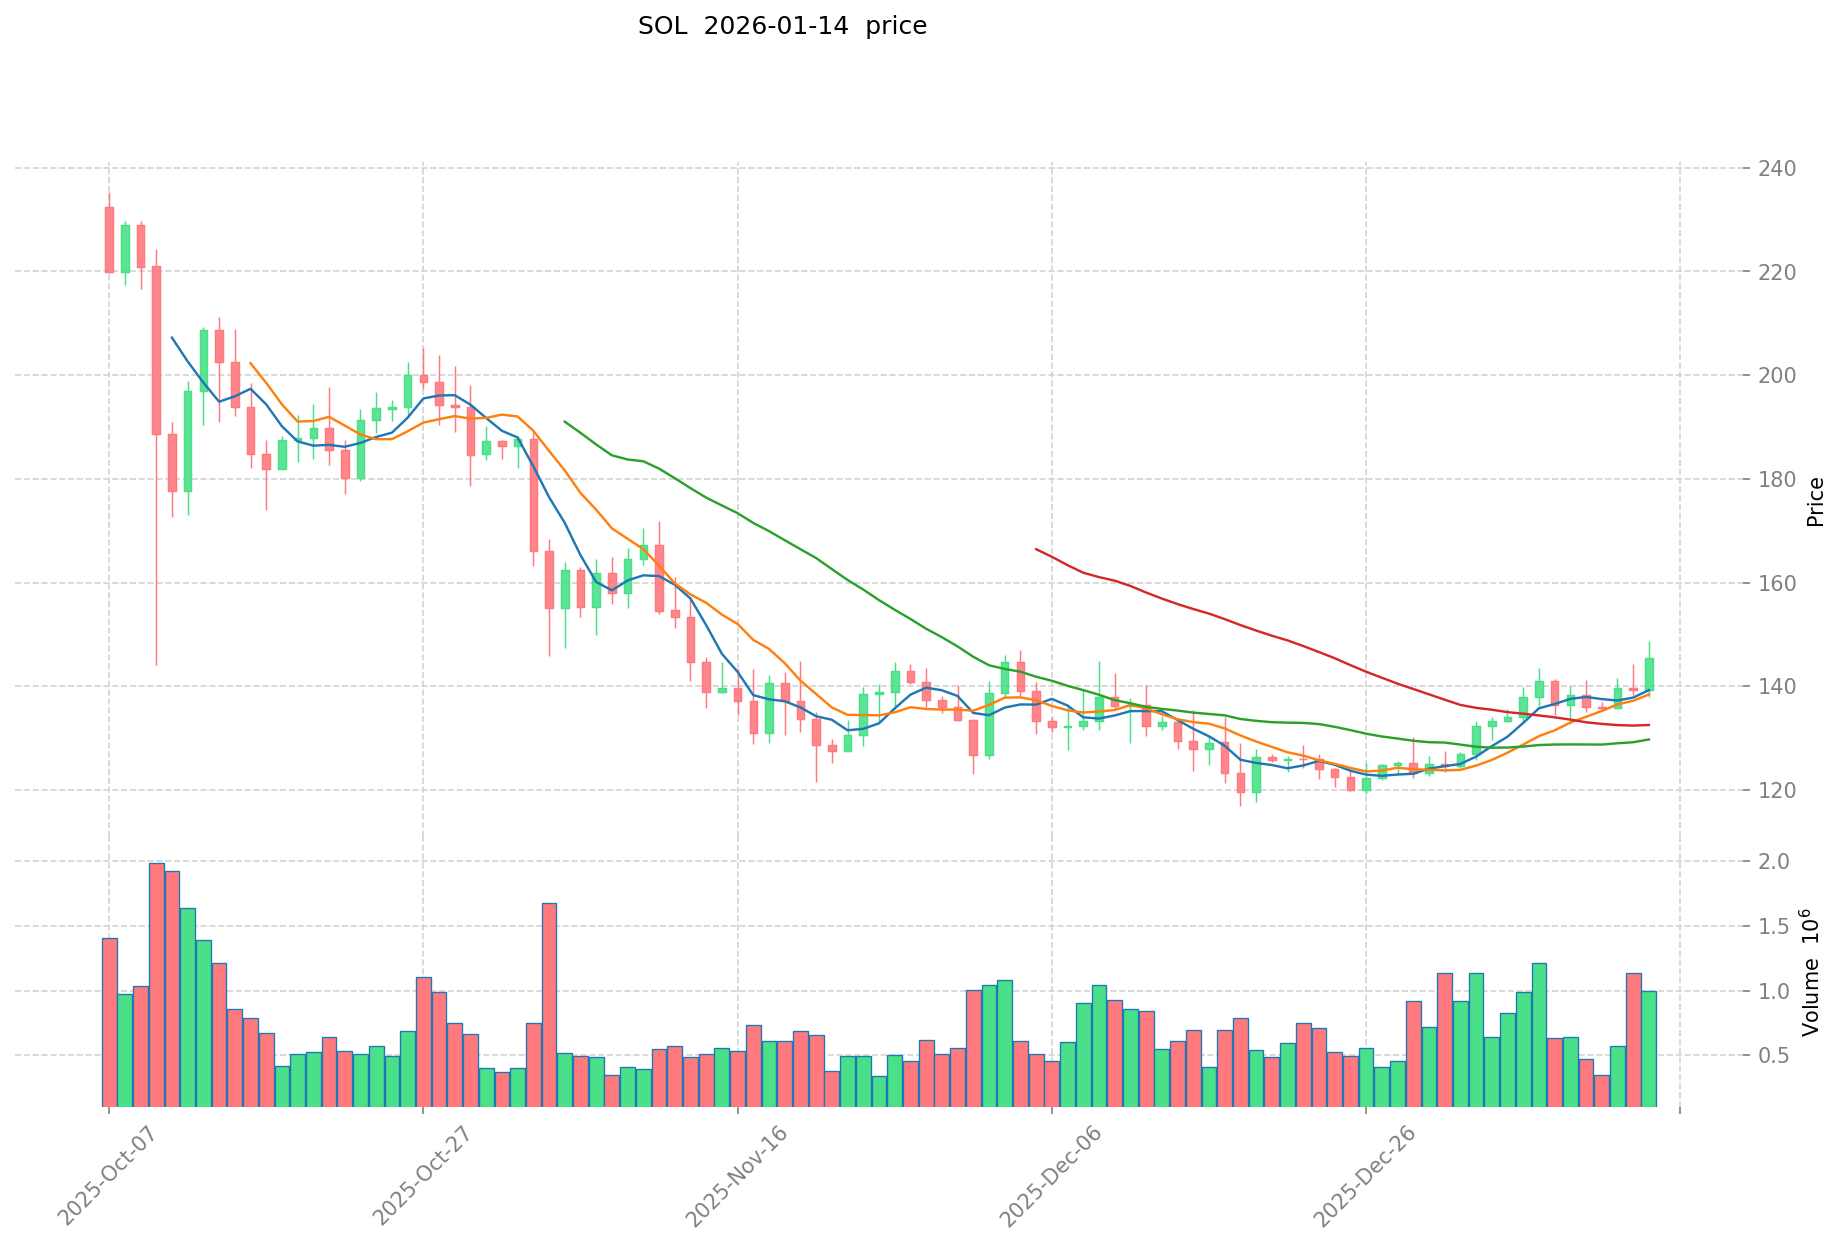
- Comparative Analysis: Throughout the recent market cycle, Kaspa declined from its peak of $0.207411 to the current level of $0.04849, while Solana decreased from $293.31 to $145.66, showing both assets experienced notable corrections from their respective highs.
Current Market Status (2026-01-14)
- KAS Current Price: $0.04849
- SOL Current Price: $145.66
- 24-Hour Trading Volume: KAS $2,488,979.87 vs SOL $142,223,852.55
- Market Sentiment Index (Fear & Greed Index): 26 (Fear)
- KAS 24-Hour Change: +4.4%
- SOL 24-Hour Change: +4.44%
- KAS Market Capitalization: $1,298,423,936
- SOL Market Capitalization: $82,327,220,923
View real-time prices:
II. Core Factors Influencing KAS vs SOL Investment Value
Supply Mechanism Comparison (Tokenomics)
-
KAS: Kaspa follows a Proof-of-Work (PoW) consensus mechanism with a mining reward halving schedule. The protocol is designed with deflationary characteristics where mining rewards decrease over time, making the asset potentially more scarce in the long term. The project adheres to a fair launch principle with no pre-mining, pre-sale, or token allocation to teams or venture capital firms.
-
SOL: Solana operates on a Proof-of-Stake (PoS) consensus model. The network features a staking mechanism where holders can participate in network validation and earn yields. According to available data, staking platforms like Jito offer annual percentage yields around 7.19% for SOL holders who stake their tokens.
-
📌 Historical Pattern: Supply mechanisms have shown influence on price cycles. PoW tokens with halving mechanisms tend to experience increased scarcity over extended periods (10-15 years), potentially covering annual yields above 10% as tokens undergo at least two halving events. Meanwhile, PoS tokens provide ongoing yield opportunities through staking rewards.
Institutional Adoption and Market Application
-
Institutional Holdings: Listed companies have shown interest in both asset categories. SOL Strategies (formerly Cypherpunk Holdings) demonstrates institutional focus on Solana, with the company's stock price experiencing substantial movement from $0.08 to $4.24 over a three-month period. For KAS, institutional interest has been noted among insurance and financial holding platforms seeking long-term holdings of PoW assets.
-
Enterprise Adoption: Insurance companies and financial platforms may find PoW tokens like KAS suitable for long-term investment portfolios. The asset characteristics align with business models requiring multi-year investment horizons with target annual yields between 5-10%. SOL's application extends to decentralized application platforms, with various companies exploring its ecosystem for different use cases.
-
Regulatory Landscape: As cryptocurrency markets move toward increased compliance and broader recognition, the regulatory environment continues to evolve. Both assets operate within frameworks where jurisdictional approaches to digital assets vary.
Technology Development and Ecosystem Building
-
KAS Technology: Kaspa utilizes the GHOSTDAG protocol, which represents an advancement in PoW blockchain scalability. The protocol focuses on high transaction speed and security features. The network emphasizes payment speed, security characteristics, scalability, interactivity, and decentralized governance distribution.
-
SOL Technology: Solana is recognized for high-speed, low-cost transactions, with the network capable of processing thousands of transactions per second (TPS). The platform supports smart contracts and serves as infrastructure for decentralized applications (DApps), enabling developers to build various blockchain-based solutions.
-
Ecosystem Comparison: Solana has developed a more extensive ecosystem in areas including DeFi applications, with established liquidity staking platforms and various protocols. The network has demonstrated capabilities in supporting decentralized applications across multiple sectors. Kaspa's ecosystem development continues to evolve, with community-driven growth and focus on core blockchain functionality.
Macroeconomic Environment and Market Cycles
-
Performance in Different Economic Conditions: PoW assets have shown varying volatility patterns across market cycles. During the period from January to April 2025, price corrections were observed across major cryptocurrencies, with different assets showing varying degrees of volatility. Market dynamics suggest that asset behavior can differ based on market conditions and holder composition.
-
Macroeconomic Factors: Market sentiment plays a role in cryptocurrency price movements. Investor perception of technological innovation and future potential influences price dynamics. Both assets operate within broader cryptocurrency market conditions influenced by various economic factors.
-
Market Adoption Trends: Community support and technological advancement serve as factors in cryptocurrency development. Both KAS and SOL benefit from active communities, though with different approaches—KAS emphasizes fair launch principles and community governance, while SOL focuses on ecosystem development and application-layer innovation.
III. 2026-2031 Price Forecast: KAS vs SOL
Short-term Forecast (2026)
- KAS: Conservative $0.033-$0.049 | Optimistic $0.049-$0.051
- SOL: Conservative $133.81-$145.45 | Optimistic $145.45-$203.63
Mid-term Forecast (2028-2029)
- KAS may enter a gradual accumulation phase, with estimated price range of $0.040-$0.074
- SOL may enter an expansion phase, with estimated price range of $116.24-$246.09
- Key drivers: institutional capital inflows, ETF developments, ecosystem growth
Long-term Forecast (2030-2031)
- KAS: Baseline scenario $0.053-$0.069 | Optimistic scenario $0.077-$0.101
- SOL: Baseline scenario $169.55-$250.88 | Optimistic scenario $272.65-$353.74
View detailed price predictions for KAS and SOL
Disclaimer
KAS:
| Year |
Predicted High Price |
Predicted Average Price |
Predicted Low Price |
Price Change |
| 2026 |
0.0514842 |
0.04857 |
0.0330276 |
0 |
| 2027 |
0.067036314 |
0.0500271 |
0.037020054 |
3 |
| 2028 |
0.07199399961 |
0.058531707 |
0.03980156076 |
20 |
| 2029 |
0.07374702423465 |
0.065262853305 |
0.03458931225165 |
34 |
| 2030 |
0.077150482034505 |
0.069504938769825 |
0.059774247342049 |
43 |
| 2031 |
0.101192240354988 |
0.073327710402165 |
0.052795951489559 |
51 |
SOL:
| Year |
Predicted High Price |
Predicted Average Price |
Predicted Low Price |
Price Change |
| 2026 |
203.63 |
145.45 |
133.814 |
0 |
| 2027 |
212.9388 |
174.54 |
95.997 |
19 |
| 2028 |
230.549886 |
193.7394 |
116.24364 |
33 |
| 2029 |
246.08778588 |
212.144643 |
195.17307156 |
45 |
| 2030 |
272.6482951836 |
229.11621444 |
169.5459986856 |
57 |
| 2031 |
353.743979284638 |
250.8822548118 |
228.302851878738 |
72 |
IV. Investment Strategy Comparison: KAS vs SOL
Long-term vs Short-term Investment Strategies
-
KAS: May appeal to investors focusing on PoW consensus mechanisms and fair launch principles. The asset's deflationary characteristics through mining reward halvings could align with portfolios targeting multi-year horizons. Investors interested in blockchain payment infrastructure and decentralized governance distribution might consider KAS as part of their long-term strategy.
-
SOL: May attract investors seeking exposure to high-performance blockchain infrastructure and DeFi ecosystems. The staking mechanism offering yields around 7.19% provides opportunities for income generation. Investors focusing on smart contract platforms and decentralized application development might find SOL suitable for both short-term trading and long-term holding strategies.
Risk Management and Asset Allocation
-
Conservative Investors: A balanced approach might consider diversification across different blockchain architectures. Conservative portfolios could allocate smaller percentages to emerging PoW assets while maintaining exposure to established PoS platforms. Portfolio construction should account for individual risk tolerance and investment objectives.
-
Aggressive Investors: Higher risk tolerance investors might adjust allocations based on market conditions and growth potential. Aggressive strategies could involve larger positions in assets showing institutional interest and ecosystem development. Position sizing should reflect volatility characteristics and market capitalization differences.
-
Hedging Tools: Risk management approaches may include stablecoin reserves for market downturns, derivatives instruments where available, and cross-asset diversification. Portfolio rebalancing schedules and stop-loss considerations form part of comprehensive risk management frameworks.
V. Potential Risk Comparison
Market Risk
-
KAS: Price volatility has been observed, with the asset declining from $0.207411 to current levels of $0.04849. Market capitalization of approximately $1.3 billion places it in a different liquidity profile compared to larger-cap assets. Trading volume of $2.49 million in 24 hours suggests lower liquidity compared to major cryptocurrencies, which may impact execution during market movements.
-
SOL: Market fluctuations have shown price movement from $293.31 to $145.66. With market capitalization around $82.3 billion and 24-hour trading volume of $142.2 million, the asset demonstrates higher liquidity. However, exposure to broader cryptocurrency market cycles and sentiment shifts remains a consideration for investors.
Technical Risk
-
KAS: The GHOSTDAG protocol represents newer technology in the PoW space. Network performance during periods of high transaction demand and long-term scalability implementation represent areas for ongoing monitoring. The ecosystem's development stage compared to more established blockchains is a factor in technical risk assessment.
-
SOL: Network stability has been a discussion point in blockchain communities. The high-speed architecture's performance during peak usage periods and potential technical challenges associated with maintaining thousands of transactions per second require consideration. Smart contract security and platform upgrades form part of the technical risk landscape.
Regulatory Risk
- Global Regulatory Environment: Different jurisdictions maintain varying approaches to digital asset classification. PoW assets face discussions around energy consumption and environmental considerations in certain regions. PoS mechanisms encounter different regulatory frameworks related to staking and yield generation. Both assets operate within evolving regulatory landscapes where policy developments could influence market dynamics and institutional adoption patterns.
VI. Conclusion: Which Is the Better Buy?
📌 Investment Value Summary
-
KAS Characteristics: Fair launch approach without pre-mining or venture capital allocation, deflationary supply mechanism through mining reward halvings, focus on payment speed and decentralized governance, PoW consensus with GHOSTDAG protocol implementation, community-driven development model.
-
SOL Characteristics: Established high-performance blockchain infrastructure, extensive DeFi ecosystem with various applications, staking mechanism providing yield opportunities around 7.19%, smart contract capabilities supporting decentralized applications, higher market capitalization and trading liquidity compared to KAS.
✅ Investment Considerations
-
New Investors: Market entry should involve careful research into blockchain technology fundamentals and risk assessment. Starting with smaller position sizes while learning about different consensus mechanisms and ecosystem characteristics may be appropriate. Understanding market volatility and maintaining long-term perspectives forms part of investment education.
-
Experienced Investors: Portfolio construction might consider diversification across different blockchain architectures and consensus mechanisms. Evaluation of technical development progress, ecosystem growth metrics, and institutional adoption trends could inform allocation decisions. Risk management through position sizing and rebalancing schedules remains important.
-
Institutional Investors: Due diligence processes should examine regulatory compliance frameworks, custody solutions, and liquidity profiles. Assessment of long-term technological viability, network security characteristics, and alignment with investment mandates forms part of institutional evaluation. Multi-year investment horizons and risk-adjusted return expectations guide strategic allocation decisions.
⚠️ Risk Disclosure: Cryptocurrency markets demonstrate high volatility. This analysis does not constitute investment advice. Investors should conduct independent research and consider their financial situation, risk tolerance, and investment objectives before making decisions.
VII. FAQ
Q1: What are the main differences between KAS and SOL's consensus mechanisms?
KAS uses Proof-of-Work (PoW) with the GHOSTDAG protocol, while SOL operates on delegated Proof-of-Stake (PoS). KAS follows a fair launch model with no pre-mining and features a deflationary supply through mining reward halvings, making it potentially more scarce over time. SOL enables token holders to stake their assets and earn yields around 7.19% annually, providing passive income opportunities while securing the network through validation.
Q2: Which asset offers better liquidity for trading?
SOL provides significantly higher liquidity with $142.2 million in 24-hour trading volume and $82.3 billion market capitalization, compared to KAS's $2.49 million volume and $1.3 billion market cap. This substantial difference means SOL offers easier entry and exit for larger positions with less price slippage, while KAS's lower liquidity may present execution challenges during volatile market conditions, particularly for investors managing substantial positions.
Q3: What are the projected returns for long-term investors (2030-2031)?
Based on baseline scenarios, KAS is projected to reach $0.053-$0.069 by 2030-2031, representing potential growth from current levels of $0.04849. SOL is projected to reach $169.55-$250.88 in the same timeframe from its current price of $145.66. In optimistic scenarios, KAS could reach $0.077-$0.101, while SOL might achieve $272.65-$353.74. These projections depend on ecosystem development, institutional adoption, and broader market conditions.
Q4: Can I earn passive income from holding these assets?
Yes, but through different mechanisms. SOL offers direct passive income through staking, with current yields around 7.19% annually on platforms like Jito, allowing holders to earn rewards while participating in network validation. KAS does not offer staking yields as a PoW asset, but its deflationary mechanism through mining halvings may provide value appreciation potential over multi-year horizons as supply becomes increasingly scarce.
Q5: What are the key risk factors investors should consider?
Market risk includes price volatility—KAS declined from $0.207411 to $0.04849, while SOL dropped from $293.31 to $145.66 from their respective peaks. Technical risk involves KAS's newer GHOSTDAG protocol requiring ongoing monitoring and SOL's network stability during high-demand periods. Regulatory risk affects both assets differently: PoW assets face energy consumption discussions, while PoS mechanisms encounter frameworks related to staking and yield generation. Both operate in evolving regulatory environments where policy changes could impact adoption.
Q6: Which asset is more suitable for institutional investors?
Both assets serve different institutional objectives. SOL's higher liquidity ($82.3 billion market cap), established DeFi ecosystem, and smart contract capabilities make it suitable for institutions seeking exposure to high-performance blockchain infrastructure. KAS may appeal to institutions focusing on PoW assets for long-term portfolios with 10-15 year horizons, aligning with business models targeting 5-10% annual yields through deflationary characteristics. Institutional choice depends on investment mandates, risk tolerance, and strategic allocation goals.
Q7: How do ecosystem developments compare between KAS and SOL?
SOL has developed an extensive ecosystem with various DeFi applications, liquidity staking platforms, and decentralized applications across multiple sectors, demonstrating capabilities in supporting thousands of transactions per second. KAS's ecosystem continues to evolve with community-driven growth, focusing on core blockchain functionality including payment speed, security features, and decentralized governance. SOL's more mature ecosystem provides broader application opportunities, while KAS emphasizes fair launch principles and foundational infrastructure development.
Q8: What investment strategy is recommended for beginners?
Beginners should start with smaller position sizes while learning about different consensus mechanisms and ecosystem characteristics. A balanced approach might include diversification across both PoW and PoS assets, with consideration for risk tolerance and investment objectives. Understanding market volatility and maintaining long-term perspectives is crucial. Conservative portfolios could allocate smaller percentages to emerging assets like KAS while maintaining exposure to established platforms like SOL. Independent research into blockchain fundamentals and risk assessment should precede any investment decisions.
* The information is not intended to be and does not constitute financial advice or any other recommendation of any sort offered or endorsed by Gate.