This comprehensive guide compares KAVA and HBAR, two leading enterprise blockchain solutions for cryptocurrency investors. KAVA, a cross-chain DeFi platform launched in 2019, currently trades at $0.09122 with a market cap of $98.77 million, while HBAR maintains stronger market presence at $0.11834 with $5.06 billion capitalization on Gate. The article examines historical price trends from 2021 peaks, analyzes tokenomics and institutional adoption, and provides price forecasts through 2031. It details investment strategies for conservative, moderate, and aggressive investors, assesses market and regulatory risks unique to each platform, and offers tailored guidance for beginning, experienced, and institutional investors making informed decisions on Gate exchange.
Introduction: Investment Analysis of KAVA – Value, Price Prediction, and Risk Assessment
In the cryptocurrency market, KAVA has attracted attention as a cross-chain decentralized finance (DeFi) platform. As a Layer 1 blockchain supporting DeFi applications and services, KAVA aims to provide threshold-free financial infrastructure for developers and users.
KAVA: Launched in October 2019, KAVA positions itself as a cross-chain DeFi hub that offers collateralized lending services for mainstream digital assets (BTC, XRP, BNB, ATOM, etc.) and stablecoin issuance. The platform features two types of tokens: KAVA serves as the platform's governance and staking token, while USDX functions as a stablecoin backed by digital asset collateral.
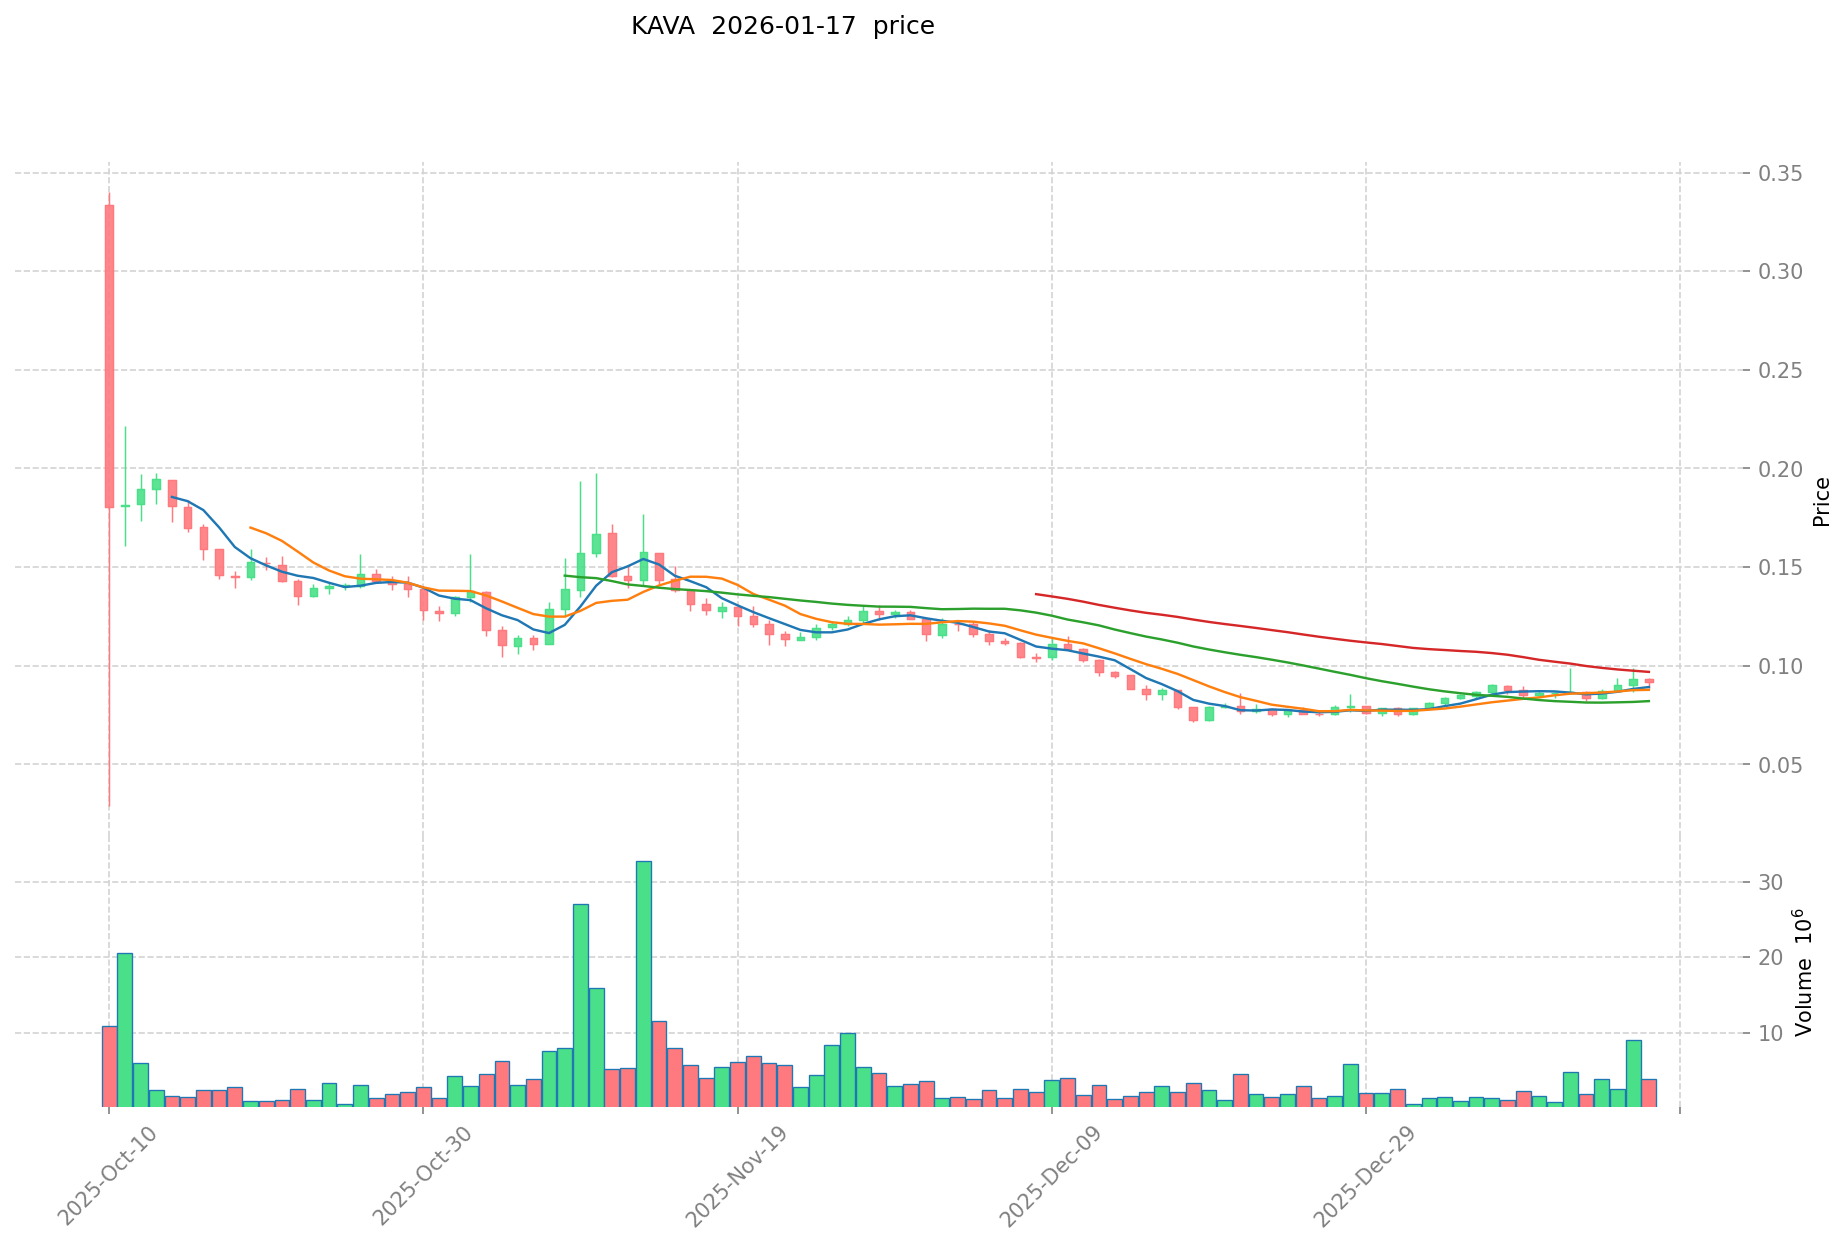
As of January 17, 2026, KAVA is ranked 359th by market capitalization, with a current price of $0.09122 and a circulating supply of 1,082,847,624 tokens. The token has experienced notable price fluctuations, with a 30-day increase of 19.65% but a one-year decline of 81.78%.
This article will provide a comprehensive analysis of KAVA's investment value through examining its historical price performance, supply mechanism, technical ecosystem development, and future outlook. We aim to address key questions that investors commonly consider:
"What are the potential investment opportunities and risks associated with KAVA?"
I. Historical Price Comparison and Current Market Status
KAVA and HBAR Historical Price Trends
- 2021: KAVA reached a notable price level of $9.12 in August 2021, representing a significant peak during the crypto market expansion cycle.
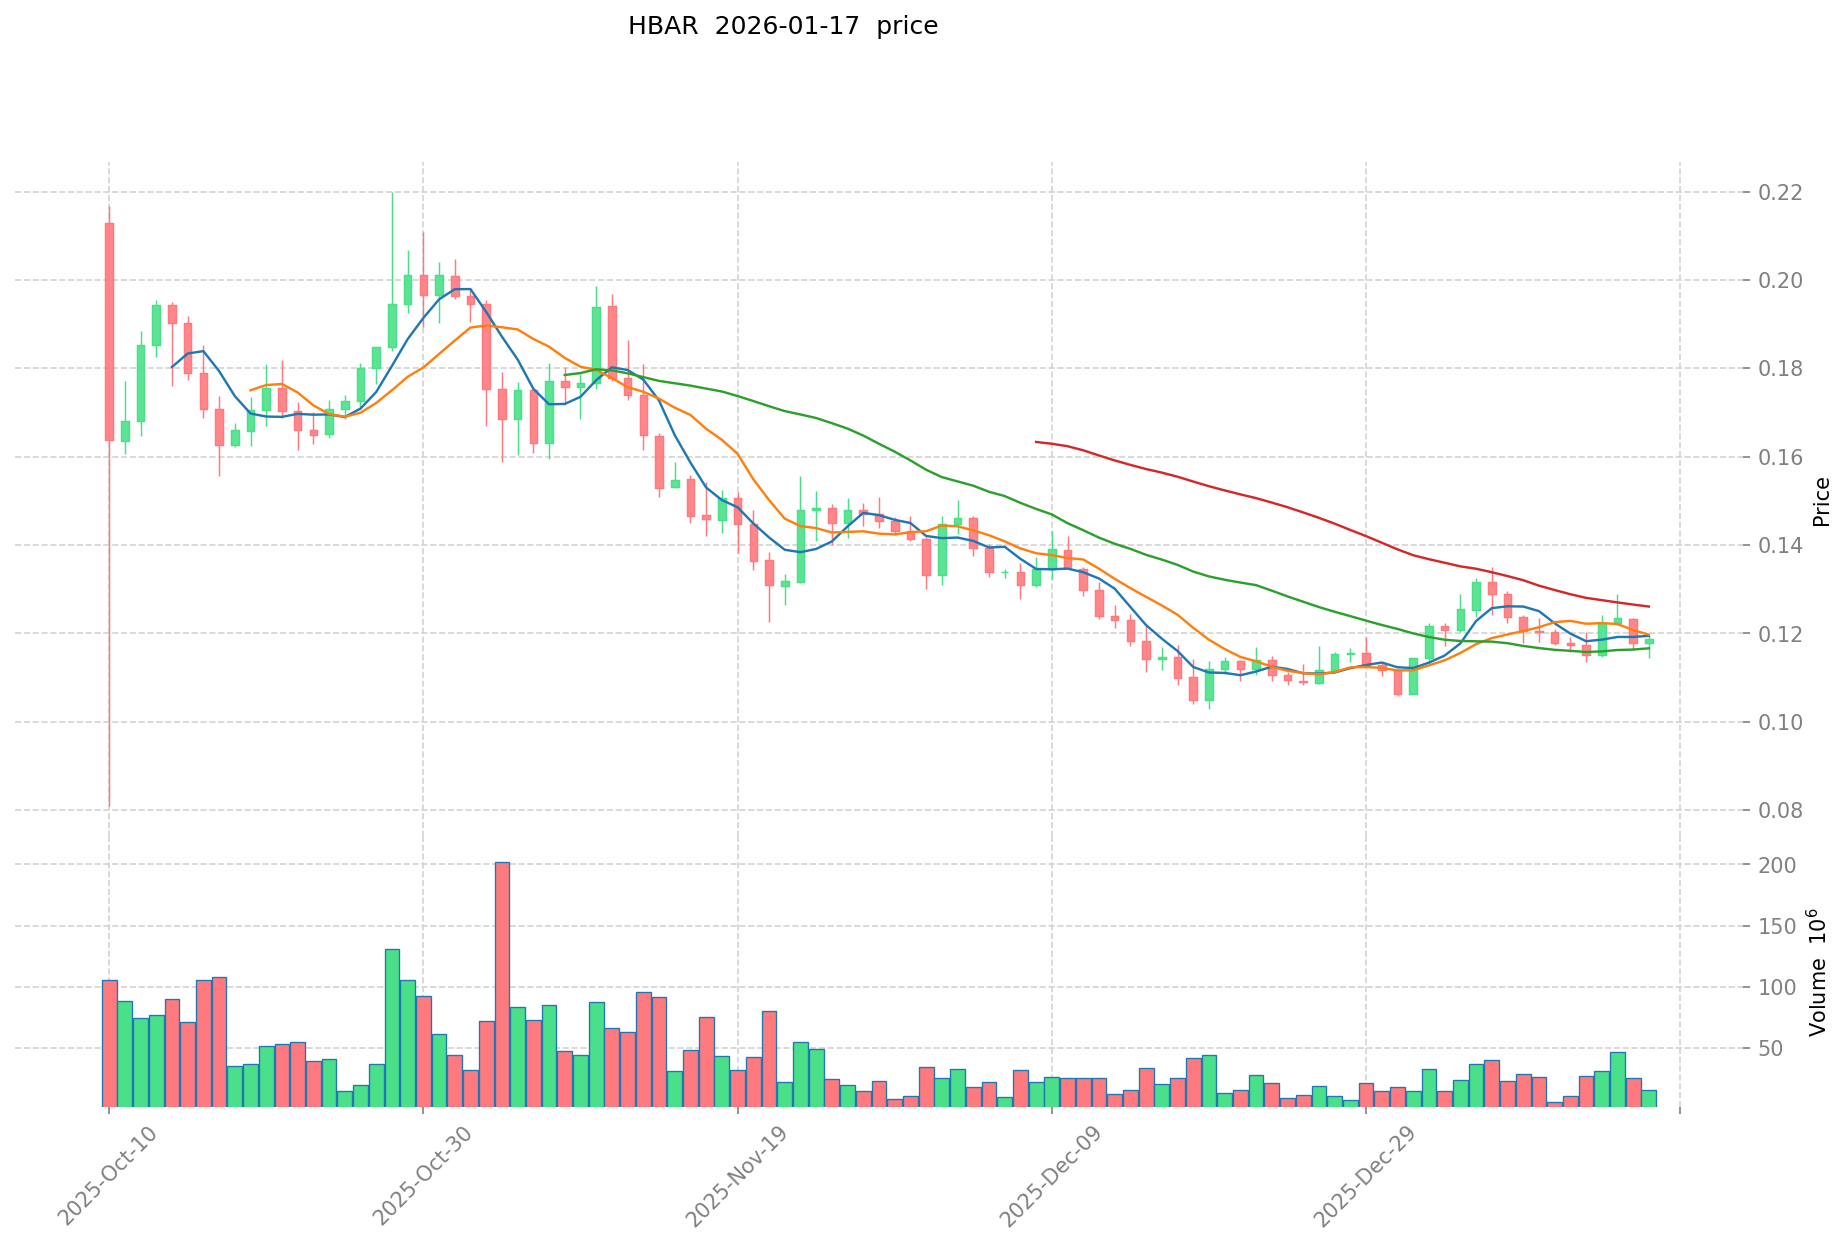
- 2021: HBAR experienced substantial growth reaching $0.569229 in September 2021, reflecting increased adoption and network activity.
- 2020: HBAR recorded its lowest price point at $0.00986111 in January 2020, during the early stages of network development.
- 2025: KAVA declined to $0.071579 in December 2025, marking a period of market adjustment.
- Comparative Analysis: During the 2021-2026 market cycle, KAVA declined from its peak of $9.12 to the current level of $0.09122, representing substantial price compression. HBAR experienced a similar pattern, declining from $0.569229 to $0.11834, though showing relatively stronger price retention from its historical peak.
Current Market Status (2026-01-17)
- KAVA Current Price: $0.09122
- HBAR Current Price: $0.11834
- 24-Hour Trading Volume: KAVA $219,013.78 vs HBAR $1,728,348.41
- 24-Hour Price Change: KAVA -1.8% vs HBAR +0.74%
- Market Capitalization: KAVA $98,777,360.26 vs HBAR $5,064,286,200.55
- Circulating Supply: KAVA 1,082,847,624 tokens vs HBAR 42,794,373,842.77 tokens
- Market Sentiment Index (Fear & Greed Index): 50 (Neutral)
View real-time prices:
II. Core Factors Influencing KAVA vs HBAR Investment Value
Supply Mechanism Comparison (Tokenomics)
- KAVA: The reference materials mention KAVA's technological innovation and market sentiment as growth drivers, though specific supply mechanism details are not provided in the available sources.
- HBAR: Supply mechanism information is not available in the provided materials.
- 📌 Historical Pattern: Supply mechanisms can influence price cycles through scarcity dynamics and token distribution models, though specific historical data for these assets is not detailed in the sources.
Institutional Adoption and Market Applications
- Institutional Holdings: The provided materials do not contain comparative data on institutional preference between KAVA and HBAR.
- Enterprise Adoption: Specific applications in cross-border payments, settlements, or investment portfolios for either KAVA or HBAR are not detailed in the reference materials.
- National Policy: The materials note that regulatory environments play important roles in cryptocurrency markets generally, but do not provide specific policy comparisons for these two assets.
Technology Development and Ecosystem Building
- KAVA Technology: The materials indicate that KAVA is recognized for its technological innovation and strategic partnerships, which contribute to its market potential.
- HBAR Technology: Similar to KAVA, HBAR is mentioned as having growth potential due to its unique features and ecosystem developments.
- Ecosystem Comparison: The reference materials suggest both projects have ongoing ecosystem development, though specific details regarding DeFi, NFT, payment systems, or smart contract implementations are not provided.
Macroeconomic Factors and Market Cycles
- Performance During Inflation: The materials do not provide specific comparative data on inflation-hedging characteristics for either asset.
- Macroeconomic Monetary Policy: The sources note that cryptocurrency prices are influenced by sentiment-driven speculation and broader economic factors, though specific impacts of interest rates or dollar index movements on KAVA and HBAR are not detailed.
- Geopolitical Factors: While the materials acknowledge that international situations can affect cryptocurrency markets, specific impacts on cross-border transaction demand for these particular assets are not documented in the provided sources.
III. 2026-2031 Price Prediction: KAVA vs HBAR
Short-term Forecast (2026)
- KAVA: Conservative $0.0656 - $0.0912 | Optimistic $0.0912 - $0.1176
- HBAR: Conservative $0.0996 - $0.1186 | Optimistic $0.1186 - $0.1459
Mid-term Forecast (2028-2029)
- KAVA may enter a consolidation phase with projected range of $0.1052 - $0.1697 in 2028, potentially extending to $0.0868 - $0.1663 in 2029
- HBAR may enter an expansion phase with projected range of $0.1515 - $0.2190 in 2028, potentially reaching $0.1266 - $0.2264 in 2029
- Key drivers: institutional capital inflows, ETF developments, ecosystem growth
Long-term Forecast (2030-2031)
- KAVA: Baseline scenario $0.1306 - $0.1555 (2030) | Optimistic scenario $0.1348 - $0.1840 (2031)
- HBAR: Baseline scenario $0.1464 - $0.2091 (2030) | Optimistic scenario $0.1788 - $0.2564 (2031)
View detailed price predictions for KAVA and HBAR
Disclaimer: Price predictions are based on historical data analysis and market modeling. Cryptocurrency markets are highly volatile and subject to numerous unpredictable factors. These forecasts should not be considered as investment advice. Always conduct thorough research and consult with financial professionals before making investment decisions.
KAVA:
| Year |
Predicted High Price |
Predicted Average Price |
Predicted Low Price |
Price Change |
| 2026 |
0.1176222 |
0.09118 |
0.0656496 |
0 |
| 2027 |
0.134677419 |
0.1044011 |
0.055332583 |
14 |
| 2028 |
0.16974574849 |
0.1195392595 |
0.10519454836 |
31 |
| 2029 |
0.16633887959425 |
0.144642503995 |
0.086785502397 |
58 |
| 2030 |
0.16171031946641 |
0.155490691794625 |
0.130612181107485 |
70 |
| 2031 |
0.1839765865314 |
0.158600505630517 |
0.134810429785939 |
73 |
HBAR:
| Year |
Predicted High Price |
Predicted Average Price |
Predicted Low Price |
Price Change |
| 2026 |
0.1459149 |
0.11863 |
0.0996492 |
0 |
| 2027 |
0.1970859505 |
0.13227245 |
0.07936347 |
11 |
| 2028 |
0.2190233363325 |
0.16467920025 |
0.15150486423 |
39 |
| 2029 |
0.226384496583675 |
0.19185126829125 |
0.126621837072225 |
62 |
| 2030 |
0.261397353046828 |
0.209117882437462 |
0.146382517706223 |
76 |
| 2031 |
0.256430803338938 |
0.235257617742145 |
0.17879578948403 |
98 |
IV. Investment Strategy Comparison: KAVA vs HBAR
Long-term vs Short-term Investment Strategies
- KAVA: May appeal to investors interested in cross-chain DeFi infrastructure development and platform governance participation. The token's historical volatility patterns suggest it may experience notable price movements during different market cycles.
- HBAR: May appeal to investors seeking exposure to distributed ledger technology applications and enterprise-focused blockchain solutions. The token's relatively larger market capitalization suggests a different risk-return profile compared to smaller-cap alternatives.
Risk Management and Asset Allocation
- Conservative Investors: KAVA 30% vs HBAR 70% - This allocation reflects HBAR's larger market presence and established network, which may provide relatively more stability.
- Aggressive Investors: KAVA 60% vs HBAR 40% - Higher allocation to KAVA may reflect potential for greater price movement, though this comes with increased volatility exposure.
- Hedging Tools: Stablecoin allocation for portfolio balance, derivative instruments for risk mitigation, cross-asset diversification strategies
V. Potential Risk Comparison
Market Risk
- KAVA: The token has experienced substantial price compression from its 2021 peak, with an 81.78% decline over the past year as of January 2026. Market capitalization of approximately $98.77 million indicates relatively lower liquidity compared to larger cryptocurrency projects.
- HBAR: While also experiencing price decline from historical peaks, HBAR maintains a significantly larger market capitalization of approximately $5.06 billion, suggesting different liquidity characteristics and market depth.
Technical Risk
- KAVA: As a cross-chain DeFi platform, operational considerations include network scalability requirements and cross-chain bridge security. The platform's dual-token model (KAVA and USDX) introduces additional technical complexity.
- HBAR: Technical risk factors may include network performance considerations and ecosystem development dependencies, though specific technical vulnerabilities are not detailed in the available materials.
Regulatory Risk
- Both assets operate in evolving regulatory environments across different jurisdictions. DeFi platforms like KAVA may face scrutiny related to lending services and stablecoin operations, while enterprise-focused networks may encounter different regulatory considerations related to their specific use cases and institutional partnerships.
VI. Conclusion: Which Is the Better Buy?
📌 Investment Value Summary:
- KAVA Characteristics: Cross-chain DeFi platform positioning, governance token functionality, collateralized lending infrastructure. The token has demonstrated significant price volatility with both substantial gains during market uptrends and notable declines during corrections.
- HBAR Characteristics: Larger market capitalization suggesting more established market presence, relatively higher trading volume indicating better liquidity conditions, different technological approach to distributed ledger applications.
✅ Investment Considerations:
- Beginning Investors: Consider starting with smaller position sizes in either asset, prioritizing understanding of the underlying technology and market dynamics before increasing exposure. Diversification across multiple assets and asset classes may help manage overall portfolio risk.
- Experienced Investors: May evaluate these assets within a broader cryptocurrency portfolio strategy, considering factors such as correlation with other holdings, market cycle positioning, and risk-adjusted return expectations. Technical analysis and fundamental research can inform position sizing decisions.
- Institutional Investors: May assess these assets based on specific institutional mandates, regulatory compliance requirements, liquidity needs, and strategic allocation frameworks. Due diligence on custody solutions, counterparty risks, and operational infrastructure is recommended.
⚠️ Risk Disclosure: Cryptocurrency markets exhibit high volatility and are subject to numerous unpredictable factors including regulatory changes, technological developments, market sentiment shifts, and macroeconomic conditions. This analysis does not constitute investment advice, and all investment decisions should be made based on individual circumstances, risk tolerance, and thorough independent research. Past performance does not guarantee future results.
VII. FAQ
Q1: What is KAVA and how does it differ from traditional cryptocurrencies?
KAVA is a cross-chain decentralized finance (DeFi) platform launched in October 2019 that functions as a Layer 1 blockchain. Unlike traditional single-purpose cryptocurrencies, KAVA serves as a DeFi hub offering collateralized lending services for mainstream digital assets (BTC, XRP, BNB, ATOM, etc.) and stablecoin issuance. The platform features a dual-token model: KAVA serves as the governance and staking token, while USDX functions as a stablecoin backed by digital asset collateral. This architecture enables KAVA to provide threshold-free financial infrastructure for developers and users, positioning it as a comprehensive DeFi ecosystem rather than just a payment or store-of-value token.
Q2: Why has KAVA's price declined significantly from its 2021 peak?
KAVA reached $9.12 in August 2021 but has declined to $0.09122 as of January 2026, representing substantial price compression of approximately 99%. This decline reflects the broader cryptocurrency market correction following the 2021 bull cycle, with KAVA experiencing an 81.78% decline over the past year alone. The price movement is influenced by multiple factors including market-wide sentiment shifts, changes in capital flows away from DeFi platforms, broader macroeconomic conditions, and the natural volatility cycles characteristic of cryptocurrency markets. This pattern is not unique to KAVA—many cryptocurrency assets experienced similar declines from their 2021 peaks during the subsequent market adjustment period.
Q3: What are the key differences between investing in KAVA versus HBAR?
KAVA and HBAR represent different blockchain approaches and investment profiles. KAVA focuses on cross-chain DeFi infrastructure with collateralized lending and stablecoin services, operating with a market capitalization of approximately $98.77 million and 24-hour trading volume of $219,013.78. HBAR maintains a significantly larger market presence with a market capitalization of approximately $5.06 billion and 24-hour trading volume of $1,728,348.41, suggesting different liquidity characteristics and market depth. KAVA may appeal to investors interested in DeFi platform development and governance participation, while HBAR may attract those seeking exposure to enterprise-focused distributed ledger technology. The reference materials suggest conservative investors might consider a 30% KAVA / 70% HBAR allocation, while aggressive investors might pursue 60% KAVA / 40% HBAR, reflecting KAVA's higher volatility potential.
Q4: What is KAVA's price forecast for 2026-2031?
According to the predictive models based on historical data analysis, KAVA's price projections vary across different timeframes. For 2026, the conservative forecast ranges from $0.0656 to $0.0912, while the optimistic scenario projects $0.0912 to $0.1176. Mid-term forecasts for 2028-2029 suggest a consolidation phase with ranges of $0.1052 to $0.1697 (2028) and $0.0868 to $0.1663 (2029). Long-term projections for 2030-2031 indicate baseline scenarios of $0.1306 to $0.1555 (2030) and optimistic scenarios of $0.1348 to $0.1840 (2031). However, these predictions are based on modeling and historical patterns—cryptocurrency markets are highly volatile and subject to numerous unpredictable factors including regulatory changes, technological developments, and macroeconomic conditions. These forecasts should not be considered investment advice.
Q5: What are the primary risks associated with investing in KAVA?
KAVA investment carries multiple risk categories that investors should consider. Market risk is evidenced by the token's 81.78% decline over the past year and relatively lower liquidity with a market capitalization of approximately $98.77 million compared to larger cryptocurrency projects. Technical risk stems from KAVA's cross-chain DeFi platform architecture, including network scalability requirements, cross-chain bridge security considerations, and the complexity of its dual-token model (KAVA and USDX). Regulatory risk exists due to evolving cryptocurrency regulations across jurisdictions, with DeFi platforms potentially facing scrutiny related to lending services and stablecoin operations. Additionally, the cryptocurrency market exhibits high volatility influenced by sentiment-driven speculation, institutional capital flows, macroeconomic conditions, and technological developments—all factors that can significantly impact KAVA's price performance.
Q6: How should different types of investors approach KAVA investment?
Investment approaches should align with investor experience and risk tolerance levels. Beginning investors are advised to start with smaller position sizes in KAVA, prioritizing understanding of the underlying DeFi technology and market dynamics before increasing exposure, while maintaining diversification across multiple assets and asset classes. Experienced investors may evaluate KAVA within a broader cryptocurrency portfolio strategy, considering factors such as correlation with other holdings, market cycle positioning, and risk-adjusted return expectations, utilizing technical analysis and fundamental research for position sizing decisions. Institutional investors should assess KAVA based on specific institutional mandates, regulatory compliance requirements, liquidity needs, and strategic allocation frameworks, conducting thorough due diligence on custody solutions, counterparty risks, and operational infrastructure. Regardless of experience level, all investors should recognize that this analysis does not constitute investment advice and decisions should be based on individual circumstances and independent research.
Q7: What factors could drive KAVA's future price performance?
Several key drivers may influence KAVA's future price trajectory according to the reference materials. Technological innovation and strategic partnerships are recognized as important growth contributors for the platform. Ecosystem development, including expansion of DeFi applications and services built on KAVA's infrastructure, could increase platform utility and token demand. Market sentiment and broader cryptocurrency market cycles play significant roles, as evidenced by KAVA's historical correlation with market-wide movements. Institutional capital inflows and potential ETF developments in the cryptocurrency space could provide additional momentum. The platform's cross-chain capabilities and collateralized lending services may attract users seeking DeFi infrastructure. However, these potential drivers must be weighed against ongoing market volatility, regulatory uncertainties, competitive pressures from other DeFi platforms, and macroeconomic conditions that affect risk asset valuations globally.
Q8: How does KAVA's dual-token model (KAVA and USDX) function?
KAVA operates with a dual-token architecture designed to support its DeFi ecosystem functionality. The KAVA token serves as the platform's governance and staking token, enabling holders to participate in network decision-making processes and earn staking rewards by securing the network. USDX functions as a stablecoin backed by digital asset collateral, providing a stable medium of exchange and unit of account within the ecosystem. This structure allows the platform to offer collateralized lending services for mainstream digital assets (BTC, XRP, BNB, ATOM, etc.) while maintaining stability through USDX. Users can collateralize their digital assets to mint USDX, creating a decentralized lending and borrowing environment. The dual-token model aims to separate governance and utility functions (KAVA) from stable value functions (USDX), though this complexity introduces additional technical considerations and operational dynamics that investors should understand.
* The information is not intended to be and does not constitute financial advice or any other recommendation of any sort offered or endorsed by Gate.