This comprehensive comparison analyzes Kadena (KDA) and Hedera (HBAR) as Layer-1 blockchain solutions for enterprise applications. KDA employs proof-of-work consensus with enterprise-focused smart contract capabilities, currently trading at $0.008573. HBAR utilizes hashgraph technology delivering 10,000+ TPS with aBFT security, trading at $0.09862 on Gate. The analysis examines historical price trends, tokenomics differences, institutional adoption patterns, and technical architectures. HBAR demonstrates superior price resilience and trading volume ($3.9M vs $29K daily), while KDA focuses on traditional blockchain infrastructure. Investment strategies differentiate conservative allocations favoring HBAR (60-70%) against aggressive positioning (50-60% KDA). Both assets present distinct risk profiles influenced by regulatory frameworks, network maturation, and macroeconomic conditions, with growth potential through 2031 ranging 44-86% depending on adoption trajectories and market cycles.
Introduction: Investment Comparison Between KDA and HBAR
In the cryptocurrency market, the comparison between KDA vs HBAR has consistently been a topic that investors cannot avoid. Both show notable differences in market cap ranking, application scenarios, and price performance, representing distinct crypto asset positioning.
Kadena (KDA): Launched in 2020, it has gained market recognition by positioning itself as a leader in distributed digital ledger technology with an industry-leading secure, scalable platform and simplified smart contract language designed to help institutions improve efficiency through blockchain.
Hedera (HBAR): Since its launch in 2020, it has been recognized for its hashgraph consensus mechanism, offering fast (>10,000+ TPS), secure (aBFT), and fair public ledger network capabilities. HBAR serves as the native cryptocurrency for the Hedera public network, supporting decentralized applications and protecting the network from malicious attacks.
This article will comprehensively analyze the investment value comparison of KDA vs HBAR around historical price trends, supply mechanisms, institutional adoption, technical ecosystems, and future predictions, attempting to answer the question investors care about most:
"Which is the better buy right now?"
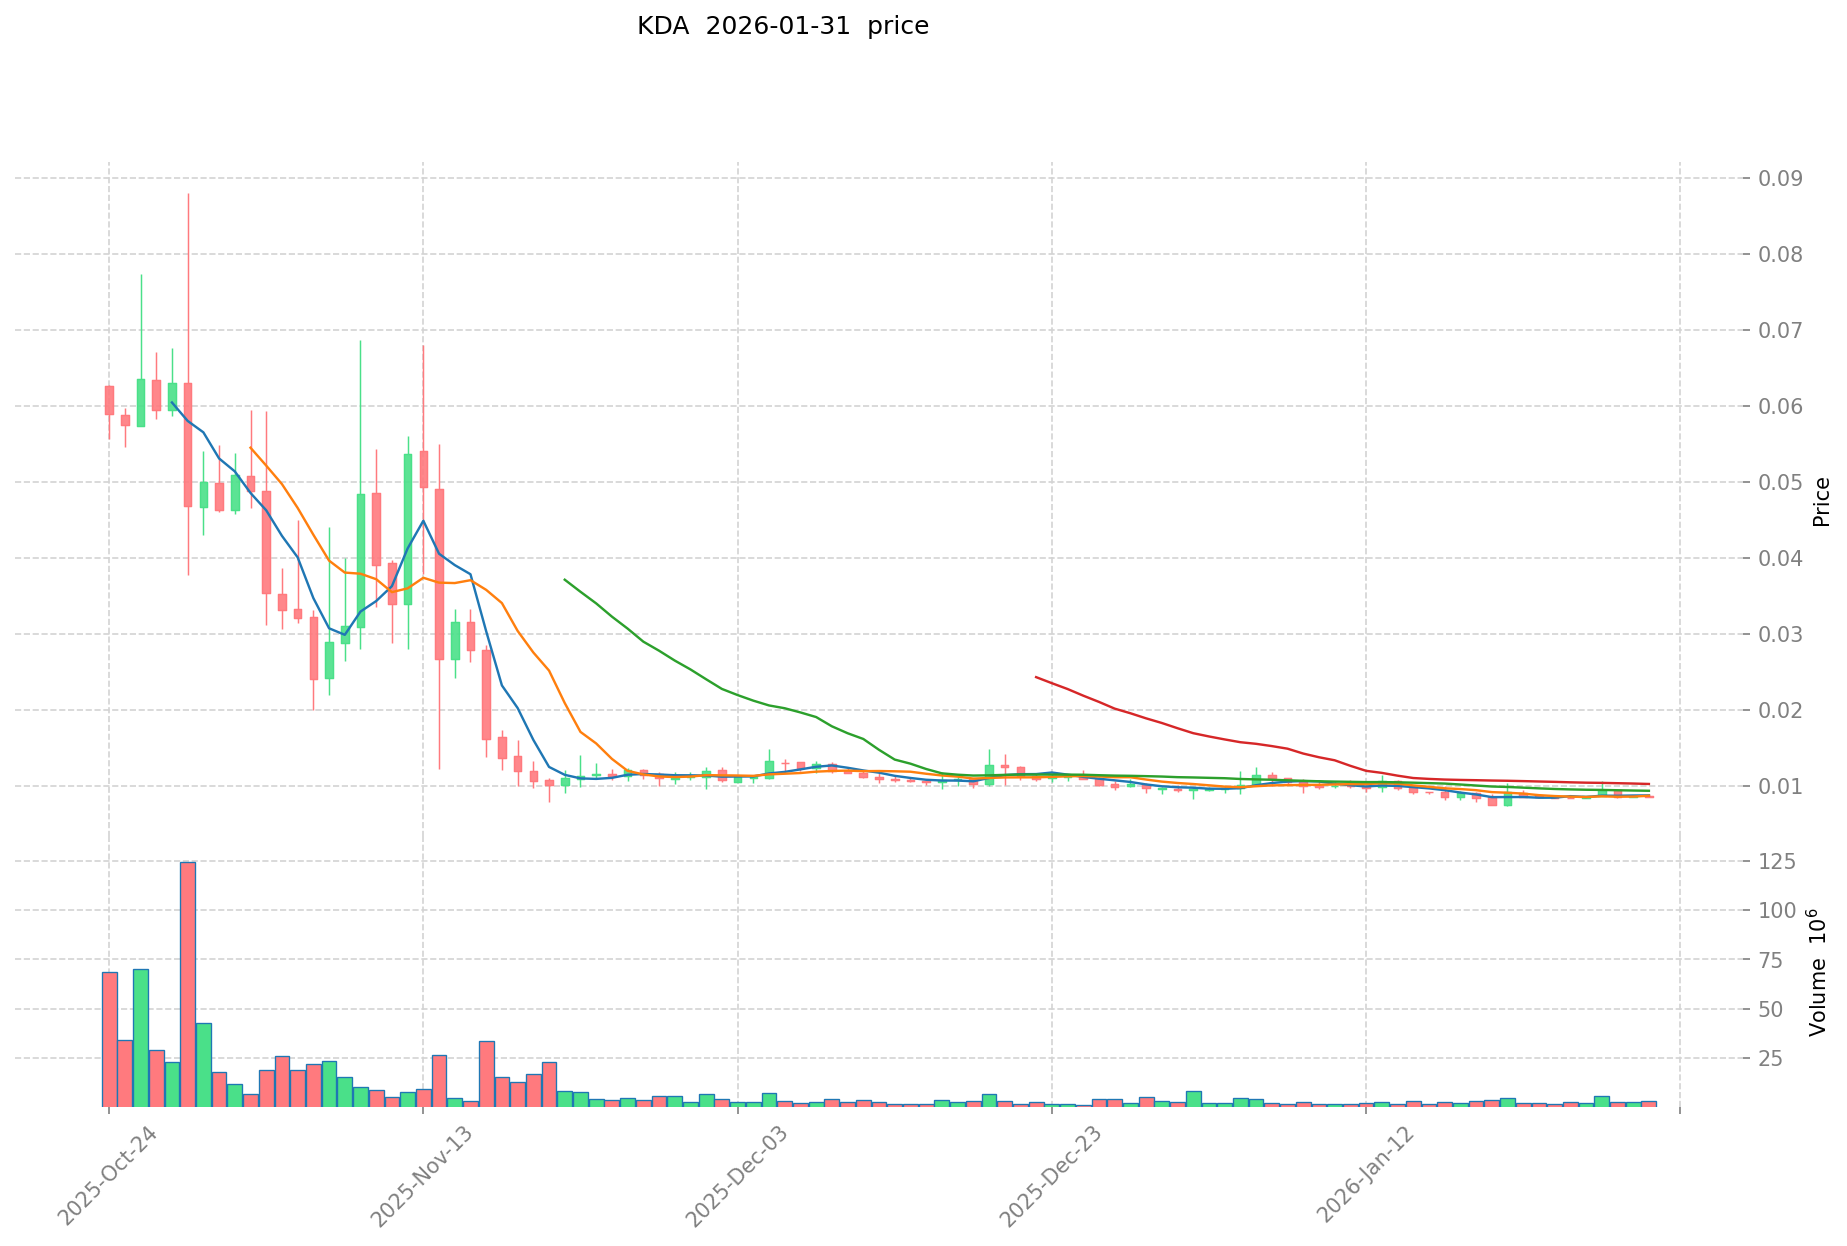
I. Historical Price Comparison and Current Market Status
Historical Price Trends of KDA (Coin A) and HBAR (Coin B)
- 2021: KDA reached a peak price of $27.64 in November 2021, reflecting significant market interest during the broader cryptocurrency bull market cycle.
- 2021: HBAR attained an all-time high of $0.569229 in September 2021, benefiting from growing adoption and network development milestones.
- Comparative Analysis: During the 2021-2026 market cycle, KDA declined from its peak of $27.64 to a historical low of $0.0074283 in January 2026, representing a substantial correction. HBAR experienced a similar downward trajectory, falling from $0.569229 to a recorded low of $0.00986111 in January 2020, with continued volatility through subsequent market cycles.
Current Market Situation (January 31, 2026)
- KDA Current Price: $0.008573
- HBAR Current Price: $0.09862
- 24-Hour Trading Volume: KDA recorded $29,452.79 compared to HBAR's significantly higher volume of $3,925,460.32
- Market Sentiment Index (Fear & Greed Index): 16 (Extreme Fear)
View real-time prices:

II. Core Factors Influencing Investment Value of KDA vs HBAR
Tokenomics Comparison
- KDA: The token operates within Kadena's blockchain infrastructure, with supply mechanisms tied to its proof-of-work consensus model and mining dynamics.
- HBAR: The token functions within the Hedera Hashgraph network, featuring a distinct supply structure governed by the Hedera governing council and network usage patterns.
- 📌 Historical patterns: Supply mechanisms and token distribution models can influence price cycles through emission schedules and market circulation dynamics.
Institutional Adoption and Market Applications
- Institutional holdings: Market data suggests varying degrees of institutional interest in both assets, influenced by factors including network maturity, regulatory clarity, and use case validation.
- Enterprise adoption: Both KDA and HBAR have pursued enterprise-level applications, with implementations spanning different sectors and use cases in distributed ledger technology.
- Policy landscape: Regulatory approaches toward both assets vary across jurisdictions, with ongoing developments in digital asset frameworks potentially affecting market access and institutional participation.
Technology Development and Ecosystem Building
- KDA technology development: Kadena's blockchain architecture focuses on scalability solutions and smart contract capabilities, with ongoing technical improvements aimed at enhancing network performance.
- HBAR technology development: Hedera Hashgraph's directed acyclic graph structure offers alternative consensus mechanisms, with continuous development in network efficiency and throughput capacity.
- Ecosystem comparison: Both networks have pursued ecosystem development across various sectors, including decentralized finance applications, tokenization initiatives, and enterprise solutions, with varying degrees of adoption and implementation.
Macroeconomic Environment and Market Cycles
- Performance in inflationary conditions: Digital assets exhibit different characteristics during various economic environments, influenced by market sentiment, liquidity conditions, and investor risk appetite.
- Macroeconomic monetary policy: Interest rate adjustments, currency valuations, and central bank policies can impact digital asset markets through capital flow dynamics and relative value considerations.
- Geopolitical factors: Cross-border transaction requirements, regulatory developments, and international relations may influence demand patterns for blockchain networks and their associated tokens.
III. 2026-2031 Price Prediction: KDA vs HBAR
Short-term Prediction (2026)
- KDA: Conservative $0.0077-$0.0086 | Optimistic $0.0086-$0.0112
- HBAR: Conservative $0.0650-$0.0985 | Optimistic $0.0985-$0.1074
Medium-term Prediction (2028-2029)
- KDA may enter a consolidation phase with projected price range of $0.0054-$0.0131, showing gradual upward momentum with estimated growth between 30-35%
- HBAR may enter an expansion phase with projected price range of $0.0706-$0.1848, demonstrating stronger volatility and potential growth of approximately 30%
- Key drivers: institutional capital inflows, ETF developments, ecosystem expansion
Long-term Prediction (2030-2031)
- KDA: Baseline scenario $0.0101-$0.0154 | Optimistic scenario $0.0124-$0.0184, with cumulative growth potential reaching 44-79%
- HBAR: Baseline scenario $0.1096-$0.1840 | Optimistic scenario $0.1566-$0.2447, with cumulative growth potential reaching 58-86%
View detailed price predictions for KDA and HBAR
Disclaimer: Price predictions are based on historical data analysis and market modeling. Cryptocurrency markets are highly volatile and subject to numerous unpredictable factors. These projections should not be considered as investment advice, and actual prices may vary significantly from predicted ranges.
KDA:
| Year |
Predicted High Price |
Predicted Average Price |
Predicted Low Price |
Price Change |
| 2026 |
0.01124635 |
0.008585 |
0.0077265 |
0 |
| 2027 |
0.01239459375 |
0.009915675 |
0.0053544645 |
15 |
| 2028 |
0.012047545125 |
0.011155134375 |
0.00613532390625 |
30 |
| 2029 |
0.0131095139175 |
0.01160133975 |
0.006728777055 |
35 |
| 2030 |
0.018409585982287 |
0.01235542683375 |
0.01136699268705 |
44 |
| 2031 |
0.01661310692066 |
0.015382506408018 |
0.010152454229292 |
79 |
HBAR:
| Year |
Predicted High Price |
Predicted Average Price |
Predicted Low Price |
Price Change |
| 2026 |
0.1074086 |
0.09854 |
0.0650364 |
0 |
| 2027 |
0.146223506 |
0.1029743 |
0.077230725 |
4 |
| 2028 |
0.13207483718 |
0.124598903 |
0.0996791224 |
26 |
| 2029 |
0.1848050929296 |
0.12833687009 |
0.0705852785495 |
30 |
| 2030 |
0.21137082503823 |
0.1565709815098 |
0.10959968705686 |
58 |
| 2031 |
0.244681301354439 |
0.183970903274015 |
0.150856140684692 |
86 |
IV. Investment Strategy Comparison: KDA vs HBAR
Long-term vs Short-term Investment Strategies
- KDA: May appeal to investors interested in proof-of-work blockchain infrastructure and enterprise-focused distributed ledger applications, with consideration for longer development timelines and ecosystem maturation phases.
- HBAR: May appeal to investors evaluating alternative consensus mechanisms and networks with established governance frameworks, considering throughput capacity and enterprise adoption trajectories.
Risk Management and Asset Allocation
- Conservative Investors: A balanced approach might consider allocation ratios such as KDA: 30-40% vs HBAR: 60-70%, reflecting different risk-return profiles and market capitalization considerations.
- Aggressive Investors: Higher risk tolerance portfolios might adjust allocations to KDA: 50-60% vs HBAR: 40-50%, accepting greater volatility for potential growth opportunities in emerging blockchain infrastructure.
- Hedging Tools: Portfolio risk management may incorporate stablecoin positions for liquidity management, derivatives instruments where available, and diversification across multiple digital assets to reduce single-asset concentration risk.
V. Potential Risk Comparison
Market Risks
- KDA: Subject to market volatility influenced by broader cryptocurrency market cycles, mining economics, network adoption rates, and competitive dynamics in the blockchain infrastructure sector.
- HBAR: Exposed to market sentiment shifts, network usage patterns, governance council decisions, and competitive positioning within distributed ledger technology markets.
Technical Risks
- KDA: Considerations include network scalability implementation, proof-of-work consensus security maintenance, smart contract platform development progress, and ecosystem infrastructure maturation.
- HBAR: Considerations include hashgraph consensus mechanism performance under varied conditions, network stability during high transaction volumes, and ongoing technical development requirements.
Regulatory Risks
- Regulatory frameworks vary significantly across jurisdictions, potentially affecting both assets differently based on classification approaches, securities law interpretations, and cross-border transaction requirements. Policy developments in major markets may influence network accessibility, institutional participation, and overall market liquidity for both KDA and HBAR.
VI. Conclusion: Which Is the Better Buy?
📌 Investment Value Summary:
- KDA Characteristics: Proof-of-work consensus mechanism, enterprise-focused positioning, smart contract capabilities, with development trajectory tied to institutional blockchain adoption and infrastructure scaling.
- HBAR Characteristics: Hashgraph consensus technology, established governance structure, high throughput capacity, with value proposition connected to enterprise network applications and alternative distributed ledger implementations.
✅ Investment Considerations:
- New Investors: Consider starting with smaller position sizes, focusing on understanding underlying technology differences, market dynamics, and risk tolerance assessment before making allocation decisions between KDA and HBAR.
- Experienced Investors: May evaluate comparative technical architectures, ecosystem development progress, institutional adoption indicators, and historical volatility patterns to inform allocation strategies aligned with portfolio objectives.
- Institutional Investors: Assessment may incorporate regulatory compliance frameworks, custody solutions availability, liquidity requirements, network governance structures, and enterprise use case validation when considering exposure to either asset.
⚠️ Risk Disclaimer: Cryptocurrency markets exhibit high volatility and substantial risk. This content does not constitute investment advice, financial recommendations, or solicitation to buy or sell any assets. Investors should conduct independent research and consult qualified financial professionals before making investment decisions.
VII. FAQ
Q1: What are the main differences between KDA and HBAR's consensus mechanisms?
KDA uses a proof-of-work (PoW) consensus mechanism, while HBAR employs the hashgraph consensus algorithm. KDA's PoW model follows traditional blockchain mining dynamics, requiring computational power to validate transactions and secure the network. HBAR's hashgraph technology utilizes a directed acyclic graph (DAG) structure that enables asynchronous Byzantine Fault Tolerance (aBFT), achieving transaction throughput exceeding 10,000 TPS compared to typical blockchain architectures. This fundamental difference affects network scalability, energy consumption, and transaction finality characteristics between the two assets.
Q2: Which asset showed better price resilience during the 2021-2026 market cycle?
HBAR demonstrated relatively better price resilience, declining approximately 82.7% from its all-time high of $0.569229 to its current price of $0.09862. KDA experienced a more significant correction of approximately 99.97% from its peak of $27.64 to its current price of $0.008573. The 24-hour trading volume differential ($3,925,460.32 for HBAR versus $29,452.79 for KDA as of January 31, 2026) suggests stronger market liquidity and investor interest in HBAR during this period, though both assets faced substantial downward pressure consistent with broader cryptocurrency market conditions.
Q3: What are the projected growth potentials for KDA and HBAR through 2031?
According to price prediction models, HBAR shows higher cumulative growth potential ranging from 58-86% by 2031, with optimistic scenarios projecting prices between $0.1566-$0.2447. KDA's projected cumulative growth ranges from 44-79%, with optimistic scenarios estimating prices between $0.0124-$0.0184. These projections reflect different development trajectories, with HBAR potentially benefiting from established governance frameworks and enterprise adoption momentum, while KDA's growth depends on proof-of-work infrastructure maturation and ecosystem expansion. However, cryptocurrency price predictions carry significant uncertainty and should not be considered guaranteed outcomes.
Q4: How should conservative versus aggressive investors approach allocation between KDA and HBAR?
Conservative investors might consider a portfolio weighting of 30-40% KDA and 60-70% HBAR, reflecting HBAR's larger market capitalization, higher liquidity, and established governance structure. Aggressive investors with higher risk tolerance might adjust allocations to 50-60% KDA and 40-50% HBAR, accepting greater volatility for potential upside in emerging blockchain infrastructure. Both strategies should incorporate risk management tools including stablecoin positions for liquidity, portfolio diversification across multiple digital assets, and position sizing aligned with individual risk tolerance and investment objectives.
Q5: What institutional adoption factors differentiate KDA from HBAR?
Both assets pursue enterprise-level applications but through different approaches. HBAR benefits from a structured governing council comprising established enterprises, potentially providing clearer pathways for institutional adoption and regulatory engagement. KDA focuses on proof-of-work blockchain infrastructure positioned for institutional efficiency improvements through distributed ledger technology. Institutional consideration factors include custody solution availability, regulatory classification across jurisdictions, network governance transparency, demonstrated use case validation, and liquidity requirements for significant capital deployment.
Q6: What are the primary technical risks facing each blockchain network?
KDA faces technical considerations including proof-of-work consensus security maintenance under varying network conditions, smart contract platform development progress, scalability implementation challenges, and ecosystem infrastructure maturation requirements. HBAR's technical risks involve hashgraph consensus mechanism performance during extreme transaction volumes, network stability maintenance, ongoing development dependencies, and adoption challenges associated with alternative consensus architectures. Both networks require continuous technical advancement to maintain competitive positioning within the evolving distributed ledger technology landscape.
Q7: How might regulatory developments differently impact KDA versus HBAR?
Regulatory frameworks vary significantly across jurisdictions and may affect both assets based on classification approaches, securities law interpretations, and distributed ledger technology categorization. HBAR's hashgraph architecture and governance structure may receive different regulatory treatment compared to KDA's proof-of-work blockchain model. Policy developments in major markets regarding mining operations, energy consumption requirements, token classification, and cross-border transaction frameworks could create divergent regulatory environments affecting network accessibility, institutional participation levels, and overall market liquidity for both assets.
Q8: What market conditions would favor KDA over HBAR, or vice versa?
HBAR may perform relatively better during periods emphasizing transaction throughput, enterprise adoption momentum, and established governance frameworks, particularly when institutional interest prioritizes regulatory clarity and network stability. KDA might gain relative advantage during market phases favoring proof-of-work infrastructure, blockchain security emphasis, and smart contract platform development, especially if mining economics improve or institutional demand for traditional blockchain architectures increases. Macroeconomic conditions, regulatory policy shifts, and sector-specific adoption trends can create varying performance dynamics between the two assets across different market environments.
* The information is not intended to be and does not constitute financial advice or any other recommendation of any sort offered or endorsed by Gate.